Alibaba (BABA) Shares Fall to Lowest Level in 2.5 MonthsAlibaba (BABA) Shares Fall to Lowest Level in 2.5 Months
Yesterday, Alibaba (BABA) shares dropped to their lowest level since late April. The decline followed the company’s announcement of a planned bond issuance totalling approximately $1.53 billion, with a maturity date set for 2032. The funds will be used to support the development of Alibaba's cloud infrastructure and expansion of its international e-commerce business.
The market’s negative reaction may stem from concerns over rising debt levels and the potential return on these investments.
Technical Analysis of Alibaba (BABA) Share Price
When analysing the price movements of BABA shares in 2025, two key trading ranges stand out:
→ $126–145: This range originates from the long bullish candle on 20 February, following the release of a strong quarterly report;
→ $96–103: This zone was established in late April, as supply and demand stabilised around the psychologically significant $100 level.
The upper range has since acted as a resistance zone, with the price reversing from it in mid-May. The lower range has served as a support area, particularly in early April when the stock came under pressure after tariff-related headlines.
The current price action is notable in that Alibaba shares have:
→ Broken through the June support level at approximately $111.92;
→ Formed a bearish A-B-C structure, marked by lower highs and lower lows.
Using Fibonacci extension analysis, we can reasonably assume:
→ The $111.92 level is now likely to act as resistance;
→ The next potential target for the ongoing downtrend (leg C→D) lies at the 1 Fibonacci level ($100.55) — aligning closely with the previously identified support zone.
This article represents the opinion of the Companies operating under the FXOpen brand only. It is not to be construed as an offer, solicitation, or recommendation with respect to products and services provided by the Companies operating under the FXOpen brand, nor is it to be considered financial advice.
Alibabaanalysis

Alibaba: Intermediate Correction in ProgressAs Alibaba has remained below resistance at $121.28, we’ve ultimately chosen to consider the high of orange wave x as established. Thus, we currently place the stock in bearish wave y, which should conclude the corrective structure of the larger blue wave (ii). From that point, BABA should reverse, climb back above the $121.28 resistance, and move to significantly higher levels—initially completing blue wave (iii), and eventually the larger turquoise wave 3. However, there’s still a 34% chance that our bearish alternate scenario will play out. In that case, the stock would fall between the two support levels at $80.05 and $58.01, where the low of turquoise wave alt.2 would form.
📈 Over 190 precise analyses, clear entry points, and defined Target Zones - that's what we do.

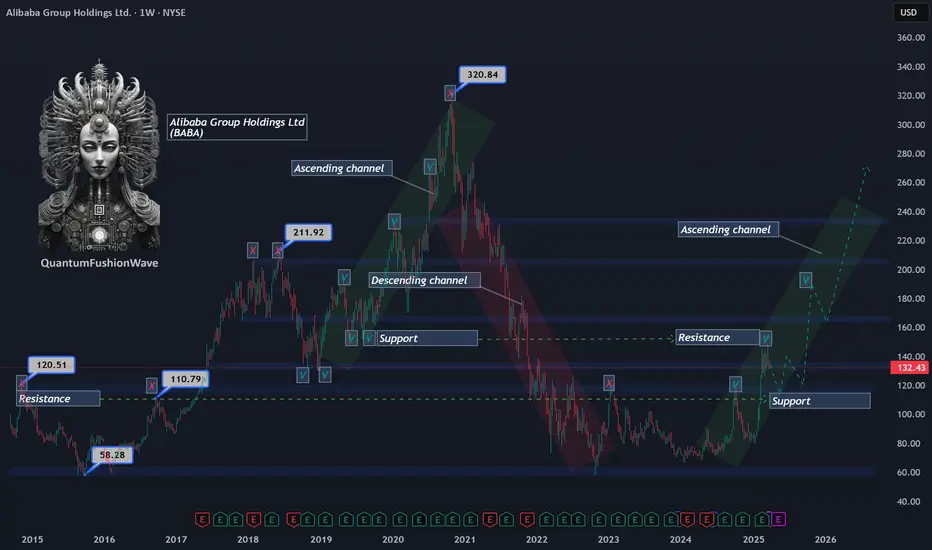
Alibaba (BABA) Technical Analysis:Retracement Within an Ascending Channel
Alibaba (BABA) has faced strong supply pressure at $149, a key price level that previously acted as support in 2019 and has now flipped into resistance. The inability to reclaim this level has triggered a retracement, with the stock currently trading around $132, showing signs of continued corrective movement.
Despite the short-term weakness, BABA remains within a developing ascending channel, suggesting a potential higher timeframe bullish structure. If the retracement extends, the next significant level to watch is $110, a historical 2016 resistance level that could now act as a demand zone. A strong reaction and rejection from this level would reinforce the validity of the ascending channel and increase the probability of a trend continuation toward previous all-time highs.
Key Levels to Watch:
Resistance: $149 (2019 support turned resistance)
Current Price: $132 (active retracement zone)
Support Levels:
$110 – Historical resistance from 2016, potential demand zone
$100 – Psychological level, further downside risk
Traders should monitor price action around these key levels, as a confirmed breakdown below $110 could invalidate the channel and shift market structure to a more bearish outlook, while a strong bounce could provide a high-probability long setup within the channel’s framework.
Alibaba (BABA) Share Price Declines from 40-Month HighAlibaba (BABA) Share Price Declines from 40-Month High
As shown in the Alibaba (BABA) share chart, the price reached a 40-month high this week, surpassing $145 per share.
Bullish sentiment is being fuelled by news related to AI prospects in China. According to media reports:
→ China’s AI spending is increasing through investments from state-owned enterprises, private companies, and local authorities, aiming to keep pace with the US $500 billion Star Gate project.
→ Alibaba plans to invest $52 billion over three years in artificial intelligence and cloud computing.
Technical Analysis of Alibaba (BABA) Shares
Despite a positive fundamental backdrop, the chart signals potential concerns:
→ The price is near the upper boundary of the ascending channel, which could act as resistance.
→ Bulls attempted to break the $145 level (which has acted as resistance since late February) on 17 March but failed, as the price could not hold above this mark.
→ Using your preferred oscillator, you are likely to observe a bearish divergence between peaks A and B.
This suggests that bullish momentum may be weakening, and investors could consider taking profits after Alibaba’s exceptionally strong price rally—up approximately 70% since early 2025. If so, a break below the orange trendline could lead to a correction towards the median of the blue channel.
This article represents the opinion of the Companies operating under the FXOpen brand only. It is not to be construed as an offer, solicitation, or recommendation with respect to products and services provided by the Companies operating under the FXOpen brand, nor is it to be considered financial advice.

Alibaba - with Eyes on $200–$230 by end of 2025Alibaba (BABA): Entering a Bullish Phase
Alibaba (BABA) has officially entered a bullish phase after successfully holding the $80 support level at the beginning of 2024. This strong rejection set the stage for a rally to $127, confirming the start of an uptrend.
Key Resistance Battle: Breaking $130 with Ease?
The next critical price level to watch is $130, last seen in November 2018.
If Alibaba breaks through $130 without effort, this will confirm strong bullish momentum, allowing the stock to continue climbing.
However, if BABA initially fails to break $130, it could trigger a pullback to $108, offering a new entry opportunity before the next leg up.
Long-Term Target: $200–$230 by Late 2025
Phase 1: If Alibaba retests $108 and successfully holds, it will make another attempt to break $130.
Phase 2: Once $130 is broken, BABA will gradually climb to $200 by the end of 2025, following a steady growth pattern without rapid acceleration.
Bullish Catalyst Scenario: If news flow remains favorable, Alibaba could push even higher, targeting $230 by the end of 2025.
Key Price Levels to Watch:
Support: $108 (potential pullback zone if $130 is rejected).
Resistance 1: $130 (major breakout level).
Resistance 2: $200 (main target by year-end 2025).
Bullish Extension: $230 (if market sentiment remains strong).
Summary: Strong Bullish Structure with Potential Upside
Alibaba’s price action suggests a clear uptrend, with $130 being the next major battle zone. If it breaks with ease, expect a smooth climb toward $200 by 2025. If it faces rejection, a pullback to $108 will offer a new buying opportunity before resuming the uptrend.
Should favorable news emerge, Alibaba could even hit $230 by the end of 2025, reinforcing its long-term bullish outlook.

Alibaba (BABA) Shares Surge Following AI Model LaunchAlibaba (BABA) Shares Surge Following AI Model Launch
Chinese e-commerce giant Alibaba has unveiled an upgraded version of its artificial intelligence model, Qwen2.5 Max. According to the company, the model:
→ Outperforms DeepSeek, the AI model that made headlines this week, in several key areas.
→ Achieves "competitive performance compared to top-tier models," referencing OpenAI and Meta, based on benchmark tests.
The news was met with enthusiasm, driving Alibaba's (BABA) stock price up by more than 6% in a single day, pushing BABA shares to their highest level of the year.
The technical analysis of the BABA stock chart shows that stock fluctuations form reference points for constructing the Andrew’s Pitchfork pattern, while price movements along the central line (indicated by an arrow) confirm the validity of the pattern's construction.
Currently, the price:
→ Has broken above December’s high at around $94.
→ Is approaching the psychological resistance level of $100.
Whether bulls can sustain or extend these gains will largely depend on Alibaba’s Q4 earnings report, set to be released today, 29 January.
According to TipRanks:
→ 11 out of 12 analysts recommend buying BABA stock.
→ The 12-month average price target stands at $121.33.
Trade on TradingView with FXOpen. Consider opening an account and access over 700 markets with tight spreads from 0.0 pips and low commissions from $1.50 per lot.
This article represents the opinion of the Companies operating under the FXOpen brand only. It is not to be construed as an offer, solicitation, or recommendation with respect to products and services provided by the Companies operating under the FXOpen brand, nor is it to be considered financial advice.
