ALICE/USDT – Will It Rebound from Demand Zone or Break Down?🧭 Analysis Summary:
ALICE is at a critical turning point, once again testing a historical demand zone that has provided strong support since Q2 2025. The current price action suggests potential accumulation, setting the stage for a significant move — either a powerful bounce or a devastating breakdown.
---
📌 Chart Details (Daily Timeframe):
Main Trend: Still in a macro downtrend since December 2024
Current Price: $0.3714
Key Demand Zone: $0.35 – $0.41 (highlighted yellow box)
Nearest Supports: $0.35 → $0.3102 (2025 low)
Layered Resistance Levels: $0.4786 → $0.5672 → $0.6481 → $0.7986 → $0.9754
---
🧱 Market Structure & Patterns:
Price has been consolidating in a tight range over recent weeks — indicating possible accumulation or distribution.
The long-standing descending channel shows signs of exhaustion, with repeated rejections from the demand zone.
A small double bottom pattern appears to be forming, suggesting a possible reversal if validated.
---
📈 Bullish Scenario – Reversal Potential on Confirmation:
✅ If the price holds above $0.35 and forms a higher low, a trend reversal could take shape.
✅ A breakout above $0.41 would act as the first bullish confirmation.
🎯 Upside Targets:
$0.4786 → minor resistance, good for short-term swing trades
$0.5672 – $0.6481 → mid-range resistance & Fibonacci levels
$0.7986 – $0.9754 → longer-term recovery zone if sentiment improves
💡 Stronger confirmation would come from increasing volume and Daily RSI crossing above 50.
---
📉 Bearish Scenario – Breakdown and Trend Continuation:
❌ A breakdown below $0.35 would likely push price toward the $0.3102 support — the lowest level of the year.
❌ If $0.31 fails, further downside toward $0.25 or even $0.20 is possible, due to a lack of nearby historical support.
💀 This would confirm the continuation of the major downtrend, signaling sellers still have control.
---
📊 Market Sentiment:
On a broader scale, altcoins are still under pressure amid regulatory uncertainty and declining DeFi activity.
However, ALICE’s demand zone remains a high-interest area for traders seeking mid-term accumulation opportunities.
---
🎯 Strategy Ideas:
Strategy Type Action Key Levels
Buy on Breakout Enter on confirmed breakout > $0.41 Target: $0.48 – $0.64
Sell on Breakdown Short below $0.35 Target: $0.31 or lower
Range Trade Buy low, sell high between $0.35–$0.41 Tight stop-loss recommended
---
📝 Conclusion:
ALICE/USDT is at a technical and psychological crossroads. This yellow zone is where big moves often begin — the question is, will bulls take control or will bears pull it deeper? All eyes should be on how price reacts to this demand area.
#ALICEUSDT #CryptoTA #AltcoinAnalysis #DemandZone #BreakoutOrBreakdown #PriceAction #VolumeAnalysis #CryptoReversal #SwingTradeSetup #ALICEAnalysis #CryptoTrend
Aliceusdtidea

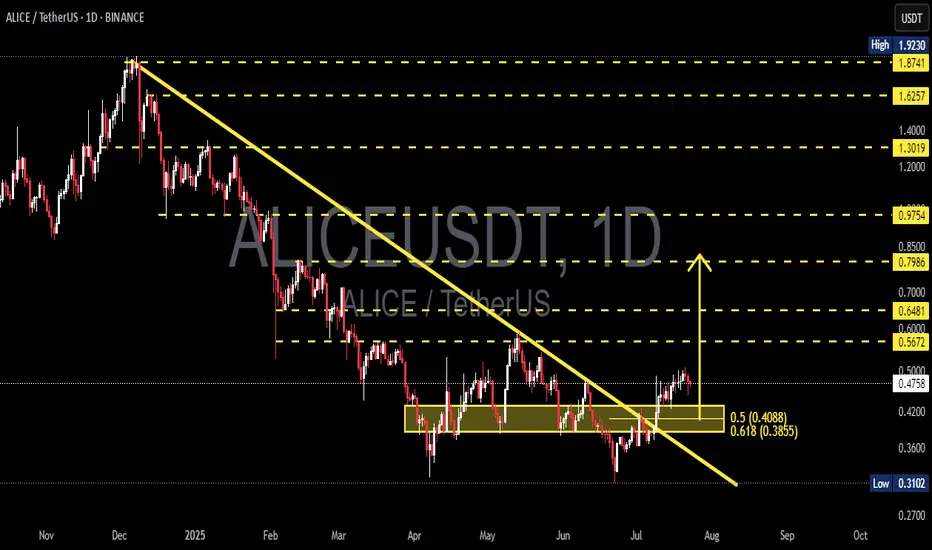
ALICEUSDT: Massive Trendline Breakout + Fibonacci Confluence🔍 Overview:
After months of relentless selling pressure, ALICE has finally broken out of a long-term downtrend that began back in late 2024. But this isn’t just any breakout—it's a strong technical signal pointing toward a potential shift from accumulation to expansion, and possibly a major bullish run.
📌 Key Technical Highlights:
✅ 1. Long-Term Downtrend Breakout:
The descending trendline that has acted as resistance since November 2024 has now been cleanly broken, indicating a reversal in trend and the start of a potential new bullish cycle.
✅ 2. Bullish Accumulation Box (April – July):
ALICE formed a solid horizontal accumulation range between $0.385 and $0.42 for more than three months. A breakout from this range is often the trigger for an impulsive rally.
✅ 3. Golden Pocket Fibonacci Retest:
Price has recently bounced precisely from the 0.5 (0.4088) and 0.618 (0.3855) Fibonacci retracement levels, also known as the “golden pocket”—a high-probability bounce zone favored by smart money.
✅ 4. Clean Fibonacci-Based Targets:
Future resistance levels are well-defined by historical supply zones and Fibonacci extensions—offering a structured pathway for swing trade setups.
🧠 Market Psychology Right Now:
Retail traders are still hesitant after a prolonged downtrend (reduced FOMO = smart entry zone).
Smart money likely completed accumulation within the yellow box range.
This type of breakout often triggers "delayed FOMO" once initial resistances start getting taken out.
📈 Bullish Scenario (High Probability):
As long as ALICE holds above the breakout support at $0.408–$0.42:
🚀 Target 1: $0.5672
🚀 Target 2: $0.6481
🚀 Target 3: $0.7986
🎯 Main Target: $0.9754 (potential 100%+ upside from breakout box)
📉 Bearish Scenario (If Breakout Fails):
If price drops below $0.385:
⛔ It could re-enter the boring sideways range
⛔ Loss of bullish momentum
⛔ Potential retest of $0.31 (previous cycle low)
🟠 This would signal a false breakout — although this scenario currently seems less likely due to strong breakout structure.
🔎 Additional Confirmations:
✅ Breakout volume higher than average
✅ Formation of Higher Highs and Higher Lows
✅ Daily close above both trendline and accumulation box
🧭 Trading Strategy Idea:
Ideal Entry: Pullback to $0.408–$0.42
Stop Loss: Below $0.385
Targets: Use Fibonacci levels for gradual take-profits
Risk/Reward: Setup offers 3:1 or better R/R
✍️ Final Thoughts:
> “The longer the base, the stronger the breakout.”
ALICE has built a solid foundation over several months and now shows all the right signs of a textbook bullish breakout. With a clean structure, Fibonacci alignment, and growing momentum—this setup should be on every swing trader’s radar.
#ALICEUSDT #TrendlineBreakout #FibonacciConfluence #CryptoSetup #AltcoinWatch #BreakoutTrading #TechnicalAnalysis #SwingTradeCrypto #VolumeBreakout
ALICEUSDT 1D AnalysisALICE ~ 1D Analysis
#ALICE Currently it comes out of this declining zone. Maybe this support block you can consider to start buying back from here with a short -term target of at least 10%+.

ALICEUSDT 5DALICE ~ 5D Analysis
#ALICE Test this support block. Buy from here if you still have a Conviction on this coin with a minimum target of 20%+.

ALICEUSDT 1WALICE ~ 1W
#ALICE This is an important support block on this coin. If you still have Conviction on this coin,. This support block would be a very good buying place for now. Buy gradually within this support block.

ALICEUSDT 1WALICE ~ 1W
#ALICE If you still have Conviction on this coin. Buy in increments within this block. The downtrend on this coin has ended. bulls will dominate from here. Minimum target 20%+

ALICEUSD 1WALICE ~ 1W 📈
#ALICE Make purchases gradually from here, with a long-term target of at least 20%++ 📈

#ALICE/USDT#ALICE
The price has been moving in a bearish flag since April 2022
We are now on the verge of breaking that pattern by breaking the downtrend
Supported by oversold on MACD
Current price 1.030
First goal 1.18
Second goal 1.255
The rise will be supported by the break of Moving Average 100
You must pay attention to the correction points on the chart

ALICE/USDT Indicating Breakout the supply and continue upward!💎 ALICE has encountered significant resistance in the supply area. If ALICE manages to successfully break out above this area with a confirmed daily candle close, the upward momentum can continue, probability leading ALICE to reach our target area.
💎 However, if ALICE fails to break out of the supply area, there is a likelihood of price rejection, leading to a gradual downward movement toward the support area around 1.64.
💎 ALICE must bounce back from the support area to attempt another breakout above the supply. Failure to hold the support would signal a bearish trend reversal, indicating further downward movement and possibly reaching even lower levels.

ALICE/USDT Can Alice Bounce from this support ?? Or Break down ?💎 ALICE's market activity has been capturing significant interest recently. Presently, ALICE is positioned at a critical support area that previously acted as resistance.
💎 Historically, this area has been robust enough to prevent significant downturns in ALICE's value, suggesting a potential bounce back is on the horizon. If ALICE successfully rebounds from this support level and breaks through the 1.34 resistance barrier, it could continue its upward trajectory towards the targeted Bearish OB area.
💎 However, should ALICE fail to hold this support level, breaking below it, it would indicate a troubling shift in market sentiment. Such a breakdown would signal the end of the current bullish trend and potentially herald the start of a bearish phase. Under these circumstances, ALICE might enter a downward movement, with its next critical level being the demand area at 0.086.
💎 This demand zone becomes pivotal for ALICE's recovery. To reverse the downward trend, it's essential for ALICE to not only bounce back at this level but also to reclaim its position above the initial support. Failure to achieve this could confirm a bearish trend, potentially leading ALICE to decline even further below the demand area.

ALICE/USDT Could Alice Breaking out the strong resistance ??💎 ALICE has consistently drawn significant interest in the market, yet it has faced considerable challenges in surpassing a key resistance area. Historical patterns show that each time ALICE approaches this strong resistance, it encounters significant rejections.
💎 A breakthrough of this resistance could probability lead to a substantial upward trend, with our next goal being the Bearish OB target.
💎 However, if ALICE fails to achieve a breakout soon, it might retreat to retest the support level around $1.08 to gather momentum for another attempt at a breakout.
💎 The support area around $1.08 is crucial for ALICE. For a positive trend to continue, ALICE needs to demonstrate a strong bounce from this level. If, however, ALICE merely consolidates at this support without showing any significant recovery, there's a risk that it could lose this support level.
💎 Such a development would be a bearish signal, potentially indicating a breakdown below the support bullish trendline. Should this occur, the next probable destination for ALICE would be the strong support area.

Alice to WonderLand or Dump?BINANCE:ALICEUSDT
✅Before we start to discuss, I would be glad if you share your opinion on this post's comment section and hit the like button if you enjoyed it.
Thank you.
Possible Targets and Explanation
➡️Fib since April 2022 drop. We probably can retest -0.18 Zones
➡️At this level now is fundamental value of Alice by "Take Profit" indicator last green line
➡️Every time when we touch this line or trade under than we can expect massive bounce
➡️Now we trade under 0 level and bounced from Buy line on "Take profit" indicator which is also good enter point
➡️Signal to Buy on "TradeON" indicator
➡️Take profit target for this trade will be at 2.82 and 3.18
➡️But this is dynamic metrics use stop loss even if you trade by limit orders.
Hope you enjoyed the content I created, You can support with your likes and comments this idea so more people can watch!
✅Disclaimer: Please be aware of the risks involved in trading. This idea was made for educational purposes only not for financial Investment Purposes.
* Look at my ideas about interesting altcoins in the related section down below ↓
* For more ideas please hit "Like" and "Follow"!

Alice/usdt Short Term Aliceusdt
Breaking Out Trendline resistance on hourly time frame
Short Term - Expecting 20-30% Bullish Move
Note :Risk Management Must & Do Your Own Research Before Entering Any Trade

Alice/usdt Getting Ready For Breakout Aliceusdt
Alice/USDT appears to be gearing up for a breakout. If the breakout is successful, we could see a bullish move of 150-250% in the mid-term.

ALICEUSDTI found ALICE breakdown the rising wedge successfully and retested the support/resistance line. I can assume that it will hit the $1.10 soon before any uptrend.
I hope you will like this idea. Please don't forget to like and follow for more upcoming ideas :)
PLESAE NOTE: Kindly manage your risk! This analysis is based on the chart trend, pattern, EMA & RSI . This is only for the education purpose.

🟢 ALICEUSDT -1H (08/12/2022)🟢 ALICEUSDT
TF: 1H
Side: Long
SL: 10%
TP 1: $1.2961
TP 2: $1.3148
TP 3: $1.3299
ALICE looks like it is getting to move.
Bullish divergence and an FVG to fill.

ALICEUSDT - Falling Wedge Pattern!!ALICEUSDT (1D Chart) Technical analysis
ALICEUSDT (1D Chart) Currently trading at $1.67
Buy level: Above $1.65
Stop loss: Below $1.37
TP1:$1.80
TP2: $2.2
TP3: $2.5
TP4: $2.9
Max Leverage 2x
Always keep Stop loss
Follow Our Tradingview Account for More Technical Analysis Updates, | Like, Share and Comment Your thoughts

ALICEUSDT Analysis (LOCAL VISION)Hello friends.
Please support my work by clicking the LIKE button👍(If you liked). Also i will appreciate for ur activity. Thank you!
Everything on the chart.
recently i've mistake in markup, this is correct, so far we are going at least to retest 10$,
for further growth we need to break through 12$, if we break through then it will be possible to buy on corrections with higher targets.
Entry: market and lower
Target: 8.5 and 9.9
after first target reached move ur stop to breakeven
Stop: (depending of ur risk). ALWAYS follow ur RM .
risk is justified
Good luck everyone!
Follow me on TRADINGView, if you don't want to miss my next analysis or signals.
It's not financial advice.
Dont Forget, always make your own research before to trade my ideas!
Open to any questions and suggestions.

ALICEUSDT WAVE ANALYSIS (GLOBAL VISION)Hello friends.
Please support my work by clicking the LIKE button👍(If you liked). Also i will appreciate for ur activity. Thank you!
Everything on the chart.
We fell a little bit lower than I expected earlier, but the targets from above are relevant.
Entry: market and lower
Target: 15 - 22 - 35
after first target reached move ur stop to breakeven
Stop: (depending of ur risk). ALWAYS follow ur RM.
cancellation of growth consolidation below 3.5
Risk/reward: 1 to 10
risk is justified
Good luck everyone!
Follow me on TRADINGView, if you don't want to miss my next analysis or signals.
It's not financial advice.
Dont Forget, always make your own research before to trade my ideas!
Open to any questions and suggestions.

ALICEUSDT, We are reaching to the supportHello everybody
Do you know about ALICE ? Do you whats going to do ?
If you want to learn fundamental and technical analysis send us messages in private
According to the chart and last analysis of ALICE exactly both of the target reached and now, the price is moving in downward trend and its going to reach to the support zone area.
We expect the price is ready to change trend and the market maker of it want to have some upwards movement because of the momentum that is becoming weak and ...
At first we should wait the price impact to the support zone area then we should take trigger for entrance after that we should be ready to take in position or spot in trading.
If you have any question send us messages in private
Good Luck
Abtin
Previous analysis :

ALICEUSDT LONGTERM VISION (STRONG BUY)Hello friends.
Please support my work by clicking the LIKE button(If you liked).Thank you!
Everything on the chart.
We are stay on strong horizontal support,
We are above MA200 on 1D TF,
We are above trendline,
We are above horizontal volume on 1D TF,
RSX 1D TF on the bottom,
Also from 3$ to 23$ was impulse(5waves), after impulse should be atleast one more impulse, so in the worst case, we will see at least $ 35. At best, with a strong bull run, $ 65-75 looks quite real.
buy zone: 11-13$
midterm targets: 24 - 30 - 35$
longterm targets: 35 - 55 - (65-75$ zone)
after first target reached move ur stop to breakeven
cancellation of growth, consolidation below ~7.5-8$
stop: im w/o stop (depending of ur risk). ALWAYS follow ur RM .
risk is justified
Good luck everyone!
Follow me on TRADINGView, if you don't want to miss my next analysis or signals.
It's not financial advice.
Dont Forget, always make your own research before to trade my ideas!

ALICEUSDT AnalysisHello friends.
Please support my work by clicking the LIKE button(If you liked).Thank you!
Everything on the chart.
open pos: market and lower
target: 25 - 30 - 35
after first target reached move ur stop to breakeven
stop: (depending of ur risk). ALWAYS follow ur RM .
risk is justified
Good luck everyone!
Follow me on TRADINGView, if you don't want to miss my next analysis or signals.
It's not financial advice.
Dont Forget, always make your own research before to trade my ideas!

Simple and Powerful Deal MyNeighborAlice Alice/USDTSimple and Powerful Deal
The blue trend line: staying above it means positive
The green trend line: touches the first target
Orange horizontal line: second target
Red horizontal line: Stop Loss
Like - Follow
