ALICE/USDT – Will It Rebound from Demand Zone or Break Down?🧭 Analysis Summary:
ALICE is at a critical turning point, once again testing a historical demand zone that has provided strong support since Q2 2025. The current price action suggests potential accumulation, setting the stage for a significant move — either a powerful bounce or a devastating breakdown.
---
📌 Chart Details (Daily Timeframe):
Main Trend: Still in a macro downtrend since December 2024
Current Price: $0.3714
Key Demand Zone: $0.35 – $0.41 (highlighted yellow box)
Nearest Supports: $0.35 → $0.3102 (2025 low)
Layered Resistance Levels: $0.4786 → $0.5672 → $0.6481 → $0.7986 → $0.9754
---
🧱 Market Structure & Patterns:
Price has been consolidating in a tight range over recent weeks — indicating possible accumulation or distribution.
The long-standing descending channel shows signs of exhaustion, with repeated rejections from the demand zone.
A small double bottom pattern appears to be forming, suggesting a possible reversal if validated.
---
📈 Bullish Scenario – Reversal Potential on Confirmation:
✅ If the price holds above $0.35 and forms a higher low, a trend reversal could take shape.
✅ A breakout above $0.41 would act as the first bullish confirmation.
🎯 Upside Targets:
$0.4786 → minor resistance, good for short-term swing trades
$0.5672 – $0.6481 → mid-range resistance & Fibonacci levels
$0.7986 – $0.9754 → longer-term recovery zone if sentiment improves
💡 Stronger confirmation would come from increasing volume and Daily RSI crossing above 50.
---
📉 Bearish Scenario – Breakdown and Trend Continuation:
❌ A breakdown below $0.35 would likely push price toward the $0.3102 support — the lowest level of the year.
❌ If $0.31 fails, further downside toward $0.25 or even $0.20 is possible, due to a lack of nearby historical support.
💀 This would confirm the continuation of the major downtrend, signaling sellers still have control.
---
📊 Market Sentiment:
On a broader scale, altcoins are still under pressure amid regulatory uncertainty and declining DeFi activity.
However, ALICE’s demand zone remains a high-interest area for traders seeking mid-term accumulation opportunities.
---
🎯 Strategy Ideas:
Strategy Type Action Key Levels
Buy on Breakout Enter on confirmed breakout > $0.41 Target: $0.48 – $0.64
Sell on Breakdown Short below $0.35 Target: $0.31 or lower
Range Trade Buy low, sell high between $0.35–$0.41 Tight stop-loss recommended
---
📝 Conclusion:
ALICE/USDT is at a technical and psychological crossroads. This yellow zone is where big moves often begin — the question is, will bulls take control or will bears pull it deeper? All eyes should be on how price reacts to this demand area.
#ALICEUSDT #CryptoTA #AltcoinAnalysis #DemandZone #BreakoutOrBreakdown #PriceAction #VolumeAnalysis #CryptoReversal #SwingTradeSetup #ALICEAnalysis #CryptoTrend
Aliceusdtlong

ALICEUSDT: Massive Trendline Breakout + Fibonacci Confluence🔍 Overview:
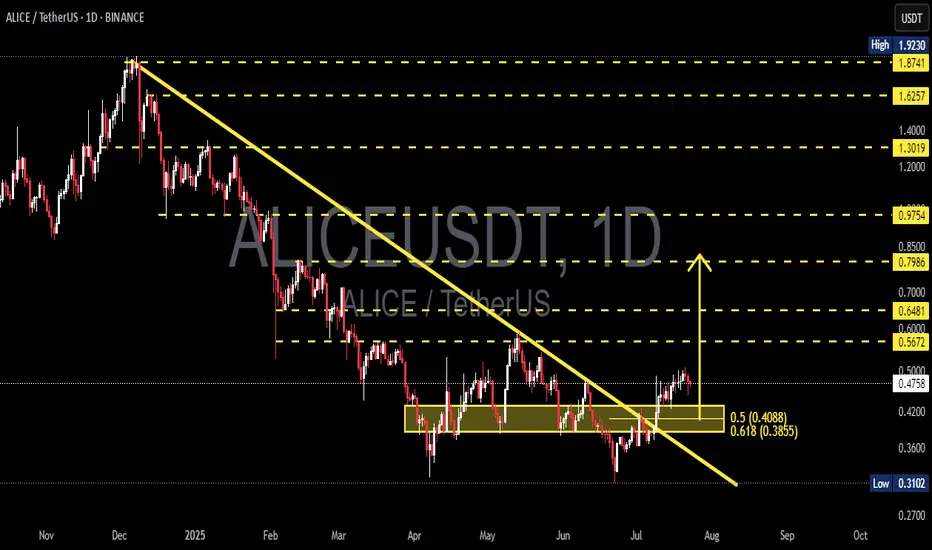
After months of relentless selling pressure, ALICE has finally broken out of a long-term downtrend that began back in late 2024. But this isn’t just any breakout—it's a strong technical signal pointing toward a potential shift from accumulation to expansion, and possibly a major bullish run.
📌 Key Technical Highlights:
✅ 1. Long-Term Downtrend Breakout:
The descending trendline that has acted as resistance since November 2024 has now been cleanly broken, indicating a reversal in trend and the start of a potential new bullish cycle.
✅ 2. Bullish Accumulation Box (April – July):
ALICE formed a solid horizontal accumulation range between $0.385 and $0.42 for more than three months. A breakout from this range is often the trigger for an impulsive rally.
✅ 3. Golden Pocket Fibonacci Retest:
Price has recently bounced precisely from the 0.5 (0.4088) and 0.618 (0.3855) Fibonacci retracement levels, also known as the “golden pocket”—a high-probability bounce zone favored by smart money.
✅ 4. Clean Fibonacci-Based Targets:
Future resistance levels are well-defined by historical supply zones and Fibonacci extensions—offering a structured pathway for swing trade setups.
🧠 Market Psychology Right Now:
Retail traders are still hesitant after a prolonged downtrend (reduced FOMO = smart entry zone).
Smart money likely completed accumulation within the yellow box range.
This type of breakout often triggers "delayed FOMO" once initial resistances start getting taken out.
📈 Bullish Scenario (High Probability):
As long as ALICE holds above the breakout support at $0.408–$0.42:
🚀 Target 1: $0.5672
🚀 Target 2: $0.6481
🚀 Target 3: $0.7986
🎯 Main Target: $0.9754 (potential 100%+ upside from breakout box)
📉 Bearish Scenario (If Breakout Fails):
If price drops below $0.385:
⛔ It could re-enter the boring sideways range
⛔ Loss of bullish momentum
⛔ Potential retest of $0.31 (previous cycle low)
🟠 This would signal a false breakout — although this scenario currently seems less likely due to strong breakout structure.
🔎 Additional Confirmations:
✅ Breakout volume higher than average
✅ Formation of Higher Highs and Higher Lows
✅ Daily close above both trendline and accumulation box
🧭 Trading Strategy Idea:
Ideal Entry: Pullback to $0.408–$0.42
Stop Loss: Below $0.385
Targets: Use Fibonacci levels for gradual take-profits
Risk/Reward: Setup offers 3:1 or better R/R
✍️ Final Thoughts:
> “The longer the base, the stronger the breakout.”
ALICE has built a solid foundation over several months and now shows all the right signs of a textbook bullish breakout. With a clean structure, Fibonacci alignment, and growing momentum—this setup should be on every swing trader’s radar.
#ALICEUSDT #TrendlineBreakout #FibonacciConfluence #CryptoSetup #AltcoinWatch #BreakoutTrading #TechnicalAnalysis #SwingTradeCrypto #VolumeBreakout
#ALICE/USDT Ready to go higher#ALICE
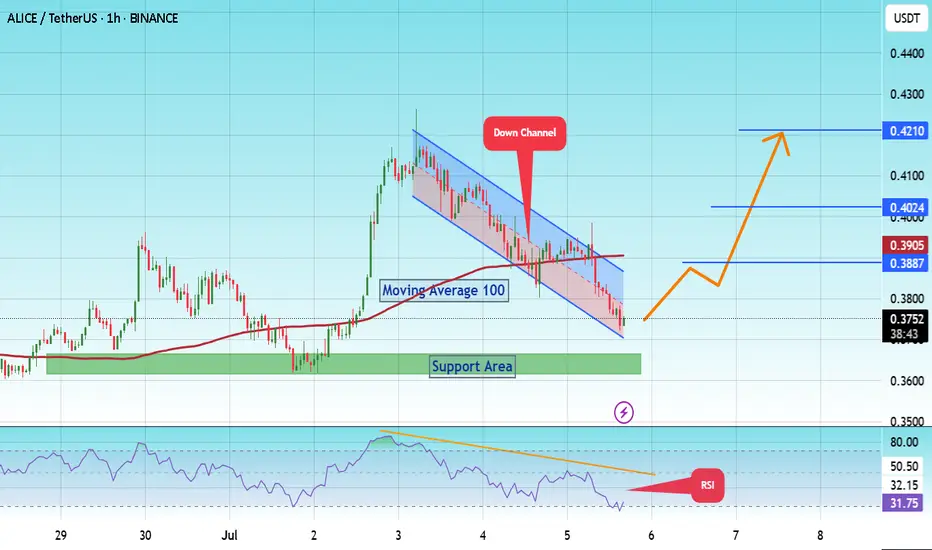
The price is moving within a descending channel on the 1-hour frame and is expected to break and continue upward.
We have a trend to stabilize above the 100 moving average once again.
We have a downtrend on the RSI indicator that supports the upward break.
We have a support area at the lower boundary of the channel at 0.3700, acting as strong support from which the price can rebound.
We have a major support area in green that pushed the price higher at 0.3632.
Entry price: 0.3753.
First target: 0.3887.
Second target: 0.4024.
Third target: 0.4210.
To manage risk, don't forget stop loss and capital management.
When you reach the first target, save some profits and then change the stop order to an entry order.
For inquiries, please comment.
Thank you.
#ALICE/USDT#ALICE
The price is moving within a descending channel on the 1-hour frame, adhering well to it, and is on its way to breaking it strongly upwards and retesting it.
We are seeing a bounce from the lower boundary of the descending channel, which is support at 0.4560.
We have a downtrend on the RSI indicator that is about to break and retest, supporting the upward trend.
We are looking for stability above the 100 moving average.
Entry price: 0.4835
First target: 0.5028
Second target: 0.5263
Third target: 0.5533

ALICEUSDT 1D AnalysisALICE ~ 1D Analysis
#ALICE Currently it comes out of this declining zone. Maybe this support block you can consider to start buying back from here with a short -term target of at least 10%+.

#ALICE/USDT#ALICE
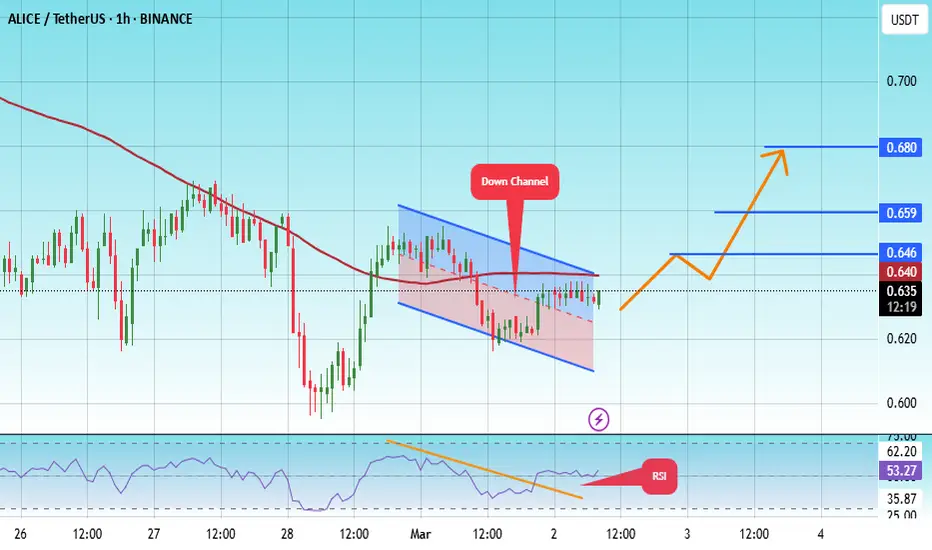
The price is moving in a descending channel on the 1-hour frame and is adhering to it well and is heading to break it strongly upwards and retest it
We have a bounce from the lower limit of the descending channel, this support is at a price of 0.615
We have a downtrend on the RSI indicator that is about to break and retest, which supports the rise
We have a trend to stabilize above the moving average 100
Entry price 0635
First target 0.646
Second target 0.660
Third target 0.680
ALICEUSDT 5DALICE ~ 5D Analysis
#ALICE Test this support block. Buy from here if you still have a Conviction on this coin with a minimum target of 20%+.

#ALICE/USDT Ready to go higher#ALICE
The price is moving in a descending channel on the 1-hour frame and sticking to it well
We have a bounce from the lower limit of the descending channel, this support is at 1.08
We have a downtrend on the RSI indicator that is about to break, which supports the rise
We have a trend to stabilize above the moving average 100
Entry price 1.18
First target 1.22
Second target 1.264
Third target 1.325

ALICEUSDT 1WALICE ~ 1W
#ALICE This is an important support block on this coin. If you still have Conviction on this coin,. This support block would be a very good buying place for now. Buy gradually within this support block.

ALICEUSDT 1WALICE ~ 1W
#ALICE If you still have Conviction on this coin. Buy in increments within this block. The downtrend on this coin has ended. bulls will dominate from here. Minimum target 20%+

Alice Big Move SoonerAlice testing a key pivot here.
Holding here can trigger a huge move.
Added to longs under 1.200(stops at 1.150)
Also added to Spot Bags here(stops under 1.050)
Spot Target 6(Longterm)
Apeing in before volume hits.
Note: Not a Financial Advise.

ALICE/Usdt Plan will ALICE/USDT Plan
The price is currently trading in a triangle pattern, and I anticipate a breakout soon. The market structure appears bullish, so keep a close watch. Remember, this is not financial advice—always do your own research.

#ALICE/USDT#ALICE
The price is moving in a bearish channel on a 4-hour frame and is holding it strongly and is about to break it upward
We have a bounce from the green support area at 1.10
We have a tendency to stabilize above the Moving Average 100
We have a downtrend on the RSI indicator that is about to break higher and supports the rise
Entry price 1.26
The first goal is 1.57
Second goal 1.91
Third goal 2.32

ALICE Strike - Can it reach $3.20Alice has experienced a significant price surge due to increased volume over the past few days. Currently, the price is above the resistance level; it remains to be seen whether it will maintain this position or close below the resistance.

#ALICE/USDT#ALICE
We have a bearish channel on a 4-hour frame,
the price moves within it and adheres to its limits well
We have a major support area at Saad 1.0
We have a tendency to stabilize above moving average 100
We have a downtrend on the RSI indicator that has been broken to the upside
Entry price is 1.19
The first goal is 1.44
Second goal 1.79
Third goal 2.20

ALICEUSD 1WALICE ~ 1W 📈
#ALICE Make purchases gradually from here, with a long-term target of at least 20%++ 📈

ALICE/USDT Idea ALICE/USDT:
The price of ALICE/USDT is currently attempting to break out above the trendline resistance on the 4-hour timeframe. In my analysis, I anticipate a successful breakout. In the event of a confirmed breakout, I expect a bullish movement of around 20-40% in the short-term. It is essential to exercise caution and wait for confirmation before entering any trades.
Please note that the above information is not financial advice. It is always recommended to conduct your research and analysis before making any financial decisions.

#ALICE/USDT#ALICE
The price has been moving in a bearish flag since April 2022
We are now on the verge of breaking that pattern by breaking the downtrend
Supported by oversold on MACD
Current price 1.030
First goal 1.18
Second goal 1.255
The rise will be supported by the break of Moving Average 100
You must pay attention to the correction points on the chart

#ALICE/USDT LONG#ALICE
The price has been moving in a bearish flag since April 2022
This pattern was broken by breaking the downtrend
Supported by my sell saturation on the MACD on a daily frame
Current price 1.18
First goal 1.79
Second goal 2.25
The rise is supported by the moving average 100 break of
We have a lot of bullishness in Bitcoin

SasanSeifi 💁♂ALICE ⏩ $3/$4 /$6.50 Hi there!
As you can see in the chart, after a nearly two-year downtrend, the price of the ALICE cryptocurrency has experienced a slight uptrend from the $0.60 range to $1.50. Following this growth, the price pulled back to the $1 level and resumed its uptrend, currently trading around $2. In the long term, there is a possibility of further growth for this currency.
If the $1.50 level is maintained, we can consider a scenario where the price rises to the $3 and $4 liquidity zones. We can then expect a negative reaction from the desired areas. If the price continues to rise, we need to see how it reacts to these areas to better understand the continuation of the trend. The possible trend is also shown in the image above.
🔵Remember, always conduct your analysis and consider other factors before making any trading decisions. Good luck!"✌️
❎ (DYOR)...⚠️⚜️
Sure, if you have any more questions or need further clarification, feel free to ask. I'm here to help!☺✌
if you found my analysis helpful, I would appreciate it if you could show your support by liking and commenting. Thank you!🙌🙌

Alice/usdt Short Term Aliceusdt
Breaking Out Trendline resistance on hourly time frame
Short Term - Expecting 20-30% Bullish Move
Note :Risk Management Must & Do Your Own Research Before Entering Any Trade

#ALICEIt has left the weekly long-term channel, which has a dynamic trigger. If the pullback is corrected and completed, it can continue to grow up to the HKEX:3 range, which is a strong supply zone.

Alice/usdt Getting Ready For Breakout Aliceusdt
Alice/USDT appears to be gearing up for a breakout. If the breakout is successful, we could see a bullish move of 150-250% in the mid-term.
