ALICEUSDT: Massive Trendline Breakout + Fibonacci Confluence🔍 Overview:
After months of relentless selling pressure, ALICE has finally broken out of a long-term downtrend that began back in late 2024. But this isn’t just any breakout—it's a strong technical signal pointing toward a potential shift from accumulation to expansion, and possibly a major bullish run.
📌 Key Technical Highlights:
✅ 1. Long-Term Downtrend Breakout:
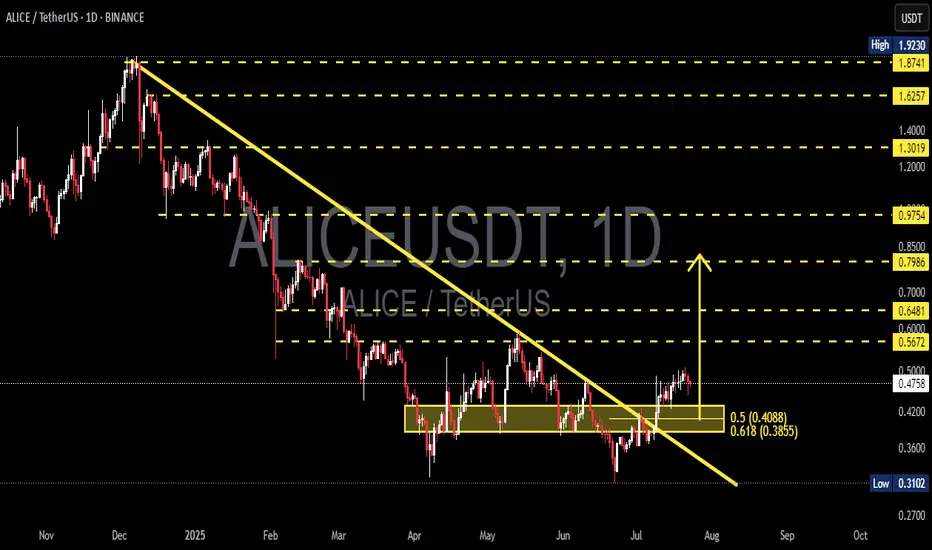
The descending trendline that has acted as resistance since November 2024 has now been cleanly broken, indicating a reversal in trend and the start of a potential new bullish cycle.
✅ 2. Bullish Accumulation Box (April – July):
ALICE formed a solid horizontal accumulation range between $0.385 and $0.42 for more than three months. A breakout from this range is often the trigger for an impulsive rally.
✅ 3. Golden Pocket Fibonacci Retest:
Price has recently bounced precisely from the 0.5 (0.4088) and 0.618 (0.3855) Fibonacci retracement levels, also known as the “golden pocket”—a high-probability bounce zone favored by smart money.
✅ 4. Clean Fibonacci-Based Targets:
Future resistance levels are well-defined by historical supply zones and Fibonacci extensions—offering a structured pathway for swing trade setups.
🧠 Market Psychology Right Now:
Retail traders are still hesitant after a prolonged downtrend (reduced FOMO = smart entry zone).
Smart money likely completed accumulation within the yellow box range.
This type of breakout often triggers "delayed FOMO" once initial resistances start getting taken out.
📈 Bullish Scenario (High Probability):
As long as ALICE holds above the breakout support at $0.408–$0.42:
🚀 Target 1: $0.5672
🚀 Target 2: $0.6481
🚀 Target 3: $0.7986
🎯 Main Target: $0.9754 (potential 100%+ upside from breakout box)
📉 Bearish Scenario (If Breakout Fails):
If price drops below $0.385:
⛔ It could re-enter the boring sideways range
⛔ Loss of bullish momentum
⛔ Potential retest of $0.31 (previous cycle low)
🟠 This would signal a false breakout — although this scenario currently seems less likely due to strong breakout structure.
🔎 Additional Confirmations:
✅ Breakout volume higher than average
✅ Formation of Higher Highs and Higher Lows
✅ Daily close above both trendline and accumulation box
🧭 Trading Strategy Idea:
Ideal Entry: Pullback to $0.408–$0.42
Stop Loss: Below $0.385
Targets: Use Fibonacci levels for gradual take-profits
Risk/Reward: Setup offers 3:1 or better R/R
✍️ Final Thoughts:
> “The longer the base, the stronger the breakout.”
ALICE has built a solid foundation over several months and now shows all the right signs of a textbook bullish breakout. With a clean structure, Fibonacci alignment, and growing momentum—this setup should be on every swing trader’s radar.
#ALICEUSDT #TrendlineBreakout #FibonacciConfluence #CryptoSetup #AltcoinWatch #BreakoutTrading #TechnicalAnalysis #SwingTradeCrypto #VolumeBreakout
ALICEUSDTPERP
#ALICE/USDT Ready to go higher#ALICE
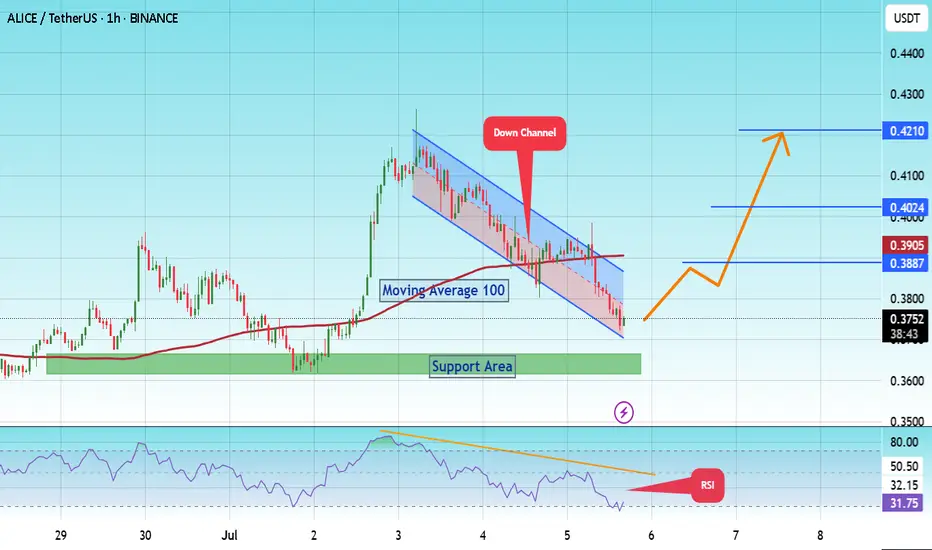
The price is moving within a descending channel on the 1-hour frame and is expected to break and continue upward.
We have a trend to stabilize above the 100 moving average once again.
We have a downtrend on the RSI indicator that supports the upward break.
We have a support area at the lower boundary of the channel at 0.3700, acting as strong support from which the price can rebound.
We have a major support area in green that pushed the price higher at 0.3632.
Entry price: 0.3753.
First target: 0.3887.
Second target: 0.4024.
Third target: 0.4210.
To manage risk, don't forget stop loss and capital management.
When you reach the first target, save some profits and then change the stop order to an entry order.
For inquiries, please comment.
Thank you.
#ALICE/USDT#ALICE
The price is moving within a descending channel on the 1-hour frame, adhering well to it, and is on its way to breaking it strongly upwards and retesting it.
We are seeing a bounce from the lower boundary of the descending channel, which is support at 0.4560.
We have a downtrend on the RSI indicator that is about to break and retest, supporting the upward trend.
We are looking for stability above the 100 moving average.
Entry price: 0.4835
First target: 0.5028
Second target: 0.5263
Third target: 0.5533

ALICEUSDT 1D AnalysisALICE ~ 1D Analysis
#ALICE Currently it comes out of this declining zone. Maybe this support block you can consider to start buying back from here with a short -term target of at least 10%+.

#ALICE/USDT#ALICE
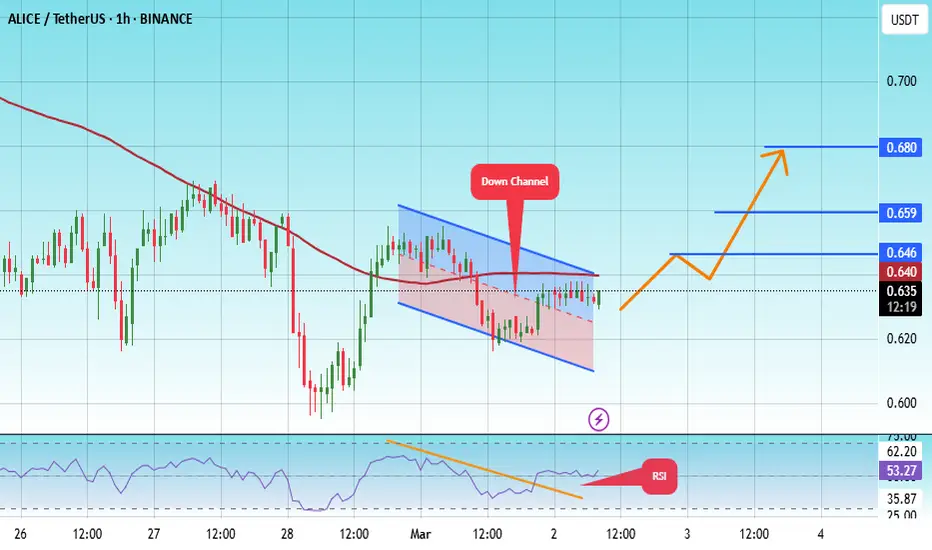
The price is moving in a descending channel on the 1-hour frame and is adhering to it well and is heading to break it strongly upwards and retest it
We have a bounce from the lower limit of the descending channel, this support is at a price of 0.615
We have a downtrend on the RSI indicator that is about to break and retest, which supports the rise
We have a trend to stabilize above the moving average 100
Entry price 0635
First target 0.646
Second target 0.660
Third target 0.680
ALICEUSDT 5DALICE ~ 5D Analysis
#ALICE Test this support block. Buy from here if you still have a Conviction on this coin with a minimum target of 20%+.

#ALICE/USDT Ready to go higher#ALICE
The price is moving in a descending channel on the 1-hour frame and sticking to it well
We have a bounce from the lower limit of the descending channel, this support is at 1.08
We have a downtrend on the RSI indicator that is about to break, which supports the rise
We have a trend to stabilize above the moving average 100
Entry price 1.18
First target 1.22
Second target 1.264
Third target 1.325

ALICEUSDT 1WALICE ~ 1W
#ALICE This is an important support block on this coin. If you still have Conviction on this coin,. This support block would be a very good buying place for now. Buy gradually within this support block.

ALICEUSDT 1WALICE ~ 1W
#ALICE If you still have Conviction on this coin. Buy in increments within this block. The downtrend on this coin has ended. bulls will dominate from here. Minimum target 20%+

Alice Big Move SoonerAlice testing a key pivot here.
Holding here can trigger a huge move.
Added to longs under 1.200(stops at 1.150)
Also added to Spot Bags here(stops under 1.050)
Spot Target 6(Longterm)
Apeing in before volume hits.
Note: Not a Financial Advise.

Alice LongEntered LL Long under 1.155.
Stops at 1.130
A bit risky but
Might go for a good move.
Note: Not a Financial Advise.

ALICE/Usdt Plan will ALICE/USDT Plan
The price is currently trading in a triangle pattern, and I anticipate a breakout soon. The market structure appears bullish, so keep a close watch. Remember, this is not financial advice—always do your own research.

#ALICE/USDT#ALICE
The price is moving in a bearish channel on a 4-hour frame and is holding it strongly and is about to break it upward
We have a bounce from the green support area at 1.10
We have a tendency to stabilize above the Moving Average 100
We have a downtrend on the RSI indicator that is about to break higher and supports the rise
Entry price 1.26
The first goal is 1.57
Second goal 1.91
Third goal 2.32

Alice trade idea.Alice was top gainer few days back and it has good volume inflow as well. That's why I added in my watchlist and did analysis. I have found a good trade setup that is very clear on the chart. no need for explanation. Chart speaks itself.

#ALICE/USDT#ALICE
We have a bearish channel on a 4-hour frame,
the price moves within it and adheres to its limits well
We have a major support area at Saad 1.0
We have a tendency to stabilize above moving average 100
We have a downtrend on the RSI indicator that has been broken to the upside
Entry price is 1.19
The first goal is 1.44
Second goal 1.79
Third goal 2.20

ALICE/USDT Idea ALICE/USDT:
The price of ALICE/USDT is currently attempting to break out above the trendline resistance on the 4-hour timeframe. In my analysis, I anticipate a successful breakout. In the event of a confirmed breakout, I expect a bullish movement of around 20-40% in the short-term. It is essential to exercise caution and wait for confirmation before entering any trades.
Please note that the above information is not financial advice. It is always recommended to conduct your research and analysis before making any financial decisions.

#ALICE/USDT See it Breaks the Trendline! 🍀ALICE/USDT trading pair recently underwent a noteworthy development by breaching a significant trend line following an extended period of consolidation. This breakout hints at a possible change in market sentiment, indicating an upswing in bullish momentum.
#ALICE/USDT LONG SCALP 🍀
Leverage: 3x
Entries: $1.212
Take profit 1: $1.306
Take profit 2: $1.511
Take profit 3: $1.844
Stop Loss: $0.897
BINANCE:ALICEUSDT.P

Alice to WonderLand or Dump?BINANCE:ALICEUSDT
✅Before we start to discuss, I would be glad if you share your opinion on this post's comment section and hit the like button if you enjoyed it.
Thank you.
Possible Targets and Explanation
➡️Fib since April 2022 drop. We probably can retest -0.18 Zones
➡️At this level now is fundamental value of Alice by "Take Profit" indicator last green line
➡️Every time when we touch this line or trade under than we can expect massive bounce
➡️Now we trade under 0 level and bounced from Buy line on "Take profit" indicator which is also good enter point
➡️Signal to Buy on "TradeON" indicator
➡️Take profit target for this trade will be at 2.82 and 3.18
➡️But this is dynamic metrics use stop loss even if you trade by limit orders.
Hope you enjoyed the content I created, You can support with your likes and comments this idea so more people can watch!
✅Disclaimer: Please be aware of the risks involved in trading. This idea was made for educational purposes only not for financial Investment Purposes.
* Look at my ideas about interesting altcoins in the related section down below ↓
* For more ideas please hit "Like" and "Follow"!

ALICE wants breakout hereHello Traders,
As you can see, ALICE wants to break out of this channel.
Keep an eye on it, always buy the dip/pullback, and set your SL accordingly.
Please hit the boost button and follow me for more ideas.
Thanks

Alice/usdt Short Term Aliceusdt
Breaking Out Trendline resistance on hourly time frame
Short Term - Expecting 20-30% Bullish Move
Note :Risk Management Must & Do Your Own Research Before Entering Any Trade

Alice/usdt Getting Ready For Breakout Aliceusdt
Alice/USDT appears to be gearing up for a breakout. If the breakout is successful, we could see a bullish move of 150-250% in the mid-term.

Alice Buy after retracementHello Traders!
Welcome back to another trade with Analyst Aadil1000x.
Today we are going to set another Buy limit in Alice at key reversal area.
Alice Buy Limit @ 1.543
Stoploss 1.516(-1.75%)
Target 1, 1.581(+2.4%)
Final Target 1.623(+5.18%)
Don't forget to hit the like button and follow to stay connected.

🟢 ALICEUSDT -1H (08/12/2022)🟢 ALICEUSDT
TF: 1H
Side: Long
SL: 10%
TP 1: $1.2961
TP 2: $1.3148
TP 3: $1.3299
ALICE looks like it is getting to move.
Bullish divergence and an FVG to fill.
