What to Watch For Next!💡 GBPUSD Bearish Trade Outlook – Detailed Analysis
The GBPUSD pair has recently shown a clear Market Structure Shift (MSS) to the downside — a strong sign that bearish momentum may be taking control. Alongside this shift, we’ve also seen the formation of a Bearish Fair Value Gap (FVG) on the 4-hour timeframe, which adds further confluence to the potential for continued downside.
📍 What This Means:
The break in structure combined with the FVG suggests that institutional activity may be driving price lower, possibly targeting areas of untapped liquidity beneath previous lows. These are often high-probability setups when traded with confirmation.
🔎 What to Watch For Next:
At this point, it's best to wait patiently for the price to retrace into the 4H FVG zone. Once price taps this area, we should closely monitor lower timeframes (such as 15M or 5M) for bearish confirmation entries — like a bearish engulfing pattern, change in character (ChoCH), or internal MSS.
📉 Potential Trade Idea:
If confirmation occurs, we can look to enter a sell position, targeting downside liquidity levels, such as previous swing lows or equal lows — where the market often hunts liquidity.
⚠️ Risk Reminder:
As always, avoid entering blindly. Let the market give you a clear sign. Use proper risk management, and stick to your strategy.
📚 DYOR – Do Your Own Research!
The market doesn’t guarantee outcomes. Your own analysis, patience, and discipline are your best tools.
Allmarkets

Gold has recently broken below its 4-hour bullish Fair Value GapGold Market Analysis (In-depth & Strategic Overview):
Gold has recently broken below its 4-hour bullish Fair Value Gap (FVG) and is currently trading beneath its Consequent Encroachment (CE) level — a signal that short-term bullish momentum has weakened.
In the latest 4H candle, the market swept the liquidity resting below the previous day's lows, a classic move to trap early sellers and collect stop-losses. Right after this liquidity grab, the price touched the daily bullish FVG, found support there, and then managed to close back inside the 4H FVG. This action reflects a temporary defense by buyers — but the battle is far from over.
📌 Key Levels to Watch:
$3401: This is a critical resistance level. If the market successfully closes above $3401, it could signal a bullish continuation, paving the way for an upward move.
$3389: This is a crucial support level. If price breaks below $3389, it would likely lead to further downside movement, opening the door for deeper corrections.
⏳ Current Strategy:
The best move right now is to wait and watch how the market reacts to these key levels. A breakout above $3401 would confirm strength and potential bullish continuation. Conversely, a breakdown below $3389 could trigger a fresh wave of selling pressure.
🚨 Until one of these levels is clearly broken, the market may remain in a state of indecision or range-bound movement.
🔍 Always DYOR – Do Your Own Research!
Stay informed, manage your risk wisely, and avoid emotional decisions.

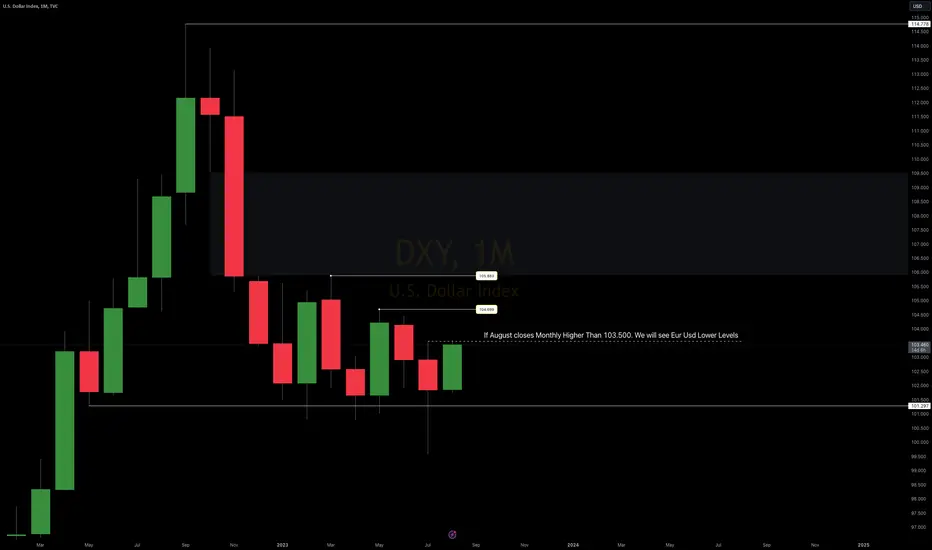
DXY idea Indeed, if the month of August concludes with a robust closure above the significant benchmark of 103.500, a calculated inference leads us to expect a subsequent decline towards lower echelons within the EUR/USD trajectory. Notably, it's pertinent to highlight that the monthly level on the Dollar remains unbreached, affirming the prevailing monthly bullish sentiment for the Dollar.
ATR PRE-ENTRY STRATEGYATR PRE-ENTRY STRATEGY
The Average True Range or ATR is a measure of volatility.
Volaltility = the amount the price of a market moves around.
The highly volitile GBPAUD moves in hughs jumps.
It can move a few hundred pips in a single day.
You can win or loss a bunch of money of the GBPAUD.
EURCHF is a very low volaltility market.
Possibly 50 pips in a single days movement.
You can find this out by looking at the ATR.
The ATR is simply an average of the length of the last number of candles
Most use an average of the last 14 candles which is roughly 3 weeks of the price data of most markets.
That will give us an idea if the market is in compression (declining) or expansion (inclining).
The ATR automatically adjusts for time frame market or market compression or expansion. So it is useful for everything.
Including for determining a valid stop loss or target.
Also how active a market happens to be.
How to use ATR as an pre-entry technique.
I look for a decline in volaltility during a corase of a pattern of consolidation to gauage the compression that is taking place in the market during that consolidation.
The market is like a spring. The more you compreise it the more power it generates when the compression is released.
The decline of the ATR during the consolidation means a bigger explosion in the breakout from the consolidation.
