This is going to explodeInverted HS and bullish flag just broken up. It's a massive bullish signal. TP at the resistance 63. Wait and see what the price does, it may not pull back too much and try to break out the 63 level again. This is going to go up up up.
Alltimehigh

Picking the TopThe Daily chart showed that price started below the 9EMA for this week and gapped up above the 9EMA on Thursday and closed the week well above it. Gap fill is at 497.37 and Support is at 503.50 which was a previous daily high. There is a Double Bearish Divergence on the RSI from a high of 74.77 to 72.56 and closed the week on a bearish candle that closed +0.07% with a 68.53 RSI.
Based on a Fibonacci Retracement (380.65 -> 459.44 bounced off the 0.382 Fib at 410.75) and Extension (2.0 at 538.23), if price holds 508.13 (1.618) it can run to 521.37 (1.786).

NIFTY DAILY - 22/2/2024Indian index opens with negative note and made days low that is 21875,
but into second half bull started buying from lower end and took over the market and made days high that is 22252 that is also a new all time high of index.
Index has form green body candle with long lower shadow and upper shadow which indicates that participants were buying from lower end.
We may see resistance at 22381 level and 21989 level will work as support.
⚠️ Important: Always maintain your Risk & Reward Ratio.
✅Like and follow to never miss a new idea!✅
Disclaimer: I am not SEBI Registered Advisor. My posts are purely for training and educational purposes.
Eat🍜 Sleep😴 TradingView📈 Repeat 🔁
Happy learning with trading. Cheers!🥂

NIFTY 22 FEB 2024 viewIf we look at derivative data
0.80% % DECREASE, with a 3.6% addition in open interest.
if we look at volume, there is a 23% rise compared to yesterdays volume
iv down by 4 points , pcr is at low point of week and IVP AT 89 percentile .
support now at 21930-21960 while after todays cool offnow 22250 -22280 likely to act as a resistance zone

Nvidia - It Is Finally TimeHello Traders, welcome to today's analysis of Nvidia.
--------
Explanation of my video analysis:
In 2019 Nvidia stock started creating a long term rising channel and retested the lower support trendline the last time in 2022 before we saw a massive +600% rally on this stock. Nvidia is now retesting the upper channel resistance which I mentioned in the analysis and there is a quite high chance that we will see at least a short term correction towards the downside from here.
--------
I will only take a trade if all the rules of my strategy are satisfied.
Let me know in the comment section below if you have any questions.
Keep your long term vision.

Bitcoin Future LevelsI was having a conversation with a trader on my social media and he was sharing future projections of Bitcoin INDEX:BTCUSD with a parabolic curve. This is easy to draw using past major lows going higher and also with the fundamental force of the Halvening presumed to begin in earnest now or soon.
My feedback to him is that perhaps the obvious thing to do now is draw a parabolic price trajectory... but the market rarely does the obvious. My trading thesis, though wrong at present, has been that the Halvening is so expected and planned upon to the utmost... it will defy consensus like market events tend to do.
As a technical trader... I see price move from level to level respecting them partially or fully. Having stopped at one level for the ETF launch, then then conquering it, it is now at the 52.1 level. The next being 55.4 (weak but notable), after that 64.9, and conquering that level price will be very much guarantee price will be pulled up to the ATH.
Seen is the prior ATH break, one week after, before the last parabolic rise. When there is a big, fully closed bullish bar, from the prior ATH, parabolic projections may commence. Doing so before that is premature and can lead traders to overleverage the "sure thing".
Sure, waiting for something like this runs the risk of FOMO, but it is far more probable thing to bet on.

Nifty - Reflection of India's Sanity - Ready for New HighsFeb 12 to 16 - Another wonderful and Powerful week for the Indian Market where our market deceived the Global markets and Stood Strong and Tall while Global Markets were Bleeding.
It was very evident that Nifty and its cousins (Smallcap, Midcap, Energy, Auto, Pharma....) are super strong and are heading for newer highs
Here is the Technical View for the Week of 19th Feb:
Gift Nifty: Started the week with a Gap Up & Green Candle. The Last of the last Resistance before making new highs is 22,205. once broken Gift Nifty will Trade above the Earth's Atmosphere :)
Nifty 50: Nifty following a similar structure is all set to break out of its last resistance at 22,125 to head towards uncharted Territory
Given the upcoming Elections, the Ruling Party can't afford to lose their image with a crash in the market. Over the past 3 Quarters, the Indian Retail community have grown so strong that FII selling is no longer a major issue. Despite continuous Daily Net Selling by FIIs since Aug 2023, Indian Market marched forward like a Battalion of Determined Soldiers to make newer Highs.
We are slowly becoming Immune to FIIs selling, but FII buying will actually be complimentary to our market to take us to new highs. This the sign of Indian Becoming Truly Atmanirbhar....
Disclaimer:
Stocks-n-Trends is NOT registered with SEBI. We do not provide Buy / Sell recommendations - rather we provide detailed analysis of how to review a chart, explain multi-timeframe views purely for Educational Purposes. We strongly suggest our followers to "Learn to Ride the Tide" and consult your Financial Advisors before taking any positions.
If you like our detailed analysis, please do rate us with your Likes, Boost and share your comments
-Team Stocks-n-Trends

Bitcoin is Finishing bullish wave In my opinion ATH is not available before halving and before massive correction , Maximum Price would be 58200 and Final destination for my expected correction wave could be 29k-32k, Im not sure how much could be fast or slow but most probably before halving we will not see ATH.Do not get caught up in fomo. now is not good time for long position and buy. The market will provide us with better opportunities

Gold - Prepare For The BreakoutHello Traders, welcome to today's analysis of Gold.
--------
Explanation of my video analysis:
In 2007 Gold started creating a major bullish trendline and just recently retested in in September of 2022. Furthermore Gold has been trying to break above the $2060 resistance area for quite some time now. Eventually I do expect a breakout but we could see another rejection down to the trendline mentioned in the analysis where I will be looking for more long setups.
--------
I will only take a trade if all the rules of my strategy are satisfied.
Let me know in the comment section below if you have any questions.
Keep your long term vision.

BINANCE:LINKUSDT +180% profit potential on the long termLINK is on the target to reach it's previous All time high of 53$ and its about time before it breakout from the ATH and reach new ATH my target $250
I'm expecting some correction before we can see some correction before its can hit ATH.
You can enter for position at $18 with 2x leverage.
Regards,
VectorAlgo

REDINGTON - STRONG ALL TIME HIGH BREAKOUTEntry level triggered - 200
If falls again then you need to average at 160 level
Targets - 260,300+
Disclaimer - All information on this page is for educational purposes only,
we are not SEBI Registered, Please consult a SEBI registered financial advisor for your financial matters before investing And taking any decision. We are not responsible for any profit/loss you made.
Request your support and engagement by liking and commenting & follow to provide encouragement
HAPPY TRADING 👍

Bearish Sell Stop OrderMy trading plan does not allow me to buy into new highs.
However it's not safe or practical to aimlessly short the high.
A sell stop order is how I safely trade the highs.
I am Bearish to Neutral for now. Waiting for significant signs of bullish support.
Seasonally, the market is Bearish/ corrects on average going into February.

JP Morgan Short off All Time HighWith the stock market making new All Time Highs fresh new opportunities for contrarian trades are going to be somewhat scarce. Thanks to a viewer on my Livestream (every Friday on Tradingview: 4pm EST UTC-5) I was made aware of a short setup I like on NYSE:JPM
Context
This price action is happening at a test of the past ATH set in November 2021. Last week the Earnings announcement pushed price intraday above the high only to close well below the key Resistance level of the former ATH. This is a false breakout signal or as I like to identify them as: Spikes.
The Spike
The Spike occurred on Earnings. I have found that false breakouts on earnings have a very high probability of signaling a reversal. The significance value (135% ATR) is within my rules. It took until the following week for price to actually pull back to the proper entry point of the Spike bar's Tenkan Sen value at 172.48. What these factors mean I go over during my Livestream.
The Trade
How I am expressing this trade is in a combination of short shares and Puts.
In choosing my Put strike I look for where I see price going as a target via technical analysis. In this case it would be the 50% Retracement of the bullish trend around 155.
For expiration I consider the prior bullish trend that got price up to the high I am reading as a false breakout to enter. I project the time that trend took, add an additional month as a time buffer, and then typically take that expiration. Unfortunately, an option expiring in March as this technique would suggest puts the expiration too close and just before earnings.
A note about options and earnings: In the 4 weeks prior to earnings very typically a stock's options will experience a rise in IV (implied volatility). This rise in IV and the Greek Vega can increase the prices of all options often offsetting the value lost to theta time decay. This is a very advantageous condition if a trader is long single options. Therefor, I chose the April expirations to give myself the potential for the IV push. I will likely close the options the day before earnings regardless of where price may be. Options are a coin flip.

Bitcoin - Buy Buy BuyHello Traders, welcome to today's analysis of Bitcoin.
--------
Explanation of my video analysis:
In 2018 Bitcoin created an obvious resistance level at the $17.000 level. This was the all time high of the previous bullish cycle. In 2021 Bitcoin then broke above this structure and came back to retest it in 2022. So far Bitcoin is looking very bullish and it also just broke above another key structure mentioned in the analysis. If we get a retest I will be looking for longs.
--------
I will only take a trade if all the rules of my strategy are satisfied.
Let me know in the comment section below if you have any questions.
Keep your long term vision.

AMD - All Time HighHello Traders, welcome to today's analysis of AMD.
--------
Explanation of my video analysis:
In 2016 AMD broke out of a long term triangle reversal pattern. This breakout was then followed by a pump of +5.000%. After the 2022 pullback of 70%, perfectly retesting previous structure, we are not certainly back to a bullish market on AMD. If we see a retracement back to the structure mentioned in the analysis, I am certainly looking for more long setups on AMD.
--------
I will only take a trade if all the rules of my strategy are satisfied.
Let me know in the comment section below if you have any questions.
Keep your long term vision.

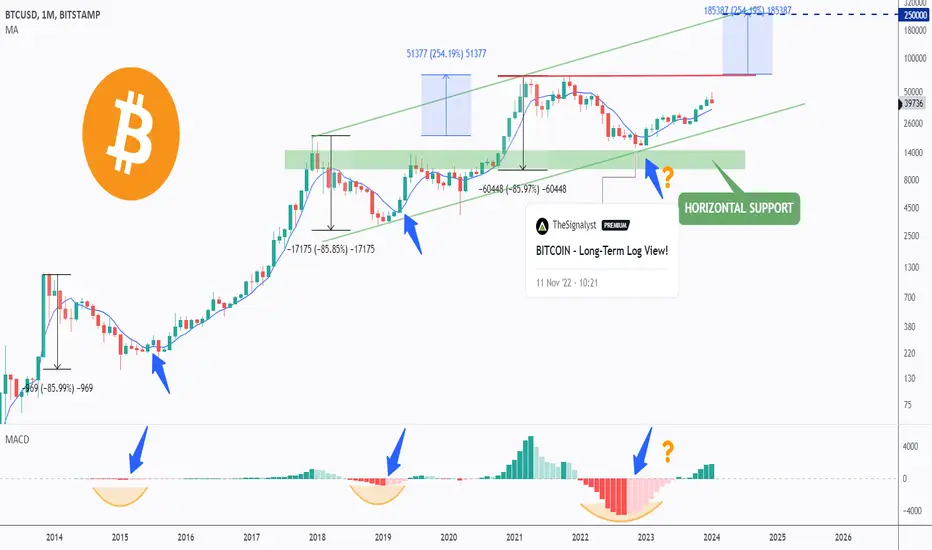
Bitcoin - Long-Term Log View - Targeting 200k 🎯Hello TradingView Family / Fellow Traders,
🖇Following my last BTC Monthly log view analysis on November 11, 2022, we anticipated the bulls taking control after rejecting the lower green trendline and horizontal support.
What's Next?
📈 If the current all-time high (highlighted in red) is surpassed, we anticipate a 254% increase, mirroring the last bull cycle. This aligns with the upper boundary of the green channel and the 250k round number.
⚠️ However, the journey may encounter bumps, leading to sharp correction movements to shake out weak hands.
📚 Always follow your trading plan regarding entry, risk management, and trade management.
Good luck!
All Strategies Are Good; If Managed Properly!
~Richard Nasr
A Possible Elliott Wave 5 To New All Time Highs This is just a quick and dirty take on the MNQ1! which could be the possible beginning of a wave 5 to new all time highs.
Currently breaking out of bearish channel, which could be seen as a wave 4.
Fibs and fib projections for wave 1-4 all seem to fit.

Stocks at New All-Time Highs Ahead of Earnings: CATThis Dow component attempted a new all-time high and failed. However, it has ample support from the prior sideways trend after the previous all-time high. NYSE:CAT has been over-speculated as it moved out of its bottom low.
The company reports end of January. Watching to see how the stock performs in the next week or so should indicate whether it will be stuck range bound for another couple of quarters or if it will have the fundamentals to support a new high. For now, it has more of the appearance of a range bound sideways pattern developing.
Caterpillar Inc. did well during the years of huge real estate and city development in China. Unfortunately, the great industrial revolution of China is long gone, their population in decline due to fewer births and more deaths reducing their billions. Their consumer-based economy has slammed into Market Saturation as their population continues to age at a faster pace than any nation on earth. CAT needs to find another source for its machinery.

Nvidia - Higher, Higher And HigherHello Traders, welcome to today's analysis of Nvidia.
--------
Explanation of my video analysis:
All the way back in 2014 Nvidia broke out of the long term symmetrical triangle formation and entered a crazy bullrun. With the current channel formation on Nvidia, there is a high chance this stock will push higher even more to retest the upper resistance mentioned in my analysis.
From there I do expect a correction which could be similar to the one of 2022.
--------
I will only take a trade if all the rules of my strategy are satisfied.
Let me know in the comment section below if you have any questions.
Keep your long term vision.

SWING IDEA - SAINTGOBAINALL TIME HIGH !!
The stock price breached 'all the high' mark. The momentum seems to be strong. We can see a potential up move in SAINT GOBAIN .
Reasons are stated below :
Daily candle closed above all the high.
Price broke out after a consolidation phase of 4months.
Formed a marabozu candle on weekly timeframe.
Price is above 50 and 200EMA.
Higher-Highs are being made i.e stock is in uptrend.
Target - 152 // 180 (these are derived from Fibonacci extension tool)
StopLoss - weekly close below 119

Gujarat Titans Showing their IPL MightNifty up 1.2% and has reached a New ATH today and just about to reach the 22000 Milestone....
The new High was touched by trh Courtesy of 2 Gujarat Titans - the Adani Group and Ambani Group
Both of their Flagship companies RIL and Adani Enterprises has touched 1% up today and Mota Bhai already had a BO yesterday followed by Adani which is on verge of BO today
These 2 have given their shoulders to Lift Indian market sky high despite the uncertainties and volatilities around the Global front
- Team Stocks-n-Trends

S&P500 - 5000 Points In 2024Hello Traders, welcome to today's analysis of S&P500.
--------
Explanation of my chart analysis:
The S&P500 has been rallying for the entire year of 2023. Many people do expect a correction but the charts are still looking pretty bullish. If we see a breakout above the previous all time high at $4.700, I do expect a rally back to the upper resistance of the rising channel above $5.000.
--------
I will only take a trade if all the rules of my strategy are satisfied.
Let me know in the comment section below if you have any questions.
Keep your long term vision.

US500 - Potential Bearish Momentum ❗️Hello TradingView Family / Fellow Traders,
In accordance with my latest analysis, which is attached to the chart, we have been anticipating a rejection of the all-time high.
📉 For the bears to assume control and confirm the beginning of the correction phase, a break below the last major low highlighted in red is required.
Meanwhile, until the bears take control, US500 would remain bullish and could still move within the green all-time high zone.
📚 Always follow your trading plan regarding entry, risk management, and trade management.
Good luck!
All Strategies Are Good; If Managed Properly!
~Richard Nasr
