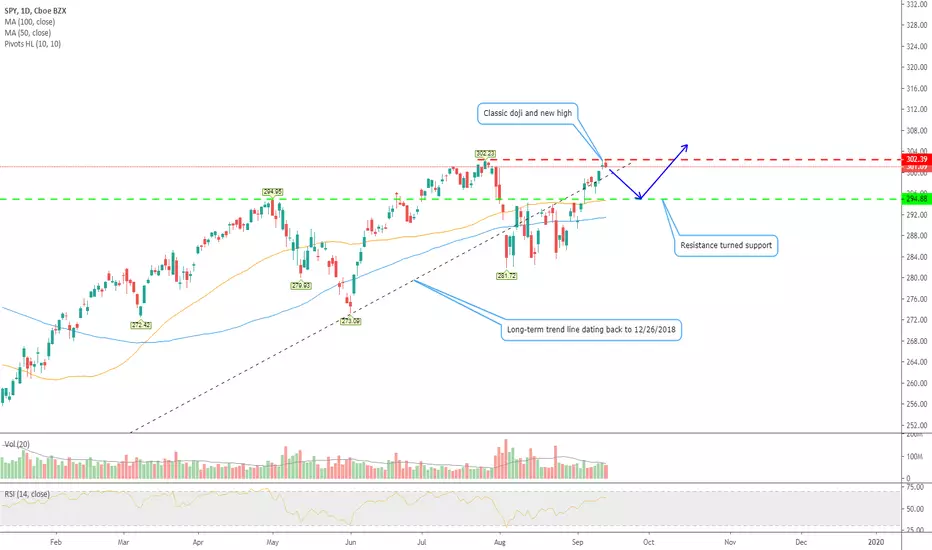
SPY - Daily - Bearish engulfing stick after dojiNotice the bearish engulfing candlestick today, after the doji yesterday? I believe that means we are going back down to retest the green line I drew in the 295 area. We just made new highs, but could not close above the highest close level set in July. I do not believe this sell-off will be anything more than simple profit taking after this nice rip up after breaking through consolidation. More or less, I think this will be just a breather ... UNLESS, negative trade war news comes out.
As always, the trade war is determining the technicals right now. If negative news comes out between now and the new round of talks in October, I think we will bust through that green line and make a move to test a double top pattern. If that happens, look out below!
I'm overall bullish based on technicals, but bearish to start next week. I positioned my account appropriately yesterday and today to survive the profit taking.
Alltimehigh
Palladium Longretesting for 3rd time on the top of the wedge, negative momentum has been reduced on the weekly.
taking profits at 1700's on 1.272 fibo extension from 1616 high to 1270 low .

The Golden FIB Bottom - 10 Reasons Why Bitcoin is Bottomed Out !Hello,
These are my 10 Reasons why I think BTC is Bottomed out !
I am a huge bear when it comes to Bitcoin and I believe I am not alone anymore, the possibility of Bitcoin going lower has actually kind of became mainstream.
The problem is that people always look at what happened in the past to predict the future, as this crypto space got bigger alot of investors and traders als got more mature.
Almost every investor knows the saying sell the news, and with the CME crash in 2017 people are scared of what BAKKT will bring us.
Everyone in the world is predicting a pullback to atleast the 8K region so why would it go there ?
Don't forget that I was a big bear before this (look at my recent post where i called top 12K).
Here are my 10 reasons why I think Bitcoin is bottomed out
1. Monthly RSI Trendline Bounce
2. Daily RSI Trendline Bounce
3. Monthly Golden FIB Bounce
4. Fake Out ! (Pumps right back and gets supported on REAL trendline)
5. Perfect 100 Daily MA Bounce (Retest)
6. Perfect Close Above Daily EMA RIBBON
7. Perfect 0.236 FIB Bounce
8. 3 Monthly Red Candles (3 Red Monthly will confirm Bear Market!)
9. Bakkt Launches 23 September (Buy the news this time ;)? )
10. Apply Own Reason Here :)

Facebook Shares are strong as tankEven for short term corrections may happen, values are getting higher and higher each day. We can see the double dip to the purple baseline of triangle and than a steep upwards move came.
When the purple triangle will be completed, I'm expecting a steep rally upwards. First target will be 219 which as ATH (all time high) and than it will set a new ATH.
Reverse head&shoulders formation (can be seen in green) also confirming the coming upmove. First target of head&shoulders formation will be 219 which is ATH and confirming our first guess. Next target is 234 which will be the new ATH if it can reach up to that point.


Bitcoin to Smash ATH Sooner than you thinkHere's my chart on Bitcoin smashing through a new ATH starting at the end of August.
Let me know what you guys think. Save this chart...

S&P 500 seems that it'll test to break ATH resistanceS&P 500 index funds has a characteristic, once the value breaks support of uptrend line it makes a steep downturn for a short period. Right after down movement, a new uptrend rally starts.
Let’s see a few examples, look at the green uptrend lines
In the short term we have two scenarios;
1. Green Arrow;
If the value bounces from the 2914 support or from green uptrend line arouond 2900’s, new target will be the resistance of 3030 which is all time high (ATH) btw. If it also breaks the ATH 3030 resistance, we have to look at other formations to form a new target.
My Opinion: It would be very hard to break the ATH with such short uptrend line. Trend would not be so powerful but this also can be a silly idea as well.
2. Red Arrow; (higher chance in my opinion)
If it breaks the support of 2914 and green uptrend line, we may see a longer downtrend period. Than our first target would be 2862 and than 2733. After the bounce back we can start a new uptrend to break the all time high 3030 resistance. And this time the uptrend line will be more powerful and will have more chance to break the resistance.
As a result, even it has some down movements general momentum of S&P 500 index is very powerful.

BITCOIN All Time High by the end of 2019Here is my vision on potential pricem movement of Bitcoin till the end of this year.
Price stays above the support and rejecting the uptrend trendline, which is a bullish sign.
If/when btc will hit a new all time high, this could be a pretty strong signal for alts to start outperforming btc, at least in the short term.
It could be the last time when many shitcoins will outperform btc, before they vanish completely.


DLTR Slams into Resistance HighDLTR rose slightly above its prior All-Time High with a Shrinking Run Gain Pattern. The Long Black Reversal Candlestick Pattern is a common pattern for this type of weak run action.

AMD Hits All-Time High ResistanceAMD hit its previous All-Time High resistance and retraced quickly. AMD is now retesting that resistance. Volume remains below average, which weakens the run overall.

Medtronic broke all time highsWith the market down today, MDT doesn't care... It's breaking tested, heavy resistance at all time highs.
Technicals look great as well.
*Check chart for more info*

Ascending triangle forming on btc, Still bullish.Price has consistently failed to break the 11.1k level on the daily.
Ascending Trinagles are a bullish chart pattern - We saw one forming back when btc was in 4k area, Now its forming at the the current price range of 11k-13k.
IF it breaks above we could be looking at bitcoin TESTING ALL TIME HIGHS!
But nothing is certain in trading - So DYOR as well!
Main level to be aware of 11.1k We close below this level on the daily for any reason - This trade idea would be invalidated.
Wish you all good trading and profits!

"FB" going to test ATHA pull back will initiate the ATH test run.
CP: 204.94
Expected pull back level : 197~
ATH: 218

S&P New All Time Highs - Risky BuyS&P New All Time Highs - Risky Buy
The Emini and S&P 500 made a new all time high again today, leading many to believe this market is still strong. In some ways it is, but it is more important to realize it is also in a bull flag trading range. This makes it a risky place to buy up here. This is where strong bulls who bought lower will start looking to take profits, and strong bears will start looking to sell for a move down.
Why is it risky to buy now? There is only a 40% chance of a measured move up based on the height of the trading range. And the risk needed to enter now is large (below the bottom of the trading range). There is at least a 50% chance of a test down soon, back into the range. The middle of the trading range is a magnet and will likely get tested before the bull trend continues. Furthermore, if the bears are soon able to create a strong reversal bar for the large wedge, it could increase the probability to 60% for two legs down. If there is a quick and large move up in the next few weeks, it would likely act as a climax and final flag reversal, increasing the likelihood of a sell off.
Dont think just because there is no reversal yet that the market cant or wont sell off. Look at the past two sell offs from this area. They began from bull bars (Jan 18 two bar reversal), or small inconspicuous bars (Sep 18 doji to outside bear bar). But the follow through was strong and fast. Of course, this does not mean a shorter term trader cant buy and make money. Day traders can do many things investors do not or should not. But as far as a long term investment, this is simply not a safe one to buy at the current price level unless you are willing to sit through a deep pullback and scale in. And if you are - why not just wait and buy then?
If you found this helpful please like! Feel free to comment or ask questions

Bitcoin BTC 20K All-time-high October 2020 (Rough Estimate)First I want to mention this is my first TV chart idea and I'm no professional trader by any means. Take this idea with a grain of salt.
Based on my relatively simple chart, I think there's a good probability of Bitcoin hitting the 20k target during October of this year.
If this target is reached I suspect one of two scenarios. I'm leaning more towards further upside breaking through 20k after a small shakeout. Bitcoin has steadily increased in price since inception and unless there's a black swan event to damage confidence (very possible) I think new interest combined with more preparation to handle high numbers will benefit Bitcoins price in the following months.
Alternatively perhaps MSM news will pump the "20k ATH Bubble news" and new investors will get dumped on with a sharp retrace. In this scenario I can see revisiting 12k as a worst case scenario, by then I suspect Bitcoin will want to resume bullish momentum.

HD Near All-Time High ResistanceHD recently ran up on Buyback action, and it has stalled below the previous All-Time High. There is Dark Pool Quiet Rotation™ in the price action at this level.


Roku 3rd BULL flag - LONG BullROKU raised its third flag.
Technicals:
RSI(10) @70
OBV at all time high
CCI(10) @50 - high resistance line
Price range at all time highs
Bollinger width show a relative squeeze.
Fundamental and technical analysis show ROKU as a good short-term as well as long term investment.

SBUX Hits New All-Time HighSBUX has defied the recent weak market activity, and has run up to a new all-time high. The Percentage of Shares Held by Institutions remains well above average for a big blue-chip stock.

V Hits New All-Time HighVisa had a velocity run that took the stock to a new all-time high recently. The run concluded with Professional Traders taking profits quickly.

Short Bonds on Retest w/ Concurrent SPY rallyTL;DR short bonds for the week until FOMC decision 6/19/19 with no more upside pressure, consolidating at current level with volume. SPY is 70 points off of high and is aiming to test that resistance a 3rd time in this year.
Fundamentally: SPY is about to reach all time highs, with some more support as a fed rate cut is predicted (bringing hope in the short term). While a China Trade deal is still uncertain, Trump seems determined to make one at G20 end of this month. It seems the market has taken a hopeful turn leading up to the meeting and do not have hard economic data to trade off of this week of 6/10/19. 6/19/19 is an FOMC decision, however, where interest rate may be cut sending bond prices higher. Bonds and Equities could both rise on this news.
Technicals: 10yr reached the same highs experienced nearly a year ago with volume as stocks were sliding. Now they have reached the zone without going down to test any of the broken resistance levels as supports and bulls are failing to drive it further. The point-of-control shows significant "gravity" (market profile) down at the ~124'28 level which it could go as low as to test.
R:R: Local High 127'16 (Stop Loss), Profit Target 124'28, resulting in ~4:1 reward.

INGN Selling Short Earns Higher Profits FasterThe Inogen Inc. chart shows that it takes much longer to reach a Peak new All-Time High. However, a Topping Formation or Business Bear Downtrend occurs much faster. There is triple or quadruple the points profit in half the time when selling short a stock as compared to buying it going long in the market. This stock is now at a support level and is no longer a viable sell short candidate.
