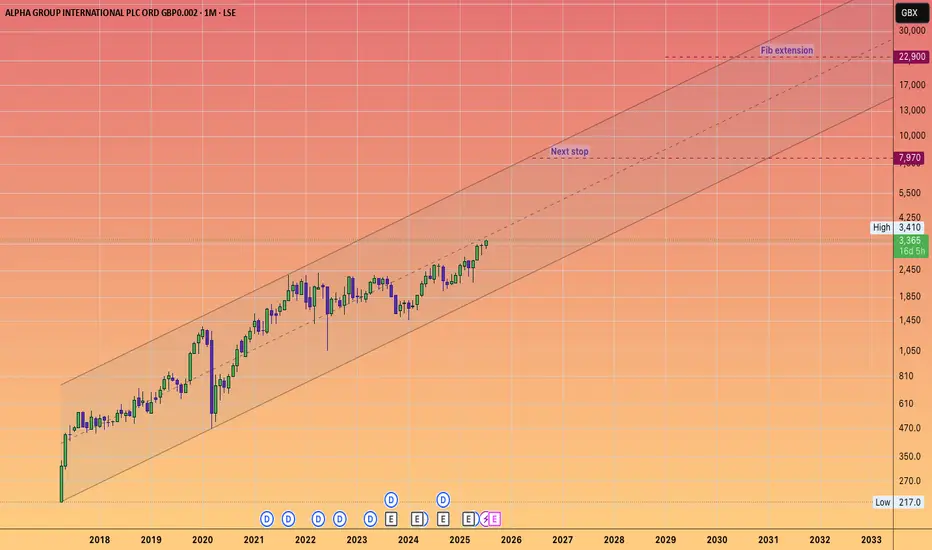
ALPHA GROUP INTERNATIONAL will keep its momentum going!#ALPHA is a fintech company that offers currency risk management and payment solutions.
With a price-to-earnings ratio of approximately 12,
it signifies a solid investment for a growth-oriented fintech firm that is increasing its earnings by about 20 to 25% annually.
In light of the #UKX breaking through and reaching new highs, and beginning to accelerate towards my long-standing projections that the FTSE would hit 5 figures, ALPHA appears to be a unique opportunity in the UK markets, which, as we know, are relatively sparse compared to the USA.
Given the inability to purchase shares of #Revolut, it is likely that capital will flow into this ticker.
Alpha
#ALPHA /USDT breakdown alert#ALPHA
The price is moving within a descending channel on the 1-hour frame and is expected to break and continue upward.
We have a trend to stabilize above the 100 moving average once again.
We have a downtrend on the RSI indicator that supports the upward break.
We have a support area at the lower limit of the channel at 0.01111, acting as strong support from which the price can rebound.
Entry price: 0.01156.
First target: 0.01288.
Second target: 0.01400.
Third target: 0.01512.
To manage risk, don't forget stop loss and capital management.
When you reach the first target, save some profits and then change the stop order to an entry order.
For inquiries, please comment.
Thank you.

ALPHAUSDT 1D Analyss ALPHA ~ 1D Analysis
#ALPHA Buy after successfully breaking through this resistance line with a short-term target of at least 15%++.

ALPHAUSDT | Sellers in Control—Key Resistance Levels DefinedALPHAUSDT shows a brief uptick, but the underlying strength remains with sellers. Buyers have yet to demonstrate sustained conviction, and this suggests any rally may be engineered rather than genuine.
🔴 Manipulation Target: Red Line
A slight advance today appears aimed at the area marked by the red line, where liquidity may be swept before a reversal. This level serves as a likely pivot for engineered moves designed to trap uninformed participants.
🔴 Core Resistance: Red Box
Beyond the red line, the red box identifies the primary seller domain. Price has stalled here repeatedly, confirming that sellers guard this zone aggressively. Until ALPHAUSDT clears the red box on substantial volume and with clear low‑time‑frame breakouts, the bearish bias remains intact.
📉 How to Trade This Setup
Short Entries
• Look for price to approach the red line and fail to hold—this often precedes a stronger reversal into the red box.
• Confirm with a clean breakdown on lower time frames and a negative divergence in CDV to validate seller dominance.
Risk Management
• Place stops just above the red box or red line, depending on your preferred trigger, to cap potential losses.
Stay Patient
• If price unexpectedly breaks above these levels with convincing volume and retests as support, only then will I reconsider the bearish view.
By focusing on where genuine selling pressure resides, and waiting for real confirmations, you avoid getting caught in manipulative spikes and trade with confidence.
📌I keep my charts clean and simple because I believe clarity leads to better decisions.
📌My approach is built on years of experience and a solid track record. I don’t claim to know it all but I’m confident in my ability to spot high-probability setups.
📌If you would like to learn how to use the heatmap, cumulative volume delta and volume footprint techniques that I use below to determine very accurate demand regions, you can send me a private message. I help anyone who wants it completely free of charge.
🔑I have a long list of my proven technique below:
🎯 ZENUSDT.P: Patience & Profitability | %230 Reaction from the Sniper Entry
🐶 DOGEUSDT.P: Next Move
🎨 RENDERUSDT.P: Opportunity of the Month
💎 ETHUSDT.P: Where to Retrace
🟢 BNBUSDT.P: Potential Surge
📊 BTC Dominance: Reaction Zone
🌊 WAVESUSDT.P: Demand Zone Potential
🟣 UNIUSDT.P: Long-Term Trade
🔵 XRPUSDT.P: Entry Zones
🔗 LINKUSDT.P: Follow The River
📈 BTCUSDT.P: Two Key Demand Zones
🟩 POLUSDT: Bullish Momentum
🌟 PENDLEUSDT.P: Where Opportunity Meets Precision
🔥 BTCUSDT.P: Liquidation of Highly Leveraged Longs
🌊 SOLUSDT.P: SOL's Dip - Your Opportunity
🐸 1000PEPEUSDT.P: Prime Bounce Zone Unlocked
🚀 ETHUSDT.P: Set to Explode - Don't Miss This Game Changer
🤖 IQUSDT: Smart Plan
⚡️ PONDUSDT: A Trade Not Taken Is Better Than a Losing One
💼 STMXUSDT: 2 Buying Areas
🐢 TURBOUSDT: Buy Zones and Buyer Presence
🌍 ICPUSDT.P: Massive Upside Potential | Check the Trade Update For Seeing Results
🟠 IDEXUSDT: Spot Buy Area | %26 Profit if You Trade with MSB
📌 USUALUSDT: Buyers Are Active + %70 Profit in Total
🌟 FORTHUSDT: Sniper Entry +%26 Reaction
🐳 QKCUSDT: Sniper Entry +%57 Reaction
📊 BTC.D: Retest of Key Area Highly Likely
📊 XNOUSDT %80 Reaction with a Simple Blue Box!
📊 BELUSDT Amazing %120 Reaction!
📊 Simple Red Box, Extraordinary Results
I stopped adding to the list because it's kinda tiring to add 5-10 charts in every move but you can check my profile and see that it goes on..

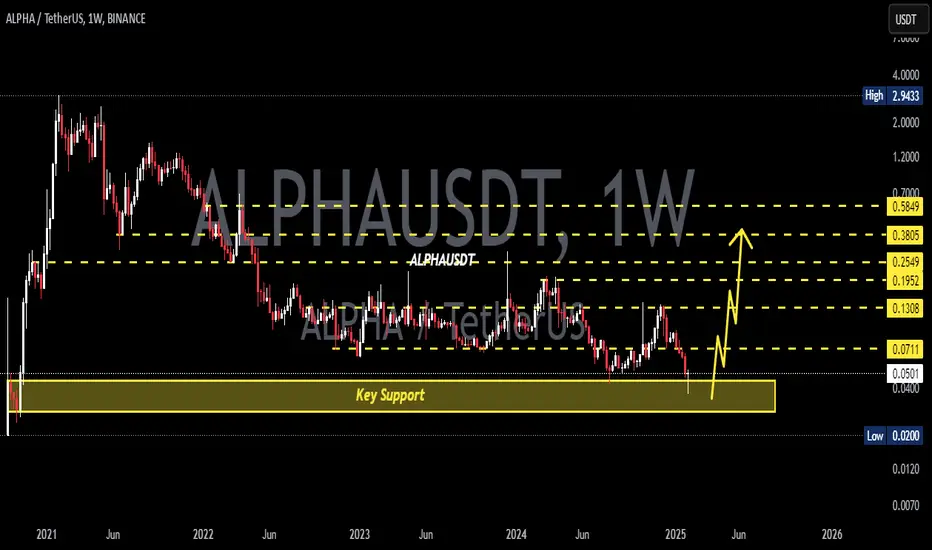
Stella (Alpha) Starts to Recover From True-BottomLet's start with the linear chart.
ALPHAUSDT is trading at bottom prices and here we can appreciate two sessions recently with really high volume. When the bottom is getting close, we tend to see whale accumulation happening.
The second high volume session came in 28-April.
The session that produced the correction bottom was the week of 5-May. Now ALPHAUSDT is turning green.
The orthodox end of the bear market happened June 2022 and the ensuing action is the same consolidation pattern we've been seeing through many charts. The difference is that here we have lower lows. Some produce higher lows others lower lows, still, it is the same market phase. A transition period from neutral to bullish. Look at the linear chart again and you can see the action being 100% flat.
Now, once we hit bottom, there is no other place left to go but up.
» ALPHAUSDT already hit bottom just two weeks ago; it is getting ready to grow. Long-term growth. This is an easy buy and hold.
Namaste.

Alpha Bank Shows Impressive Performance Alpha Bank Shows Impressive Performance in the First Nine Months of 2024, with Positive Indicators Boosting Investor Confidence and Paving the Way for Upgraded Forecasts for the Rest of the Year.
Alpha Bank reported adjusted net profits of €666 million, showing a 16% annual increase, while net profits reached €489 million. The impressive increase in earnings per share to €0.27 highlights the bank's profitability, with a return on equity of 14.4%.
Net interest income showed a 2% annual increase, while fee income saw an impressive rise of 11%, reaching €306 million. This growth in fee income reflects the bank’s success in diversifying its revenue streams and expanding into payment and wealth management services.
The non-performing exposure (NPE) ratio stands at a low 4.6%, underscoring the resilience of the bank’s portfolio and prudent risk management. Meanwhile, the cost of risk has been significantly reduced to 63 basis points, contributing to the improvement in the bank’s asset quality.
The increase in loans by 8% and deposits by 10% reflects strong customer confidence and the continuous strengthening of the bank’s portfolio. Alpha Bank seems to be adapting exceptionally well to the increased market needs, especially in the business loan segment.
The bank’s balance sheet is well-structured to withstand interest rate reductions, with strong capital adequacy and a proper asset allocation. This provides stability and protection against potential market fluctuations, with minimal impact on net interest income.
The increased demand for business loans is reflected in a 67% rise in corporate loans since 2018, with Alpha Bank outperforming the sector average in loan growth. The positive trend in loan demand is expected to continue, offering further growth opportunities.
Alpha Bank holds a leading position in wealth management, with the largest mutual funds under management in Greece. The expected increase in fee income by 2026, particularly in the payments and wealth management sectors, supports the bank's strategy for revenue diversification.
The bank is on track for further growth in earnings per share, with an expected return reaching €0.35 by 2026, thanks to continuous improvements in operational efficiency and strong financial performance.
Alpha Bank’s capital adequacy is higher than the average of Greek banks, with a CET1 ratio of 15.5%, while over 30% of its market cap is expected to be distributed as dividends by 2026. This strong capital base enables management to reward shareholders while maintaining sufficient capital reserves.
Detailed Financial Data of Alpha Bank for the First Nine Months of 2024
Net Interest Income
Net interest income amounted to €1.243 billion for the first nine months of 2024, showing an annual increase of 2%. Despite stable interest income in recent quarters (€410 million in Q3 2024), the bank manages to maintain a steady income in its core area.
Fee Income
Fee income reached €306 million, up 11% compared to the same period in 2023. This increase confirms the effectiveness of the bank’s strategies to diversify its revenue sources, primarily through payment services and wealth management.
Trading and Other Income
Trading and other income saw an impressive 81% increase, reaching €95 million. This reflects the bank’s success in seizing opportunities in the markets and other investment activities.
Operating Income and Expenses
Operating income for the first nine months of 2024 amounted to €1.643 billion, up 6% compared to the previous year.
Total operating expenses remained steady at €627 million, with no change, indicating successful cost management despite increased activity. The combination of revenue growth and expense stability demonstrates the bank’s improved efficiency.
Pre-Provision Income
Pre-provision income increased by 11%, reaching €1.016 billion. This increase is particularly significant as it strengthens the bank’s resilience to potential risks and lays the groundwork for healthy growth.
Impairment Losses
Impairment losses decreased by 20%, amounting to €173 million. This reduction is very positive, reflecting the improvement in the bank’s portfolio quality and reduced need for provisions against bad loans.
Profit Before Tax
Profit before tax amounted to €838 million, marking a significant increase of 18% compared to the same period last year. This increase reflects the positive impact of cost management and increased revenues.
Net Profit After Tax
Net profit after tax amounted to €489 million, showing a slight decrease of 2% compared to 2023. Although this decrease might seem negative, it is offset by the increase in adjusted net profits.
Adjusted Net Profit After Tax
Adjusted net profit after tax increased by 16%, reaching €666 million. This increase reflects the bank's strong financial performance and positive results without the impact of extraordinary expenses or other adjustments.
Alpha Bank Shares Show Several Positive Indicators According to Analysts:
Undervalued Market Price: Alpha Bank shares are trading at levels significantly below their estimated fair value, with a 55.5% discount. This means it offers substantial value for investors seeking to benefit from its potential future appreciation.
Earnings Growth Forecast: Alpha Bank’s earnings are forecasted to grow at an annual rate of 18.2%, significantly exceeding both the market average and savings rates. Additionally, historical data show a 25.5% annual growth in earnings over the past five years.
Analysts’ Consensus for an Upward Trend: Analysts are optimistic and agree that Alpha Bank’s stock price will rise by around 49.2% over the next year. This reflects market confidence in the company’s potential.
Valuation Based on Price-to-Book Ratio (PB): The price-to-book ratio for Alpha Bank shares is at 0.5x, indicating that the market values the stock at a very low level compared to its net book value. This suggests the stock could be a good buying opportunity relative to its sector.
Strong Financial Health: Alpha Bank shows adequate deposit levels and healthy loan levels, with an appropriate loan-to-deposit ratio of 70%. Although non-performing loans are at 3.8%, this percentage is not high enough to pose a risk, and the company has sufficient provisions for bad loans.
Expected Revenue Growth: Although the forecasted annual revenue growth is 7.9%, this rate is positive for the company’s growth prospects, surpassing the market forecast (5.1%).
Technical Analysis
The technical analysis of Alpha Bank’s stock shows a strong upward trend, supported by various indicators and support and resistance levels.
Moving Averages (EMA)
The Exponential Moving Averages (EMAs) for 20, 50, 100, and 200 periods indicate an upward trend, with the stock trading above all these levels, signaling strong bullish momentum.
Relative Strength Index (RSI)
The RSI is at 80.72, indicating that the stock is in the overbought zone. While this suggests high demand and bullish momentum, it also poses a risk for a possible correction.
MACD (Moving Average Convergence Divergence)
The MACD line (0.0359) is above the signal line (0.0278), indicating an upward trend. The positive value of the Histogram (0.0081) further reinforces the bullish trend.
Trading Volume
Volume is on an upward trend, with a total volume of 1.777 million. The increase in volume supports the upward movement, as it indicates growing investor interest in buying the stock.
Fibonacci Levels
The Fibonacci levels confirm support and resistance points:
0.618 level at 1.4680 serves as support.
Level 1 at 1.4960 also acts as a significant support level.
Support and Resistance Levels
R1 (Resistance 1): 1.5495, which has been exceeded, with the current stock price slightly above this level.
R2 (Resistance 2): 1.5795, which could act as a point of slowing the upward trend.
S1 (Support 1): 1.4275, providing fundamental support in case of a correction.

ALPHA Structure Analysis - 50-day EMA breakoutYesterday, BINANCE:ALPHAUSDT cleanly broke and closed above the 50-day EMA, which it hadn't been able to reclaim since December 2024. It also retested the previous $0.042-$0.052 demand zone, which acted as resistance.
Check the weekly chart below for more context:
Key Levels
• $0.024-$0.034: Main demand zone, dating back to October 2020
• $0.042-$0.052: Previous demand zone and current resistance
• ~$0.070: Previous key S/R, currently reinforced by 1-year EMA, and potential resistance
• $0.115-$0.137: Main supply zone
Trigger
I am looking for a retest of the 50-day EMA (~0.035) as support for a long entry, with a clear invalidation below the recent $0.025 swing low, targeting the main supply zone with the other key levels outlined above as partial TP targets.

ALPHA is Ready To Fly (8H)ALPHA has encountered a key zone filled with strong buy orders.
The volume of these orders appears sufficient to potentially pump ALPHA to higher levels.
On the chart, we also have bullish confirmations, such as the formation of a CH (Change of Character) and the breakout of the trigger line.
As long as the green zone holds, ALPHA can move toward the target profit (TP) levels marked on the chart.
However, a daily candle closing below the invalidation level would invalidate this analysis.
Do not enter the position without capital management and stop setting
Comment if you have any questions
thank you

#ALPHA/USDT#ALPHA
The price is moving within a descending channel on the 1-hour frame, adhering well to it, and is heading for a strong breakout and retest.
We are seeing a bounce from the lower boundary of the descending channel, which is support at 0.0293.
We have a downtrend on the RSI indicator that is about to be broken and retested, supporting the upward trend.
We are looking for stability above the 100 moving average.
Entry price: 0.0300
First target: 0.0306
Second target: 0.0314
Third target: 0.0323

ALPHA Is Ready To Fly (8H)ALPHA has encountered a key zone filled with strong buy orders.
The volume of these orders appears sufficient to potentially pump ALPHA to higher levels.
On the chart, we also have bullish confirmations, such as the formation of a CH (Change of Character) and the breakout of the trigger line.
As long as the green zone holds, ALPHA can move toward the target profit (TP) levels marked on the chart.
However, a daily candle closing below the invalidation level would invalidate this analysis.
Do not enter the position without capital management and stop setting
Comment if you have any questions
thank you

ALPHAUSDT 1WALPHA ~ 1W Analysis
#ALPHA This is the lowest support for now. Buy from here with a short -term target of at least 15%+. Trading is very high risk.

#ALPHA: Will the Bulls Take Over or Is Another Shakeout Coming?Yello, Paradisers! Is #ALPHAUSDT ready for a major breakout, or will weak hands get liquidated before the real move begins? Let’s dive into the latest setup of #Stella:
💎#ALPHA is trading within a falling wedge, a classic bullish reversal pattern. This setup often signals a strong breakout once the price breaks above the descending resistance. The probability of a bullish breakout is high due to the bullish divergence on the MACD.
💎The immediate resistance is at $0.0659. A decisive break and close above this level could trigger a bullish rally toward the next target at $0.0934. But the real game-changer will be the strong resistance zone around $0.12. If ALPHA pushes through that, you can expect fireworks.
💎The bullish divergence on the MACD further strengthens the bullish outlook. This indicates potential momentum building up for a reversal. However, don't rule out a possible liquidity grab—we might see the price dip towards the $0.0368 or even the $0.0245 strong support zone to shake out weak hands before the real move happens.
💎The $0.0368 support level is crucial. A breakdown below this could lead to a retest of the $0.0245 zone. If #ALPHAUSD falls below $0.0245, the bullish setup would be invalidated, and we might see a deeper correction towards $0.01. Stay vigilant and manage your risk carefully.
Stay focused, patient, and disciplined, Paradisers🥂
MyCryptoParadise
iFeel the success🌴

ALPHAUSDT 1WALPHA ~ 1W Analysis
#ALPHA If you still have a Conviction on this Coin, Maybe you can consider this support to start buying again, a minimum target of 20%+
ALPHAOFSOL/USDT NEW INCREASE VOLUMEALPHAOFSOLUSDT can show na ew volume increase in the coming time frames.

ALPHAUSDT 1WALPHA ~ 1W
#ALPHA So far it continues to maintain this support block,. If you still have Conviction on this coin,. buy after retesting this support block, with a short-term target of at least 20%+

Ego/UsdtBYBIT:EGOUSDT
### 1. **Current Price: $0.020089** 📉
- The **current price** of the asset is **$0.020089**. This is the price at which the cryptocurrency is being traded right now. You mentioned that it's "holding" around this price, meaning it's consolidating in this area without making significant moves either up or down.
### 2. **Next Resistance Level: $0.02500** 💥
- A **resistance level** is a price point where the asset historically struggles to rise above. It's a level where selling pressure typically overcomes buying pressure, causing the price to either stall or reverse direction.
- The **next resistance** for this cryptocurrency is **$0.02500**. This means that if the price manages to rise above the current price, it may face resistance near $0.02500. If it breaks this level, it could continue climbing higher.
### 3. **Immediate Resistance: $0.02343** 🚧
- The **immediate resistance** level is a more near-term barrier that could halt the price rise temporarily. You noted that there is **slow rejection** at this level, meaning that as the price approaches **$0.02343**, selling pressure is starting to take over, pushing the price back down.
- If the price keeps rejecting at this level, it suggests that **$0.02343** is a strong area of resistance, and the asset might not easily push past it without significant buying pressure.
### 4. **Support Levels: $0.01800 ↘️ / $0.01400 🛑**
- A **support level** is the opposite of a resistance level: it's a price point where an asset tends to find buying interest, which prevents the price from falling further. Essentially, it's where the asset "bounces" off.
- The **support levels** you mentioned are **$0.01800** and **$0.01400**. If the price starts to fall and breaks through resistance at $0.02343, these support levels act as safety zones.
- **$0.01800** would be the first level to watch for buying interest. If the price breaks below this, then the next support is **$0.01400**, which might be a stronger point where the price could stabilize again.
### To summarize:
- **Current Price**: Price is holding at **$0.020089**.
- **Resistance**: The next resistance is around **$0.02500**, but **$0.02343** is a more immediate barrier.
- **Support**: If the price falls, the first support level is at **$0.01800**, with a more significant support at **$0.01400**.
Disclaimer : This analysis can help you understand where the price might face difficulties moving up or down. But remember, cryptocurrency markets are volatile, so these levels can change quickly, and always perform your own research before making any trading decisions.

ALPHA planThis is my plan for ALPHA. Buy in orange box because I expect us to go down a little bit lower.

#ALPHA/USDT Ready to go higher
#ALPHA
The price is moving in a descending channel on the 1-hour frame and sticking to it well
We have a bounce from the lower limit of the descending channel, this support is at 0.1048
We have a downtrend on the RSI indicator that is about to be broken, which supports the rise
We have a trend to stabilize above the moving average 100
Entry price 0.1080
First target 0.1110
Second target 0.1182
Third target 0.1248

Alpha/UsdtBINANCE:ALPHAUSDT
---
🚨 ** NSE:ALPHA Bullish Setup Alert** 📈
**Heads up!** We have a potential bullish move in play with key resistance levels around **0.1280 - 0.1300**. Keep an eye on it—don’t sleep on your gains! 🔥
⚠️ **Reminder:** This is not financial advice—just sharing the setup for educational purposes! Always do your own research. ⭐️🐳
---

Stella (ALPHA)Stella's chart is straightforward; a sharp upward move followed by a lengthy correction wave unfolded in a big descending triangle pattern. Recently, ALPHA broke the major downtrend line. Let's see how up Stella can go.

ALPHA Will Shows Significant Gains But Finally CollapsesHello, Skyrexians!
As you know we like to share with you analysis on crypto assets which are in uptrend and have significant potential to grow. Today we wanna show you the example of coin which is likely in global downtrend. For sure BINANCE:ALPHAUSDT has not set the lower low in comparison to previous bull run, but it dropped significantly to set the new ATH, that is we expect only exit pump.
Let's take a look at the weekly time frame. We can see that current bear market is much more intensive than on other assets. We can see here the clear 5 Elliott waves structure to the downside. The wave 5 is likely to be finished already finishing the wave 1 of higher degree. Green dot on the Bullish/Bearish Reversal Bar Indicator shows us the strongest reversal sign that bear market is finished.
It means, that large wave 2 can happen now. Despite this asset is in global downtrend it can make significant gains reaching 0.5-0.61 Fibonacci retracement level. Notice that this Fibonacci based on regular chart. We show Fibo chart for your convenience. The target is located between $1.47 and $1.87. After such incredible growth we expect the huge crash to new all-time low.
Best regards,
Skyrexio Team
___________________________________________________________
Please, boost this article and subscribe our page if you like analysis!

ALPHAUSDT 1WALPHA ~ 1W
#ALPHA If you still have Conviction on this coin,. Buy gradually inside this pattern,. it is only a matter of time that this resistance line is successfully broken, with a minimum target of 20%+

3 Altcoins to watch this weekend...BINANCE:RAREUSDT
After a 50% surge, RARE is currently in a sharp correction phase.
As it approaches the black structure, I will be looking for trend-following longs.
BINANCE:MASKUSDT
Just like RARE, MASK surged by over 60% forming a massive demand zone marked in blue.
As it retests the demand zone, it would be an attractive zone to look for longs at a discount.
BINANCE:ALPHAUSDT
This one is the strongest among today's list, as it surged by almost 50% 2 weeks ago.
ALPHA has been in a correction mode and seems the bears are loosing momentum.
The more it approaches the gray demand zone, the more potential the bulls will have to kick in.
Which altcoins would you like me to cover next?
All Strategies Are Good; If Managed Properly!
~Rich
