Alphabet Inc To keep in portfolioBeing on an uptrend with no sign of a trend change
Watch out for potential breaks of the support or resistance lines
Keep in the portfolio
Alphabet


Looking for a longterm investmentThe course of the technology giants has risen enormously. Do not worry there are still opportunities. The profit of the company has grown along.
Alphabet, the company behind Google, seems to be on the expensive side with a price to earnings ratio of 35.15. However, this is bad at all when we look at all the investments made.
Alphabet appears to be quite far with self-driving cars and also invests heavily in cloud services. This is still at the expense of profit, but does offer enormous potential. The same goes for Maps and YouTube. The well-known video site is only now really starting to show its potential and despite the enormous potential, Google Maps is still hardly being earned.
Core businesses generated an increase of 18% in profit. However, costs of new investments also increased.
With a current market value of $ 1.422 billion, the underlying price earnings ratio is not expensive for a debt-free company, with an enormously strong market position and a lot of growth potential.
And remember, when in doubt, zoom out!
Looking at the chart, the stock is in a upwards position and taken into account the new developments, this will not change, especially not on long term.

Alphabet - Bouhmidi-Breakout and Alltimehigh Nice momentum after breaking upper #Bouhmidi-Band......

Google Pre-EarningsQuite a clean and clear bullish chart heading into earnings. If earnings are a beat and market sentiment improves in the near-term, Google can get to 2000 easily within the next 2 months before taking a long-haul flight to 2200.
Google is currently trading at nearly 35 times PE ratio yet there will be buyers in queue near the 1760 mark if we get there post an earnings beat.

Elliott Wave View: Alphabet (GOOGL) Impulsive Rally IncompleteShort Term Elliott Wave view in Alphabet (ticker: GOOGL) suggests the rally from December 21,2020 low is unfolding as a 5 waves impulse Elliott Wave structure. Up from December 21 low, wave 1 ended at 1788.57 and pullback in wave 2 ended at 1696.10. Wave 3 higher remains in progress as another 5 waves of lesser degree. Up from wave 2 low at 1696.10, wave ((i)) ended at 1801 and dips in wave ((ii)) ended at 1711.65. Stock then resumed higher in wave ((iiii)) towards 1932.08 and wave ((iv)) pullback is proposed complete at 1859.16.
The stock still needs to break above wave ((iii)) at 1932.08 to avoid a double correction in wave ((iv)). Near term, while pullback stays above wave ((iv)) low at 1859.16, and more importantly above 1711.65, expect the stock to resume higher. If the stock breaks below 1859.16, then it’s doing a double three (w)-(y)-(y) and should find support at the next extreme area in 7 swing. As far as wave ((ii)) pivot low on January 16 at 1711.65 remains intact, expect dips to find support in 3, 7, or 11 swing for more upside.

GOOGLE - shortThese are my thoughts on Google. They are meant to give you an idea, not trading advice.
Inverse head & shoulders.
Target 1550 - 1600
Please be careful, as the market never gives you certainties, only probabilities!
ALWAYS REMEMBER THIS WHEN YOU TRADE


GOOG/Alphabet UPTRENDI believe we will have a short-term bearish move till the trend line because of the MACD divergence.
My entry is after breakout of the purpled area which is FIB PROJECTION 0.618


GOOGLE Sustainable growth for the next 3 months?Just a fractal play but tell me don't those two sequences have a lot in common? First an aggressive Bull Phase 1 and then a more sustainable Bull Phase 2, supported by the 1D MA50 (blue trend-line). Can GOOG repeat this pattern?
Please like, subscribe and share your ideas and charts with the community!
--------------------------------------------------------------------------------------------------------
!! Donations via TradingView coins also help me a great deal at posting more free trading content and signals here !!
🎉 👍 Shout-out to TradingShot's 💰 top TradingView Coin donor 💰 this week ==> seba26-77
--------------------------------------------------------------------------------------------------------

Still bullish on Alphabet. NASDAQ: GOOGLI was looking through the hightech QQQ stock index and thought I might do a review on some of the major players in that index. Still bullish on Alphabet, but it's looking like it's closer to the end here. RSI shows slowing momentum, EWO is in agreement with my fractal mapping. Expecting a fifth wave to complete now. Fibonacci goals are inplace. If my count is right then we are correcting, and this too will drop unless FedReserve doesn't step in and start printing even more money. I will be watching this space closely. NFA .

Waiting for bullish impulse on google.Waiting for bullish impulse on google. MACD and parabolic sar are in a good shape right now. This month anyway could have a great volatility due to the elections. Let's see what happens, this idea could last the whole year

GOOGL/Alphabet has an ENTRY for taking PROFIT.As you can see on the the price has broken the FIB RET 0.618 and it will goes up to 1720$ with ease.

Sell google 24/9/2020Google stock is moving in a short term downtrend
EMA 13 broke down EMA 34 with prices dropping when testing them
And high trading volumes
So it can sell
Target 1221.8 stop losses 1527.2

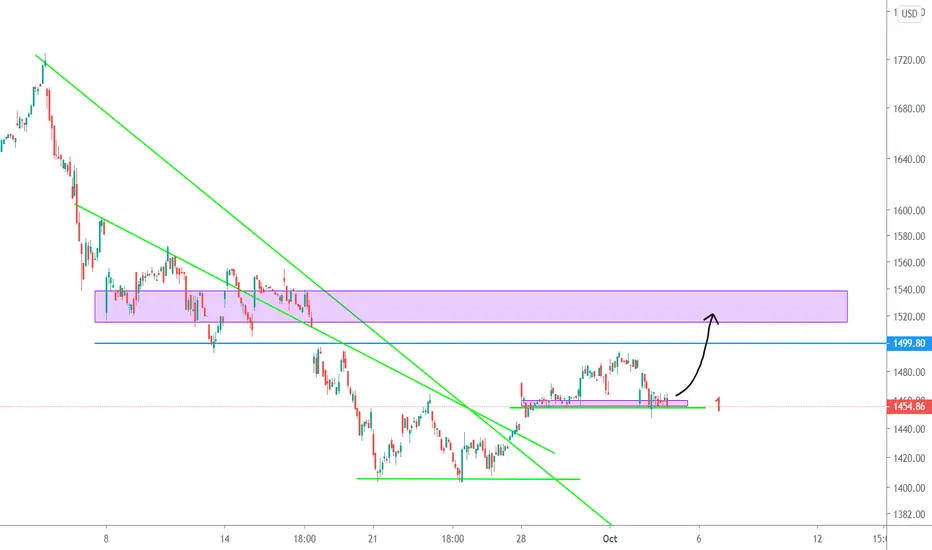
GOOGL/Alphabet is going to be bullish IF...IF the price wont break the '1' line which is located on the chart, GOOGL is going to be bullish with ease up to 1500$.
Is GOOGL/Alphabet going to bull??I believe we have a good entry point after the pullback with considering the next resistance line as TP.

alphabet sellers are getting weakthe sellers are getting weak and weaker with a good support of buyers
the chart says it all
like and share if it was usefull

These 3 Big Tech also-rans underperforming NASDAQ since Apr 2020These three Big Tech also-rans a bit limp in performance, underperforming the Nasdaq Composite Index, since April 2020 (i.e. Microsoft MSFT, Alphabet GOOG and Netflix NFLX... as opposed to Apple AAPL, Amazon AMZN and Tesla TSLA).

Buy Google 16/9/2020Google is still moving in a short-term upward trend despite the recent correction.
Still maintaining levels above 1470.
So you can buy
The target is 1706.5
Stop Loss 1447.5
Good luck

Buy Google 7/8/2020Google share is moving in a short-term upward trend
It was able to rebound from the 34 EMA upwards
So we can buy
1668 targeted
Stop the loss of 1450
