GOOGLE Trade SetupThis Analysis Is Done Only For Educational & Intelligence Purpose, Invest Or Trade At your Own Risk & Will.
Alphabet


LOOK FOR DOWNSIDE TRADE IN ALPHABETStrong chance of going downside for completion of corrective pattern.

GOOG now short but still long?Hey everyone,
Google made it's way to ATH but now the party is over, at least for a short time. As you can see there is a SHS formation and the reaction was bad. But the stock will face a few support zones, as the yellow lines and the green box, as well as the Fibo Retracement, shows. The DEMA and SMA also show a short signal since friday. BUT chances are good google turns back long after hitting the green box.
Entry: 1441$
Stop: 1400$
Goal: 1622$
Much fun with that trade!
Leave a follow, my goal is 200 :)

GOOGLE - Alphabet Based on technical Analysis, the idea is to go long if the tentative trendline will work as trendline.
The trend is bullish, stochastic is on oversold and seems ready to move upward.


GOOGL wave (4) PullbackGOOGL wave III completed and we’ve rallied in a complete motive impulse. Is this wave (5) of higher degree wave III. On guard for a possible top.


Alphabet (GOOGLE) - Grab at Demand & Accumulation ZoneNASDAQ:GOOGL be ready to grab some near demand & rest at accumulation zone.

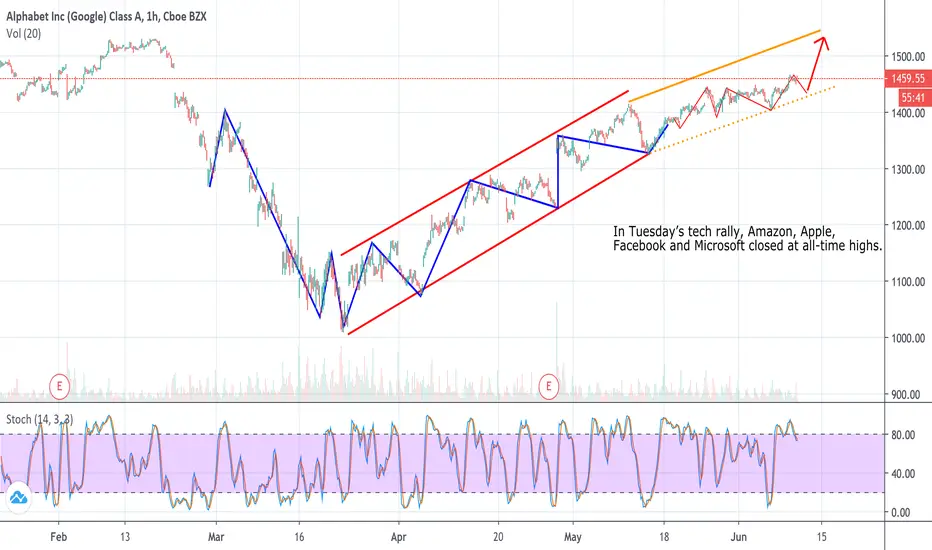
ALPHABET ($GOOGL) 🏁 | The Google Article Of Your DreamsToday we are looking to see if Alphabet can follow other tech companies like Apple to make new highs. Big tech companies (Apple, Microsoft, Facebook, Alphabet, especially) making new highs is bullish for the market a few reasons, as we covered in a previous post (see our related S&P post in the links below).
The good news is some rotation out of other sectors and into tech today might be just what is needed to push the NASDAQ, big tech, and Alphabet to new heights.
Let's take a look at big search to see if GOOGL has what it takes to break resistance.
Hit that 👍 button to show support for the content and help us grow 🐣
Support:
The S1 bullish S/R orderblock cluster is our first point of support for the GOOGL bulls. Although we would likely get there by way of a series of lower lows, there is no reason we can't find support here and move up as people weight their portfolio to tech due to "second wave" COVID fears.
If S1 can't hold, the S2 orderblock formed by a previous gap is a good candidate for support. This isn't the ideal correction for the bulls, but it retains an overall bullish price structure.
The S3 S/R flip is hard to hit without the bullish market structure being lost, however, it is a notable support level if the markets go into a more serious correction. While support exists below S3, it is irrelevant to our current question of a path to new all-time highs over any reasonable timeframe.
Resistance:
R1 is the first point of resistance for the bulls. Breaching R1 and finding support on it or above it is paramount. The ideal for bulls is to maintain the current momentum and avoid a pattern of lower highs and lower lows.
Above R1 we have the R2 orderblock from the gap down at the start of the COVID drop. R2 is a logical point of resistance on the path to all-time-highs, as it gives a chance for consolidation without sacrificing momentum.
Lastly, the R3 S/R Flip and R4 all-time highs are the final points of resistance. Either/both of these levels could provide one final challenge for bulls before it's off to the races.
Summary:
Alphabet has a clear path to all-time highs, and if the bulls can pull it off it will be very bullish for the markets. If Apple can do it, we think Alphabet can do it. Then of course so can Microsoft, Facebook, etc. This should set off a chain reaction to take the indexes (which are all tech-heavy) to new highs.
Resources:
finance.yahoo.com + www.cbsnews.com
✨Drop a comment asking for an update, we do NEW setups every day! ✨
Like, Comment & Follow to help the community grow 🎉🎉

GOOGLE - Alphabet Stock Analysis With Technical AnalysisBased on Technical Analysis:
Prices are moving inside a channel and the idea is to go long, but wait the end of a potential price retracement before going long NASDAQ:GOOGL
GOOGLE to go down under 1000/-if stop loss is triggered then wait for near 1600 and short from there target however remains the same!!

TESLA , a Bull in the moonTSLA
Tesla, bullish going up, because his effords and the success of SpaceX missión, a great hope for humanity and spacial carrer.
It´s the start of a Bullish trend. Maybe, we will see a correction, and then go up.
Is also recommended to get in Alphabet (GOOGL), the firm has participation in SpaceX.
Good trades!!
See you Later!

GOOGL Weekly Resistance| S/R Flip| Blue Sky Breakout Evening Traders,
Today’s Technical Analysis – GOOGL – breaking a multi-year weekly resistance with strong volume. Consolidation and a retest of structure will confirm a new range.
Points to consider,
- Multiple weekly closes
- Strong volume
- S/R Flip retest (confirmation)
- Local high (blue sky breakout
GOOGL has closed consecutive weekly candles above structural resistance. this shows strength in price action as volume was considerably high at the point of break.
A Support/Resistance Flip will further confirm a true break as this will solidify the new support
GOOGL is in a strong multi-year bull trend, taking out the recent highs will establish a blue sky breakout.
Overall, in my opinion, GOOGL confirming an S/R flip will be extremely bullish. This will mean that the multi-year range has broken and price is likely to establish new highs.
What are your thoughts?
Please leave a like and comment,
And remember,
“The hard, cold reality of trading is that every trade has an uncertain outcome.” ― Mark Douglas,

Google Continued Trend and Next Opportunity Expected! Welcome to Profitlio Trading!
What's up traders! Thanks for Jumping back on my Analysis, Traderchamp is here on your Service, Also hit thumbs up and support the work.
The continued trend is expected to show up a possible breakout on the key level sitting above. And will wait for the confirmation and entering in a perfect retest and reversal towards the market resistance on TOP! Sketch up your own trade setup and make sure you meet with the required confirmations first before you make your move!
Profitlio Trading ( Since 2014 in Financial Markets )
________________________________________________
Traders Disclaimer: Non of our analysis or trade setups being shared here on tradingview is a trading advice. As we keep on weekly updates with our predictions and expectations. We may take them as a trade only if trade setup meets the required criteria ( Confirmations ). Unless we will never take them as a trade if it never reach our trading requirements.
Take them at your own risk as trading is highly risky and you may loss your investments. Our trades are based on Swinging and Mid to long term approaches. All trades executed will be handled under the name of Profitlio Trading only.

ALPHABET ($GOOGL): Does ALPHABET Go All the Way?✨ New charts every day ✨
Like, Comment & Follow to help the community grow 🎉🎉
---
Despite taking a hit on the ad side of the business, Google (GOOG / GOOGL) has had a textbook "V" shaped recovery (Or in this case, an upside down "A" recovery we could say). Can the bulls make the final push back to all time highs? One could argue the new stimulus package will have a positive effect on the markets and give this tech giant room to finish running. So let's map out a potential pathway for the bulls.
Resource: www.cnn.com + www.marketwatch.com
---
1. Fractal Trend is showing an uptrend (Aqua bar color) on the 1 hour timeframe giving us a clear trend to look for a long setup within.
2. With this strategy, we are looking for long setups in an uptrend and as such want to enter long on retests of bullish order blocks plotted by Orderblock Mapping (Aqua) and/or bullish S/R levels plotted by Directional Bias (Aqua).
3. As you can see we had a great long setup entry at S1, sadly this was missed so we can only plan for what may happen now and not worry about the past.
4. The target for this move is up though the "COVID gap" and all the way to the range created by previous highs at R4. This is good news for anyone already long.
5. If we don't see bullish continuation off this move, then there is another potential long at S2 assuming Fractal Trend gives the green light.
6. If Fractal Trend signals a downtrend (Maroon bar color), then any long positions should exit as this is seen as indecision/weakness, otherwise the bet is on GOOGL continuing its recovery.

Alphabet - Healthy Upleg Next Resistance at $1420.
A strong breakout above $1420 would trigger an upleg to the $1500-$1520 zone.

GOOGLE - Alphabet INC Technical AnalysisNASDAQ:GOOG
Just Wait the right signal to buy. Market is bullish, but not signal to buy.
Short term the prices are bearish.

Google (Alphabet) Technical Analysis vs FundamentalGoogle Market long term Analysis shows that the Market is Bullish, let's invest in the trend direction and just wait for the right signal to buy
Yesterday's earning report was "positive" with an earning for shear $9.87 (Earning per shear of the previous quarter was $15.35 - so 36% less).
The stochastic and Volume can indicate that there might be an immediate reversal in the 30 minutes trend to uptrend.
In conclusion
Short term - Go long, just wait the right signal.

#GOOGLE ANALYSIS.. COLLAPSE WILL SURELY COME.. In my previous analysis, I mentioned that a strong sales wave could come to the markets again, in this context, I expect a structure as I mentioned in the chart.. Ascending broadening wedge pattern is may trying to tell us something..
Never say never.. Markets will be very interesting after 6 months, we will wait and see.. I firmly believe that big crash will come eventually and oil prices were the leading indicator of this..
Actually, I wrote that passage again and again in my previous analysis, please keep these in mind, greath depression is coming..
Disclaimer: Please do your own due diligence when it comes to trading.. Never put in money that you cannot afford to lose.. Invest at your own risk..
I wish you all the best..

"Google: Potential to move up towards the Fibo Zones"4H Chart Explanation:
- Price bounced on the Weekly Ascending Trendline and broke the Descending Trendline.
- Now, it is on a Corrective Structure.
- If price breaks it, potential to move up towards the Fibo Zones.
Weekly Vision:
Daily Vision:

FANG Index is back at AllTimeHighIt´s insane how powerfull and quick the well known FANG Index is back on track at it´s AllTimeHigh $FB $AMZN $NFLX $GOOGL.
All of them have strong revenues, growth, profits and a chart, which knows only one way --> UP
Let´s see what´s coming next.
>> And never fortget ! -- Plan your trade and trade your plan ! <<

