alpha looking goodalpha looking good here if you got in on my previous chart
still alot of room for for it to go
ALPHABTC

ALPHA/USDT BUY SET UP$ALPHA Breakout Key Resistance for confirm bullish movement with Big volume on resistance, Valid retest resistance become support
Potential Continue upward Movement 🚀
RSI Bullish divergence On Daily
Target mentioned in the chart
Stoploss : $0.295
Risk : 6%

Alpha bull divsalpha is looking great to accumulate down here,
could potentially be close to breaking the down trend

alpha looking good alpha is looking great to accumulate down here,
could potentially be close to breaking the down trend

ALPHA/USDT 1DAY UPDATE BY CRYPTOSANDERSWelcome to this quick ALPHA/USDT analysis.
I have tried my best to bring the best possible outcome in this chart.
Reason of trade:-ALPHA/USDT is bullish and buy CMP and Green zone down side brake and position close
Entry:-CMP and BUY THE GREEN ZONE
Target:- 20% to 25%
Stop loss:- Green zone down side close
Remember:-This is not a piece of financial advice. All investment made by me is under my own risk and I am held responsible for my own profit and losses. So, do your own research before investing in this trade.
Happy trading.
Sorry for my English it is not my native language
Do hit the like button if you like it and share your charts in the comments section.
Thank you.

#alpha looking good to accumalate#alpha looking good to accumulate
stocking up on a lot down here
lots of potential if it breaks the down trend

ALPHAUSDT 1DAlphausdt has reached its dynamic support on the daily timeframe . if it can hold the support zone and start its uptrend , we could see the alpha around 1$ zone again.
Invest in the future ...

Alpha Finance mainnet coming, Might pumpKeyword of importance is might, I never trade such slow coins but it can pump this time. Why? TA much imporessive? Absolutely no.
But they do have a mainnet event coming this 8th December
Buy the hype, sell the news.
WAGMI
-Nav

ALPHA inverted H&SAlpha Finance Lab is forming Inverted Head and Shoulders🤷 and if price breaks up I think there is chance for run to 1.1 and even higher. Will set the BUY LIMIT order to catch the pullback to Neckline (testing it from above).
ENTRY : Backtest of the broken Neckline @ 0.9610
SL : Right Shoulder @ 0.9047
TARGET : Inverted H&S target projection @ 1.1030
RRR : 2.6
INVALIDATION : when SL level hit
Check my other stuff in related ideas.
Please like👍, comment🗣️, follow me✒️, enjoy📺!
⚠️Disclaimer: I'm not financial advisor. This is not a financial advice. Do your own due dilingence.

ALPHABTCALPHA has formed a good upward pattern and could start a bullish movement. Targets are shown in the chart.


AlphabtcHi. We see alpha is in decending wedge. And now we see breakup done and we take profit with 200% potential.

Alpha new cycle
In Alpha/ BTC there is still a lot of distance from the previous highs, which will slowly correct back as bitcoin rises
Here is my chart analysis Thank you for watching
GL

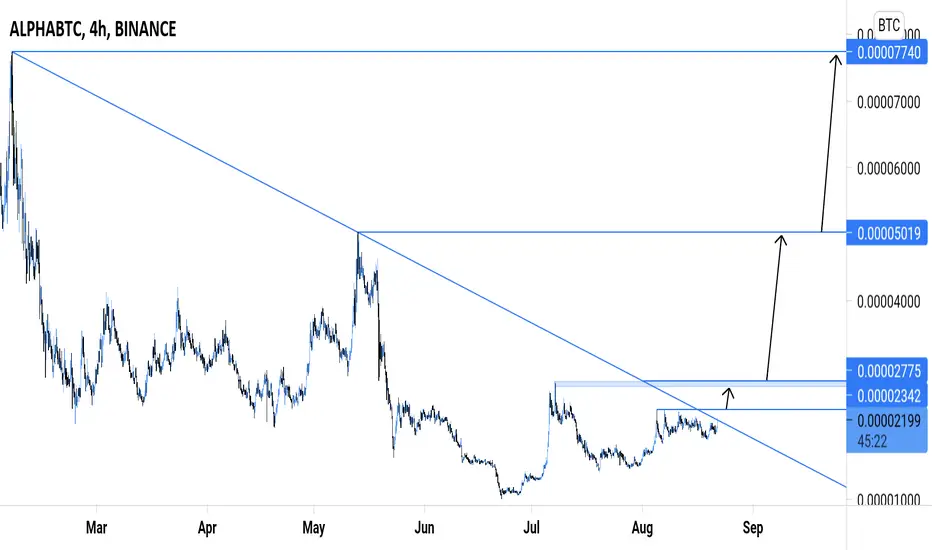
ALPHA/BTC { ALPHA FINANCE LAB } - BULLISH SETUPANALYSIS 🔎
- ALPHA/BTC was resisted by the descending trendline resistance.
- Price brokeout above the descending trendline resistance.
- This is a bullish signal.
BUY ENTRY ⬆️
- Market entry: current market price.
- Limit entry: possible retest.
- Stop limit: breakout above the horizontal resistance level (@0.00002342).
TARGETS 🎯
- Horizontal resistance level (@0.00002775).
- Horizontal resistance level (@0.00005019).
- Horizontal resistance level (@0.00007740).
SETUP INVALIDATION ❌
- Breakdown below the previous swing low support level.
KEY RESISTANCE AHEADI want to see the price clearly close above this last grey area, clear S/R, close and consolidate above, and thats a clear long to those levels in chart, probably new ATH.
Good luck!

Alpha Comprehensive AnalysisI see a static resistance around 2230 satoshi which is tested and then denied about 7 times lately. In theory I assume that resistance is finally broken so what is the target? A giant dynamic resistance has been formed since day One of alpha(The great gray line). Price has been playing below that grey line for about 90 days. That is a strong and serious line which may cause a delay on price growth. Now Price around that line is around 2800 satoshi.
Above is another trendline which has been formed since the local top around Mid-May.Now Price around that line is around 3000 satoshi. That is a focal point which may let price grow through last top area (7k satoshi).
So There is a road to ride for Alpha and there is a safer way with fundamentals. Team has released many great news about a product called Alpha X. I personally think if price tend to break aforementioned lines, it absolutely needs driving fundamentals like Alpha X( In case of a great product). Below I highlighted a Fibo channel which shows good points to take profits.

Alpha Finance Lab - ALPHAUSD- Head and Shoulders!- Alpha Finance Lab - Rank #132, Volume 24h $62,118,554.
- On the chart we can clearly see and Head and Shoulders bullish pattern.
- Target is previous swing high & HaS & 1.1618 FIB!
- We can also spot a bullish volume, which dominates!
- For expected duration of the trade, probability, stop loss, profit target, entry price and risk to reward ratio (RRR) - please check my signature below ↓
- If you want to see more of these ideas, hit "Like" & "Follow"!

$ALPHA,~30% on the daily ...$ALPHA
~30% on the daily , showing increasing volume as its facing ~2300 sats resistance
From here, looking for a breakout/flip over this level as continuation..
UCTS took the entry at 12H Buy (usually strong) and ~25% up so far..
Let it run
#ALPHA

ALPHAUSD ideaReaffirming the uptrend after a break Tried to portray this using a large upward channel
Inverse H&S present which confirms the bull scenario

Alpha X is coming.Hello again.
I jumped into a great project with lots of products. Let's get to TA directly .
I see 2x dynamic resistance that we need to breakup and a great support that holds price at 2231 sats. Watch out for any upward or downward breakout so you can trade that. $ALPHA

#ALPHA, Following what many alts have been showing...#ALPHA
Following what many alts have been showing over the last 48/72hs..
Crossing above an important level, if manages to hold/flip it, then ~2300 sats as next target
~25% up since entry on UCTS 12H buy signal already.
$ALPHA

ALPHA - Is it over?ALPHA moved more than 60% which is amazing. But I think it's he end of it because it topped all the local resistance areas and now the sell volume is going up. It must have a small correction before going up again.
If the prices crossed that resistance area and closed a 4H candle above that price zone, then you can open your long positions and aim for the other resistance line as TP!
Current Market Price: $0.8550
Good Luck
Tell me your ideas. Like and Share!
Follow for more updates.
