ALPHAUSDT 1D Analyss ALPHA ~ 1D Analysis
#ALPHA Buy after successfully breaking through this resistance line with a short-term target of at least 15%++.
Alphausdlong

#ALPHA/USDT#ALPHA
The price is moving within a descending channel on the 1-hour frame, adhering well to it, and is heading for a strong breakout and retest.
We are seeing a bounce from the lower boundary of the descending channel, which is support at 0.0293.
We have a downtrend on the RSI indicator that is about to be broken and retested, supporting the upward trend.
We are looking for stability above the 100 moving average.
Entry price: 0.0300
First target: 0.0306
Second target: 0.0314
Third target: 0.0323

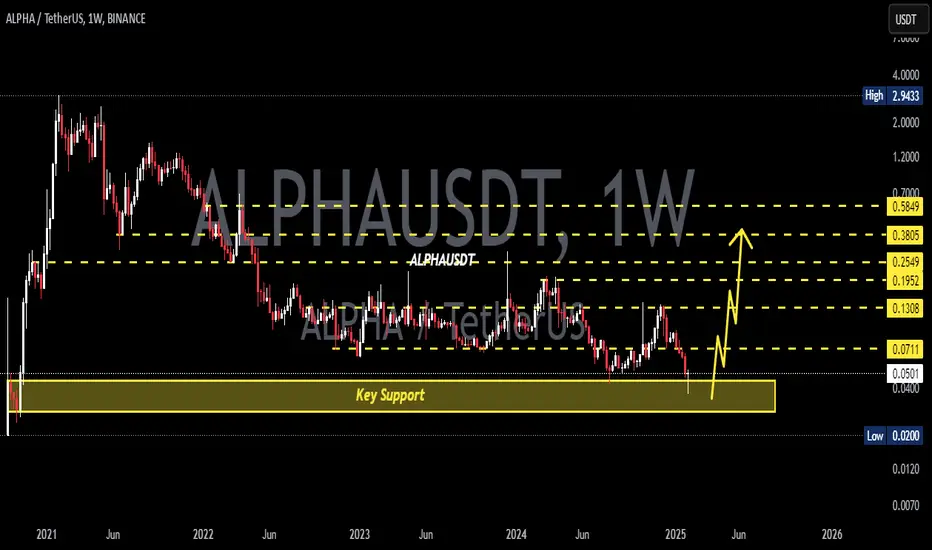
ALPHAUSDT 1WALPHA ~ 1W Analysis
#ALPHA This is the lowest support for now. Buy from here with a short -term target of at least 15%+. Trading is very high risk.

ALPHAUSDT 1WALPHA ~ 1W Analysis
#ALPHA If you still have a Conviction on this Coin, Maybe you can consider this support to start buying again, a minimum target of 20%+
ALPHAUSDT 1WALPHA ~ 1W
#ALPHA So far it continues to maintain this support block,. If you still have Conviction on this coin,. buy after retesting this support block, with a short-term target of at least 20%+

#ALPHA/USDT Ready to go higher
#ALPHA
The price is moving in a descending channel on the 1-hour frame and sticking to it well
We have a bounce from the lower limit of the descending channel, this support is at 0.1048
We have a downtrend on the RSI indicator that is about to be broken, which supports the rise
We have a trend to stabilize above the moving average 100
Entry price 0.1080
First target 0.1110
Second target 0.1182
Third target 0.1248

ALPHA Will Shows Significant Gains But Finally CollapsesHello, Skyrexians!
As you know we like to share with you analysis on crypto assets which are in uptrend and have significant potential to grow. Today we wanna show you the example of coin which is likely in global downtrend. For sure BINANCE:ALPHAUSDT has not set the lower low in comparison to previous bull run, but it dropped significantly to set the new ATH, that is we expect only exit pump.
Let's take a look at the weekly time frame. We can see that current bear market is much more intensive than on other assets. We can see here the clear 5 Elliott waves structure to the downside. The wave 5 is likely to be finished already finishing the wave 1 of higher degree. Green dot on the Bullish/Bearish Reversal Bar Indicator shows us the strongest reversal sign that bear market is finished.
It means, that large wave 2 can happen now. Despite this asset is in global downtrend it can make significant gains reaching 0.5-0.61 Fibonacci retracement level. Notice that this Fibonacci based on regular chart. We show Fibo chart for your convenience. The target is located between $1.47 and $1.87. After such incredible growth we expect the huge crash to new all-time low.
Best regards,
Skyrexio Team
___________________________________________________________
Please, boost this article and subscribe our page if you like analysis!

ALPHAUSDT 1WALPHA ~ 1W
#ALPHA If you still have Conviction on this coin,. Buy gradually inside this pattern,. it is only a matter of time that this resistance line is successfully broken, with a minimum target of 20%+

ALPHAUSD 1WALPHA ~ 1 W 📈
#ALPHA Make purchases gradually from here, with a minimum target of 20%++. A retest of this support line has been successful.

#ALPHA/USDT | Ready To Go#ALPHA
The 1-day bearish channel was broken strongly to the upside
Supported by stability above the Moving Average 100
It is supported by a rebound from the green support area on the chart
We also have a positive divergence on the RSI indicator
Entry price is 0.1150
The first target is 0.1253
The second goal is 0.1381
The third goal is 0.1543

#ALPHA/USDT#ALPHA
The price has been moving in a descending triangle since May 2022
The price gained support at 35
The price is now at the upper border of the channel at 0.070
About to break the downtrend
The price is expected to break the downtrend
At the first price of 0.0900
First goal 0.0160
Second target 0.2170
Which represents 300% of the current price
With an oversold presence on the MACD
The price will be paid after breaking the moving average 100
✅Thank you, for more ideas, hit 🚀 Like ❤️ and Follow🤝 🛎!

ALPHAUSDT - Buy Setup!!ALPHAUSDT (1D Chart) Technical analysis
ALPHAUSDT (1D Chart) Currently trading at $0.085
Buy level: Above $0.084
Stop loss: Below $0.073
TP1: $0.09
TP2: $0.1
TP3: $0.12
TP4: $0.145
Max Leverage 3x
Always keep Stop loss
Follow Our Tradingview Account for More Technical Analysis Updates, | Like, Share and Comment Your thoughts

ALPHA: READY FOR A BOUNCE BACK.ALPHA trade setup:
Entry: $0.149 to $0.154.
Stop Loss: $0.138.
Target: 10% to 20%.
Note: You can average your entry between $0.140 to $0.143. DYOR before investment.

🟢 ALPHAUSDT - 1D (26.09.2022)🟢 ALPHAUSDT
TF: 1D
Side: Long
Pattern Bull Pennant
SL: $0.0939
Leverage: 5x
TP 1: $0.1212
TP 2: $0.1333
TP 3: $0.1431
TP 4: $0.1529
This thing is looking super oversold. It could have a nice run up if BTC pumps.

alpha retest inalpha looking good here after retesting breaking the down trend
could see a big move soon

alpha breaking outhopefully you saw my early chart and caught the bottom and can now enjoy the ride
targets on chart

alpha looking goodalpha looking good down here
could potentially be about to break the down trend
if you got in on my earlier chart it looks like we got the bottom perfect

ALPHA/USDT 6 HOURS UPDATE Welcome to this quick Update, everyone.
If you are reading my updates for the first time do follow me to get more complex charts in a very simplified way.
I also post altcoin setups on Spot, Margin, and Futures.
I have tried my best to bring the best possible outcome in this chart.
ALPHA /USDT breaks this bullish expanding triangle pattern and now retesting it or on the support of 21MA.
Entry: CMP or upside the 21MA
Targets: 50%TO 60%
Stop Loss: $0.4
What's your thought on this?
Do hit the like button if you like this update and share your views in the comment section.
Thank you
#PEACE

ALPHAUSDT confirmed upside moveAlpha finance is ready to take off
Targets are marked yellow
Prepare yourself cause this can happen fast like with $STORJ , and $UMA
Trade is valid as long as the price stays above the range of 0.094 - 1.135$
No major sell walls, just resistances as fib levels and last retest of previous highs
Good luck

ALPHA/USDT - Potential 132% SetupHello Traders!
The upward movement of ALPHA was corrected.
At the moment, the price stands near the upper boundary of the consolidation range - the level of $1.10. MA100 is supporting on the daily timeframe.
It is possible to join purchases in the range of $0.95 - $1.05
Stop loss is better to be placed near the price level of $0.65.
The medium-term purchase targets are the levels of $1.89 and $2.24.
The ratio of risk/reward in the transaction = 4!
Good luck and watch out for the market
P.S. This is an educational analysis that shall not be considered financial advice

ALPHAUSDT (4h Chart) - Resistance BreakoutALPHAUSDT (4h Chart) Technical analysis
ALPHA/USDT (4h Chart) Currently trading at $0.983
Buy level :Above $0.972
Stop loss: Below $0.874
TP1: $1.061
TP2: $1.143
TP3: $1.222
TP4: $1.301
Max Leverage 3x
Always keep Stop loss
Follow Our Tradingview Account for More Technical Analysis Updates, | Like, Share and Comment Your thoughts.

ALPHAUSD ideaReaffirming the uptrend after a break Tried to portray this using a large upward channel
Inverse H&S present which confirms the bull scenario

CONTINUOUS DOWNSIDES TO ALPHAUSDT?The hourly uptrend looks like it just ended.
Price found rejection at the 4hr resistance level and started falling.
To look for shorts, we'll wait for the steady signs of the downtrend.
A lower high would be a sort of confirmation to look for shorts.
We do not need to rush in as the uptrend could still continue if there are no short confirmations.
