6/ Altseason: Live - Is this really the Altseason?12day Result I know this is the exact question you're asking yourselves as you look at your portfolios. "What altseason? Everything is flat."
Maybe I was wrong two weeks ago when I said it had already started. But, as they say, the result speaks for itself.
12 days ago, as part of the Altseason Live challenge, I started with $10k . Today, the account is at $35k .
Let's break down what's really happening, and why your feeling of having missed out is an illusion.
You are absolutely right in your observations. If we look at most coins, we'll see that they are still at the very bottom. They haven't even begun their main move yet.
Below are random strong projects of the industry
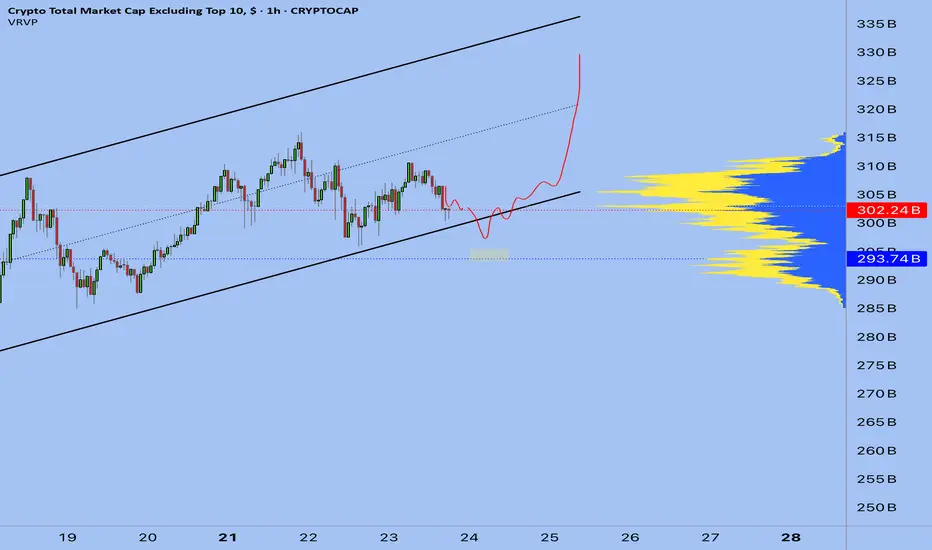
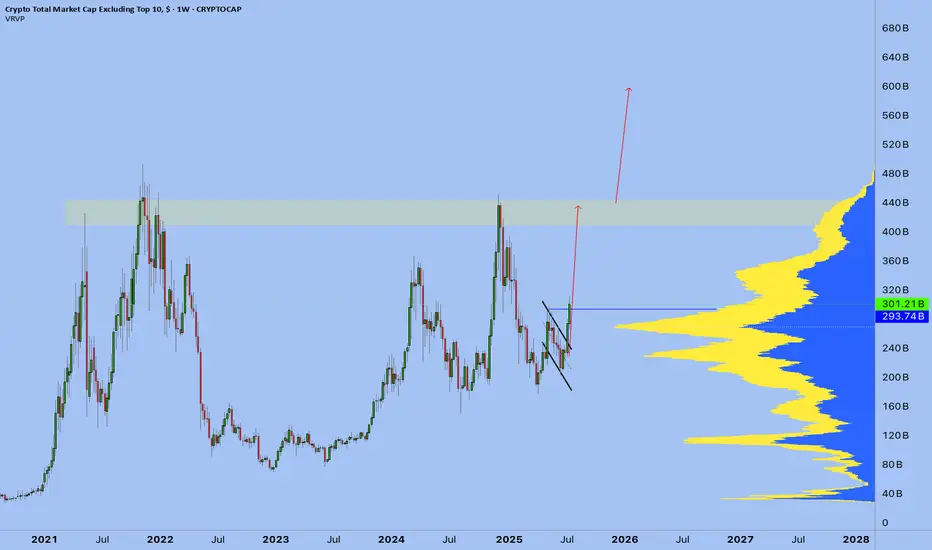
Here is the visual proof. This isn't a "dumping" market. This is a market that is accumulating energy. And that's the best possible news for anyone who thinks they've missed out. The main, most powerful wave of growth that will lift all these coins hasn't even started.
My result wasn't achieved through general market hype, but through surgical, precise trades. I used my coin-picking strategy (which I wrote about in Post 2/ Altseason: Live - My Coin-Picking Strategy) -focusing on projects that play by their own rules. I continue to do deep research and enter every position with surgical precision.
Why August Will Be Incredible. The Calm Before the Storm.
What we are seeing now is the classic calm before the storm. Most market participants don't understand what's happening and are in a state of confusion. But if you look closely, you can see that many projects have already completed their accumulation phase. An immense amount of power is building up under the hood of the market.
I believe that August will be the month when this energy is unleashed. It will be the month that kicks off the explosive, broad movement that everyone is waiting for. And that is exactly why now is the most crucial time. It's not a time for FOMO, but for level-headed preparation.
So, knowing all this, what do we do next?
First, we don't panic. We understand that the main train is still at the station.
We keep hunting for strength. My strategy of finding strong projects remains unchanged.
We use every correction as a gift. Any 15-25% dip on a promising asset is an opportunity, not a catastrophe.
We prepare for August. The next month could be the defining one for this entire cycle.
My result proves that opportunities always exist, even in a "sleeping" market. And for complete transparency, all proof of my trades is broadcasted on streaming platforms. The real fun, the altseason we are all waiting for, is still ahead. Stay focused.
Best regards EXCAVO
ALT

PENGU. Main trend. Trend reversal zone. 04 07 2025Logarithm. Main trend. Fresh cryptocurrency, which is being driven into hype.
Locally now. Price at the median of the bowl.
Buyer volume dominates. Most likely, there will be a large pump in case of a breakout.
The chart is somewhat reminiscent of the Bitcoin chart, the reversal zones of this secondary trend, after the first local wave of growth. The first local, significant target is shown.
There is a possibility of a helicopter, that is, to collect stops in both directions, and thereby dump passengers before a potential pump.
Such cryptocurrencies (low liquidity, monopoly over the price due to the concentration of cryptocurrency in “one hand”) at a good time "the hamster is not scared", will be pumped up conditionally, like Shiba Inu (SHIB), driving the hype (raising the price over and over again, and coming up with positive news) and 0.5 million Twitter subscribers (X). Medium-term — long-term level zones are shown on the chart.

5/Altseason Live Psychology:My Core Principle,Learned Over Years
This experience is built on analyzing every previous altseason. And here is the main takeaway: altseasons are always short, but incredibly rapid. In this chaos, most people, driven by emotion, make the same mistakes:
- They open too many trades.
-They close a position on the first small move, hoping to "re-enter" another project that's "about to explode."
-They shift capital from a growing asset to one that hasn't moved yet. And it still doesn't move.
The problem is the mindset. You don't invest in what's falling or bet on "dark horses." You invest in what is already growing.
This might sound new to some, but the most important principle in trading, and in life, is to REINFORCE STRENGTH.
This is an attention market. And attention is captured by the speed and power of growth. Everyone is looking at what's pumping. That's where the money flows. Your job is to be in that flow, not to try and catch a falling knife.
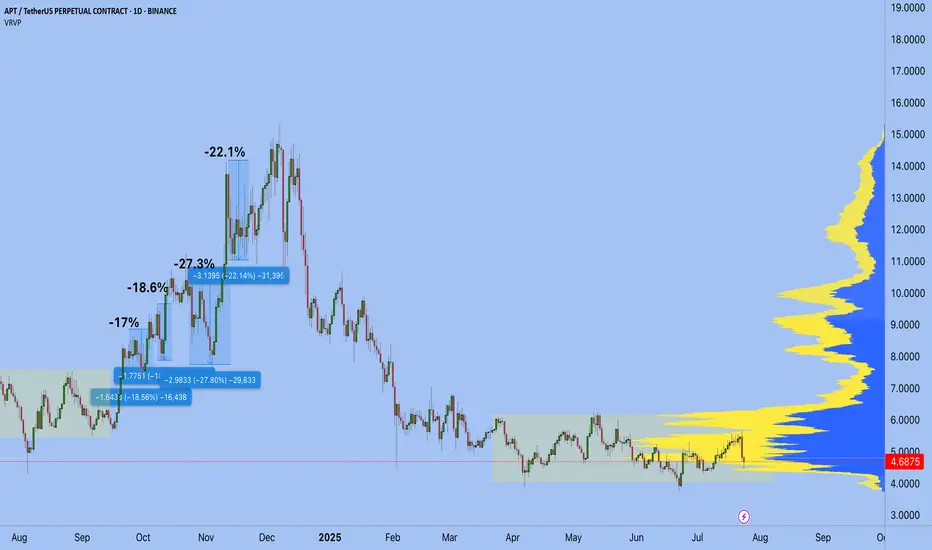
And one more thing, the most critical rule for the next two months. I AM BEGGING YOU, DO NOT OPEN SHORT POSITIONS. Any 15-25% correction on a strong project is not a reason to short; it is your buying opportunity. Measure from the peak, and you will see these entry points. The strongest projects will correct even less. This system works.
Of course, this doesn't mean blindly buying everything that's green. You need to understand the narratives. But if your project is old and showing weakness while others are flying, maybe it's time to switch to a leader. As a subscriber wrote in the comments of my last post: in the previous cycle, SUI did a 10x, while APTOS did a 4x. This clearly shows where the market's attention was focused, and consequently, where the results were.
Best regards EXCAVO
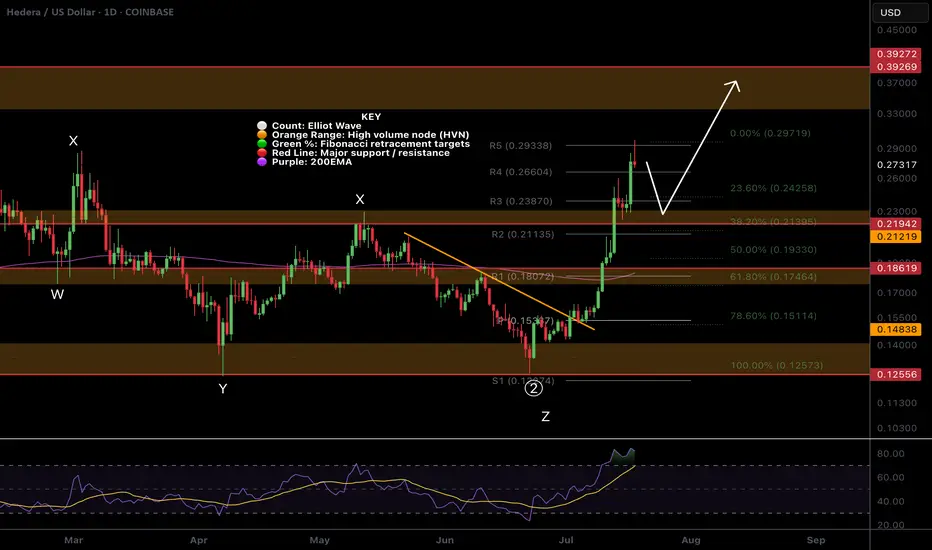
$HBAR Wave 4 finishing soon?CRYPTOCAP:HBAR Hedera appears to have completed wave 4 with the test of the High Volume Node support at the 0.382 Fibonacci retracement.
Wave 5 has an expected target of the High Volume Node resistance at $0.4 before a larger retracement in wave 2 aligning with my summer pump august / September dump view.
Analysis is invalidated below $0.1933 at the 0.5 Fib retracement and will be updated to a wave 2 instead of 4.
Safe trading

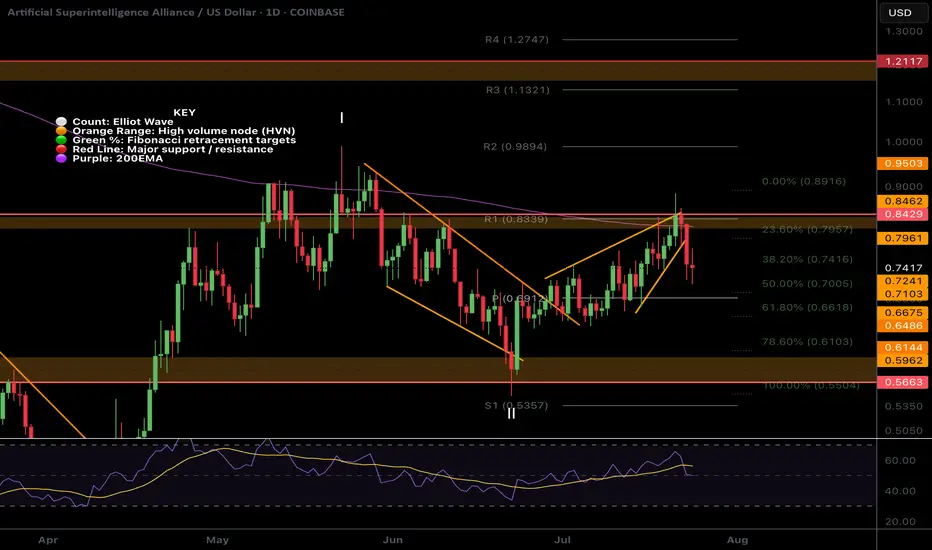
$FET local ending Diagonal and wave 2 near completion?NYSE:FET was rejected for the 4th time at the daily 200EMA! Each time the probability of a breakout increases.
I have adjusted the High Volume Nodes for accuracy.
Locally Fetch appears to have completed a motif wave up with an ending diagonal for wave 5. Wave 2 is expected to find support at the daily pivot and .618 Fibonacci retracement before attempting a breakout of the daily 200EMA once more.
A move below wave II will invalidate this analysis.
Safe trading
$ETH Hit Our Targets and was rejectedCRYPTOCAP:ETH hit our signal take profit target at $3820 and was rejected at the High Volume Node EQ to the penny.
That appears to have completed wave 3 of this motif wave. Wave 4 has an expected target of the R2 daily pivot and 0.236-0.382 Fibonacci retracement, $3260 before continuing to the upside in wave 5 with a target of the all time high.
This aligns with my views of a significant pullback at the end of August and September which is typical after a summer rally.
No divergences yet in daily RSI.
Safe trading

$AAVE Daily Hidden Bullish divergence?CRYPTOCAP:AAVE and alts begin their retracement Wednesday but is this a long term top or just local? Im betting we have a higher to go this summer..
Hidden daily bullish divergence is printing on RSI at the daily pivot and 0.5 Fibonacci retracement which should all act as strong support provided BTC doesn't dump.
The 'alt-coin golden pocket' Fibonacci retracement 0.786 sits at the descending daily 200EMA and High Volume Node support offering a secondary target for reversal and continued upside.
Losing this and closing below would flip me bearish until a new bullish signal emerges.
Safe trading.

4/ Altseason: Live -The Final game is in September. My plan Altszn Live #4: My <50% Win Rate, the Psychology of Missed Profits, and the Endgame in September. Start with 10k
Let's be brutally honest. Running a public trading experiment comes with immense psychological pressure. This isn't a game. It's real money, real nerves, and a real reputation on the line. The last 9 days have been tough; I hit a losing streak, and I want to show it to you, not hide it. Because trading isn't a non-stop party of green numbers. It's a marathon where your own psychology is both your greatest enemy and your greatest ally.
Section 1: Working on Myself. My System vs. Crowd Psychology
To be profitable in the long run, you have to be honest about your strengths and weaknesses. My weakness? My trade win rate is less than 50%. Yes, more than half of my positions do not close in profit.
My strength? I've developed one rule that allows me to stay profitable despite this win rate. This isn't some pretty quote; it's a hard-won system: "Hold your profitable positions for as long as possible, and close your losing positions as quickly as possible."
Now, look at the market. Most people do the exact opposite. They "marry" their losing positions for years, while a 20-30% profit is an irresistible temptation they must lock in immediately.
This leads to the pain of missed opportunities (FOMO). I went through this myself with $RSR. I was waiting to buy at 0.081. The price touched 0.083 and then flew to 10 cents without me. That feeling of the market leaving without you while you wait for the perfect correction is familiar to everyone. It's that burnout that causes you to make mistakes. But I've learned my lesson: there will be no deep corrections this season.
Section 2: Altseason in Full Swing. Where is the Money Flowing, and Where is the "Final Station"?
Altseason is already here. This isn't a guess; it's a fact. Billions of dollars in USDT and other stablecoins are pouring into the market right now. Bitcoin is at its highs. Ethereum is moving up aggressively, just as I've said in my previous posts. But the biggest potential isn't in them right now.
Money moves in waves in the market. You need to understand this to avoid getting on at the "final station":
1. First, Tier-1: Capital flows into BTC and ETH. (This phase is almost over).
2. Then, Tier-2: The flow shifts to large-cap projects (LINK, UNI, SOL, etc.). (Happening now).
3. Next, Tier-3 & Tier-4: Money moves into smaller, riskier altcoins. (Our main target).
4. The Finale - Memecoins: Euphoria, insane percentages, media headlines. When your grandmother asks you about Dogecoin — that's the "final station." It's time to get off the ship.
And we have a date. September 2025. For me, this is the deadline, after which I'm moving into stablecoins and waiting for major shifts in the global economy.
Section 3: My Hunt for "Green Flags" and the XETR:HEI Trade
How do you find that Tier-3 project in this chaos that could deliver massive returns? I look for "green flags." The main one is a rebranding. New tokenomics, a new chart, a new concept. It's a startup with a history.
It was precisely this principle that led me to XETR:HEI (formerly AMEX:LIT ). A small capitalization, a strong narrative, and a complete reset of old holders. The probability of such a project taking off is extremely high.
I'm managing this trade, from entry to exit, in real-time within my private channel. These aren't just signals; it's a demonstration of the system in action.
Conclusion & Call to Action
This public experiment is my personal challenge. I have one shot and only two months to show a result. I'm sharing everything: the wins and the losses. All proof of my trades is available on streaming platforms.
In the first post about Altseason, I invited you to join this journey, and the response was incredible. It brought many strong and mindful people into our community. Let's continue.
If you want to follow my trades in real-time, and ride this final wave of the altseason with me, write "Altseason " in the comments or in pm
And I have a question for you. Share your thoughts, your pain points, your projects. What's on your radar? And one more thing: would you want me to open a separate public account with $1000 and trade it in parallel for transparency? Let's discuss. I'm open to any suggestions.
Best regards EXCAVO
$SHIB Ready to Move?CRYPTOCAP:SHIB has printed confirmed weekly bullish divergence in RSI and is now attempting to overcome the weekly 200EMA resistance.
A High Volume Node lies just above but a close above this will signal a bullish trend ready to move the initial target of the weekly pivot point followed by the 0.0003579 High Volume Node.
Price completed its retracement to the 'alt-coin' golden pocket 0.786 Fibonacci retracement.
Bearish divergence is currently growing on the weekly RSI but will be diverted with a thrust high!
Is it MEME season? CRYPTOCAP:DOGE also looks ready to go!
Safe trading

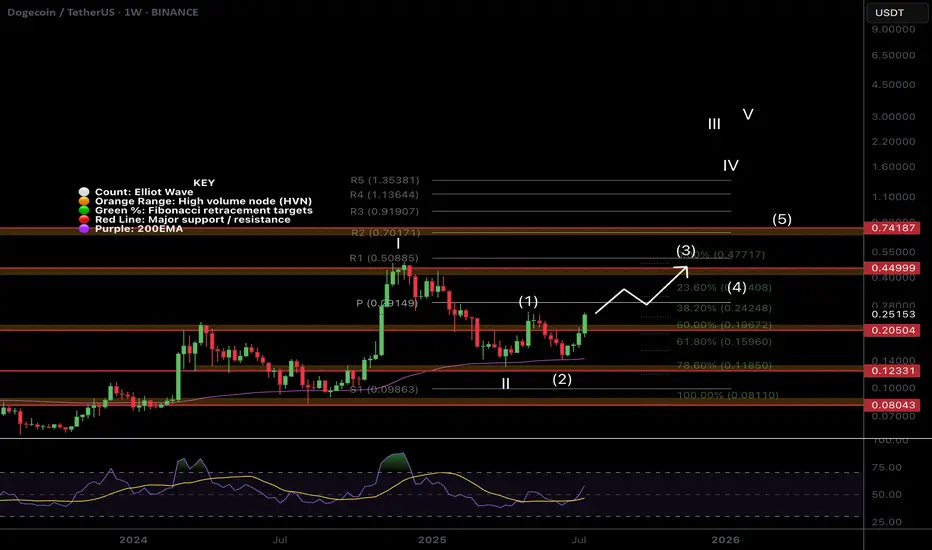
$DOGE Flipping to Bullish Structure!CRYPTOCAP:DOGE is coming to life after a second test of the weekly 200EMA as support and about to make a higher high, cementing in that higher low and flipping the macro structure bullish!
If the count is correct wave 3 of (III) should be powerful! The weekly pivot should put up a challenge as the first resistance before the High Volume Node at $0.45
Safe Trading
FET Secondary trend 19 07 2025Logarithm. Time frame 1 week for clarity.
Main trend is an ascending channel.
Secondary trend is a descending channel
Local trend is a Ross hook, at the median resistance. Reversal zone.
By the way, the trading idea from 2022 FET/BTC is still relevant. Pay attention to where the price is.
FET/BTC Main trend. Pump zone cycles . 2022 06

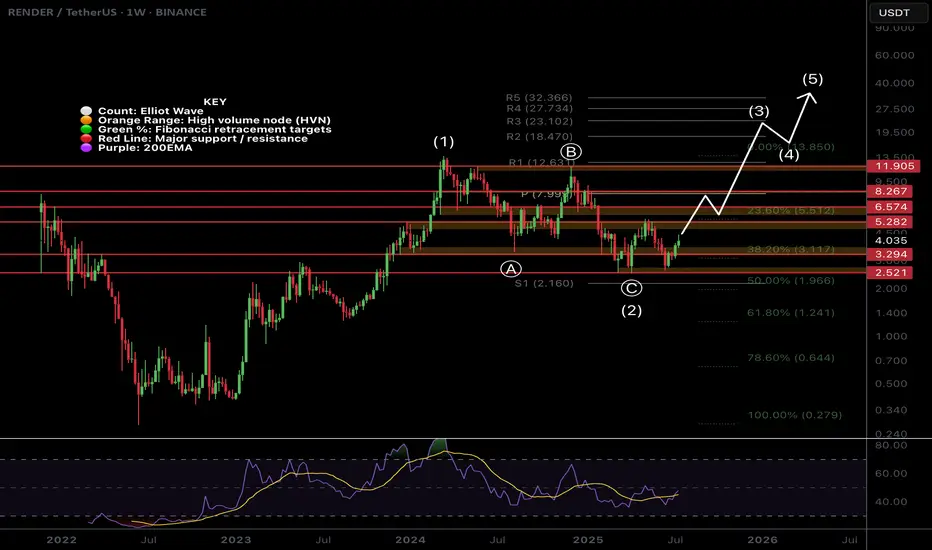
$RENDER Weekly Brings Clarity!CRYPTOCAP:RENDER weekly chart shows long term strength through the depth of the Fibonacci retracement not even reaching 0.5.
The depth of the recent swing low been so close wave (C) does concern me that the larger correction is not yet over and maybe price does want to visit the 'alt-coin' golden pocket of the 0.618-0.768 Fib retracement Where the would be a High Volume Node (not drawn).
For now the upside target is the weekly pivot but the local chart has a lot of work to do first with daily 200EMA!
Safe trading
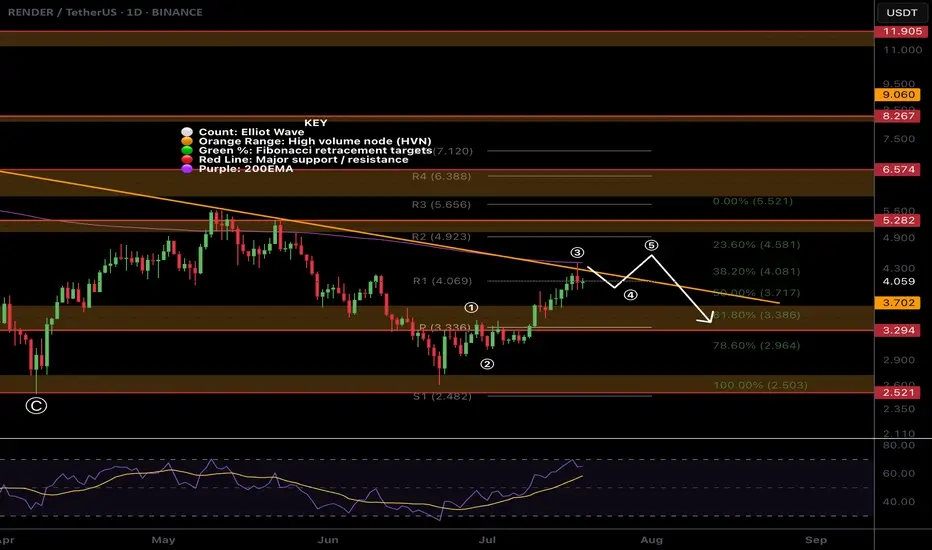
$RENDER At Major Resistance!CRYPTOCAP:RENDER has been relatively weak. Looking at the local chart it appears we have finished a wave (3) at the daily 200EMA and descending resistance.
Price has overcome the High Volume Node (HVN) support flipped resistance but a strong at coin pull could see fresh lows for Render.
There is also daily bearish divergence on the RSI.
The Elliot Wave count could also be an ABC corrective wave up which has now terminated.
If its a new motif wave and a major bottom has formed , wave 2 should find support at the HVN, daily pivot and 'alt-coin' golden pocket between 0.168 and 0.782 Fibonacci retracement
Safe trading
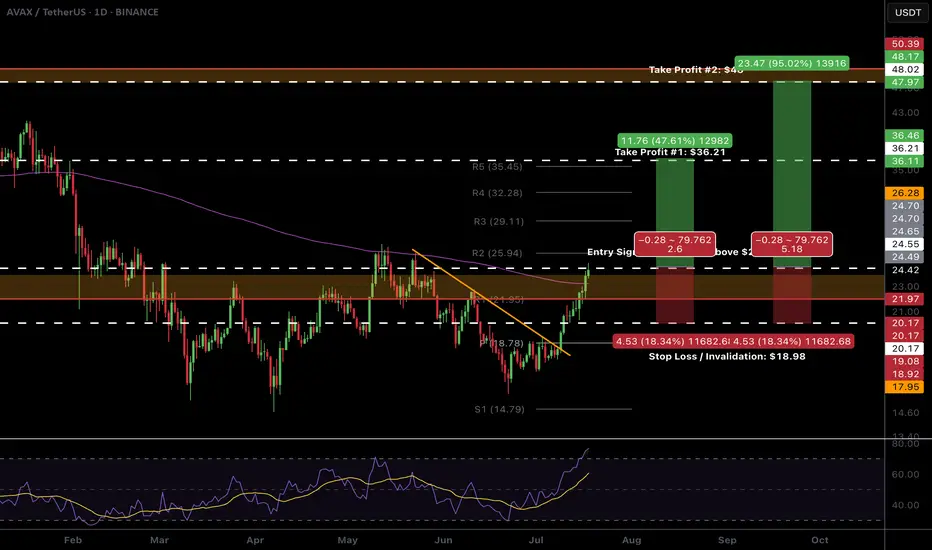
$AVAX Ready to breakout!CRYPTOCAP:AVAX looks ready to pop.
High Volume Node resistance and daily 200EMA is clear and now support. We don't want to see price rejected and moving back below this area.
The R5 daily pivot is my first partial take profit $35-36 followed by the major resistance High Volume Node at $48
Daily RSI is overbought with unconfirmed bearish divergence so watch out for this but should be good to run in the mean time. BTC permitting...
Safe trading
/3.5 The Winner's Psychology & The Hunt for Trade
Introduction: The Dangerous Time of Euphoria
I want to start by thanking you for the phenomenal support for the "Altseason: Live" experiment. We closed Round 1 with a +92% profit on the initial capital from just two trades.
But I need to be brutally honest with you: the most dangerous time is just beginning. Let's be clear: for these two months, I won't be chasing a conservative 3% per month. I will be trading quite aggressively.
That's why, in the coming weeks, you will see various coins "pump" without any logic. Your inner FOMO will be screaming at you: the feeling that you're late, you're in the wrong coin, you've missed out. In this frenzy, many will jump on a moving train. And my forecast remains: sometime around July 17th to 21st, the market will brutally shake out these passengers.
My Philosophy: The Battle with the Main Enemy—My Own Euphoria
After a huge win like +92% on the portfolio, it's very easy to get caught up in the "winner's high." A dangerous confidence appears, the feeling that you've figured out the market and that it will always be like this. This is a trap.
That is why I did something that might seem illogical: I cut my position size for the next trades by a factor of four.
Why? To tame that euphoria. To prove to myself that discipline is more important than elation. To remember that my win rate is not 100%, and a single losing trade on a wave of overconfidence can wipe out all the previous hard work. The most important thing is my inner calm.
Of course, when I talk about "calmness" in the context of futures, leverage, and altcoins, it sounds ridiculous. I get that. But striving for inner composure is the only shield a trader has.
My core principle remains unchanged: Fear losing more than you fear missing out on gains.
The Hunt for Leaders: My Methodology for Picking the Next Trade
Rebranding and New Tokenomics:
When a project undergoes a rebrand, it almost always means the team has a plan. The pressure from old sellers decreases, and the probability of a subsequent rally is high.
' Smart Money' Footprints (Accumulation):
This is my favorite pattern. Long periods of accumulation at certain levels, anomalous volumes, and candles with long wicks—all of this indicates that a major player has entered a position and is preparing for a breakout.
New Listings and Unique Patterns:
Projects recently listed on top exchanges don't have the "baggage" of disappointed holders. Over the years, I've noticed certain unique patterns in their charts that have a high probability of leading to growth.
The Art of the Entry: Hunting for the Entry Point
I try to enter positions with limit orders, and I always wait for a pullback. I look for an entry on a local correction when panic is shaking out the random passengers.
Hunt for your entry point. That is the most important thing.
The Golden Rule: Not a Single Step Without a Stop-Loss
Trading without a stop-loss is suicide. Accepting a small, planned loss is not a weakness but a part of the professional game.
What's Next?
I've already missed one coin I wanted to trade—it took off without me. I didn't chase it. Now, I am patiently waiting and searching for the next setup that meets ALL of my criteria.
The "Altseason: Live" experiment continues. You can watch everything in real-time on my streams. The hunt is on.
Thank you for your attention.
Best Regards EXCAVO
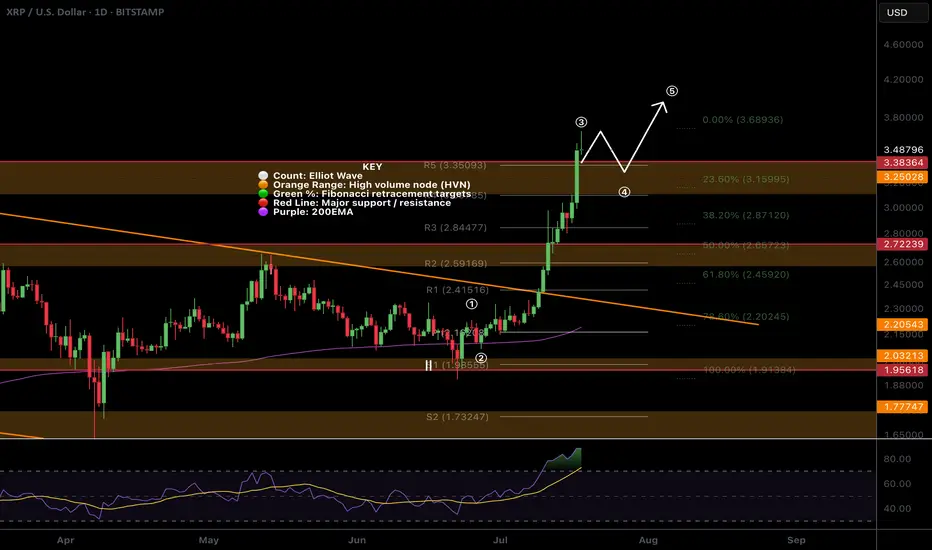
$XRP All time high! Time to sell or...?CRYPTOCAP:XRP appear to have completed wave 3 with a poke above all time high, typically this os behaviour of a wave 5.
The daily R5 pivot point has been breached so there is a significant chance of a decent pullback now but I wouldn't bet against the trend!
Wave 4 could be shallow, targeting the previous all time high, High Volume Node with waver 5 completing near $4.
Daily RSI is overbought but no bearish divergence yet which will likely emerge during wave 5.
Safe trading
$HBAR Pull Back Started, What is the target?CRYPTOCAP:HBAR doing extremely well, the R5 daily pivot point has been hit and a pull back should be expected before continuation!
It appears wave 3 is now complete and wav4 i expected to pull back to the 0.382 Fibonacci retracement which adds confluence to the High Volume Node in the same place at $0.22 our previous take profit #2 target.
Daily RSI is overbought but no bearish divergence yet! Price behaviour can often pop above the swing high just made to trap new buyers before dumping hard! Watch out for that, that would be the bearish divergence print also.
The next take profit is $0.39
Safe trading
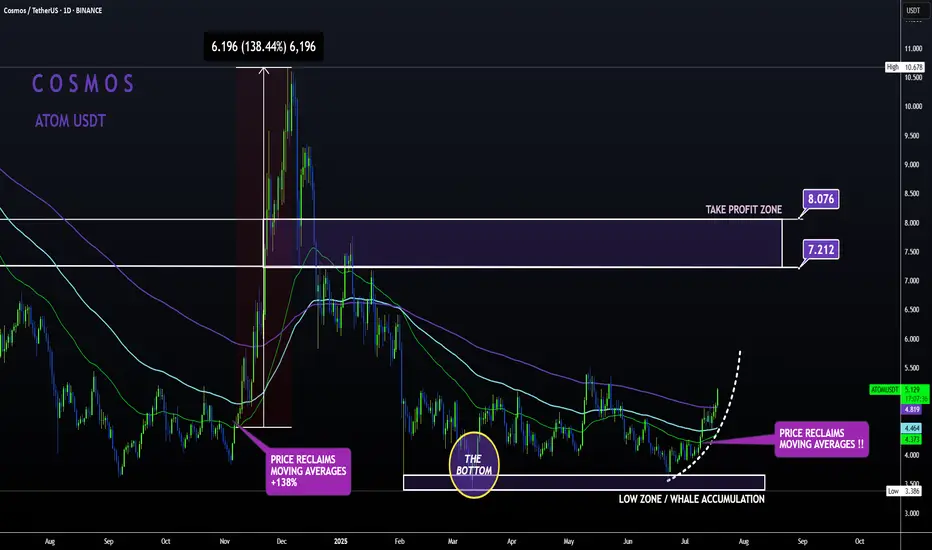
ATOM Sleeping GIANT ALT | Moving Averages BULLISH like NOV24'ATOM is slowly but surely making a turn up towards the first Take Profit point.
From the bottom, Cosmos has already increased a whopping 52% , with even more room to grow:
In my previous update, the 4 was still bearish when looking at trend lines and moving averages.
However, this has flipped to bullish from the 4h upward, with the price trading high above the moving averages in the 4h and in the daily timeframe:
4H:
Daily:
Note how previously, the big increases started as soon as the price regained the moving averages as support.
NCN (Neurochain AI) Main Trend 18 07 2025Logarithm. 3 days. Crypto project (imitation of utility) was made in autumn 2024 for local AI hype. Twitter 102 thousand subscribers. This is not enough... Reduction from the maximum pumping by -99%. It is rational to work according to the pump/dump strategy, in spot.
If a local alt season is launched, then I would recommend locally - medium urgently working with the % range (maximum) specified in the idea itself. This crypto imitation of usefulness is unlikely to survive until the big AI hype....
Currently, there are trades on 2 exchanges:
1) Gate
2) MEXC
For this group of assets as a whole. Collect assets where AI is at least somehow actually used (there are none of those), or are simply mentioned for hype (imitation of usefulness). Some assets will "die", most, if you hold them, will show a greater profit than assets of other groups.

OFFICIAL TRUMP Main trend. 16 05 2025Logarithm. Time frame 3 days. After a super pump and a drive of "stupid money", a descending channel was formed on a natural dump. The price came out of it. Now a triangle is forming. The price is clamped. The reversal zones and percentages to the key support/resistance levels are shown extremely accurately according to TA.
If there is no aggressive exit in the medium term, then there will be consolidation and, as a consequence, the formation of a horizontal channel "sholtai / chattai", its key zones are shown.
Now, this "cryptocurrency" is now on 16 05 2025 in 41st place by capitalization.
Reductions from the price highs are about -90%.
From the liquid zone about -84%.
These are not the minimum values of the decline of such hype cryptocurrencies. Just take this into account in your money management. For clarity, the level zones and the % of potential decline if the trend breaks again are shown on the chart (pull the chart down).
Even with such a decline, the price is now at a huge profit. I am not speaking for the creators of the cryptocurrency, but for the first speculators and "investors" who may not have sold everything on the hype.
For the creators of the cryptocurrency, perhaps these are manipulators close to the Trump family, for them, any sale is super profit. But in order to sell, you need to maintain liquidity, and from time to time make interest in speculation and asset retention by investors, that is, do pumps and hype. Use this, and do not be greedy...
Levels and zones, pump/dump, which the price will "feel" are shown in advance. Click "play" on the chart and move the chart up. With a high degree of probability, the hype and pumping of the price of this cryptocurrency will be repeated, given the hype and the long term of the political figure whose name this cryptocurrency bears. Now it is a Trump dump, in the future it will become a Trump pump for some time.
Do not forget to sell on the next hype. If you understand that you are very greedy, and the news background affects you, then sell in parts, or use stop losses to protect profits.
There is no need to guess the minimums and maximums. It is important to know these zones, and have an acceptable average price, from the position of the trend, and its potential. It is regulated by the distributed entry volume (in advance) at potential reversal zones.

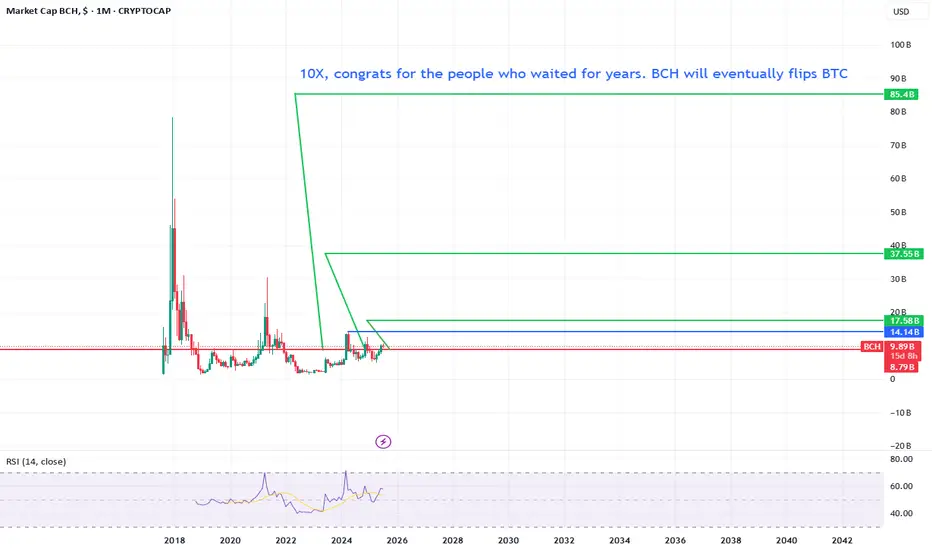
Bitcoin Cash will do a solid 10X For years bitcoin cash is been selling off.
But let me tell you this, we are just getting started.
If we pass the blue line we are officially triggered for a 85 billion marketcap.
Can still take some time but eventually it will happen. Make sure to fomo in when the party is starting!
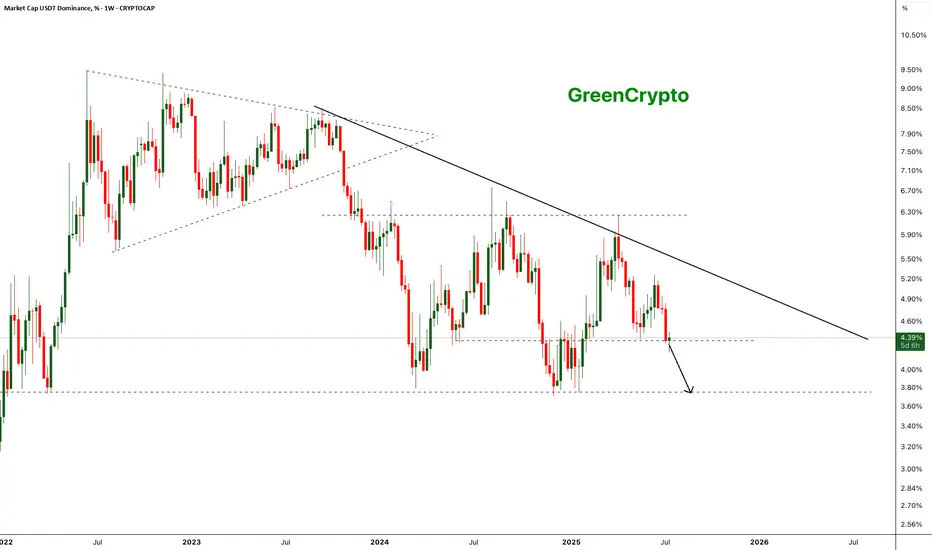
Bearish Breakdown in USDT Dominance - Altseason Loading?The chart shows a clear long-term descending trendline acting as resistance since mid-2023. After multiple failed attempts to break this trendline, USDT dominance has broken below a key horizontal support around ~4.35% on strong bearish momentum.
- Weekly close below the ~4.35% horizontal support.
Next key support zone: ~3.65–3.70% (marked by previous 2023 lows).
- Strong bearish engulfing candle confirming breakdown.
- Bearish continuation expected if dominance remains below 4.35%.
Further drop of the usdt dominance will start the altseason
Cheers
GreenCrypto
$XRP All Tie High After Shallow Pullback?CRYPTOCAP:XRP had a fantastic week smashing all resistances. I am looking for a shallow pull back to test the High Volume Node support at $2.7 at the .236 Fibonacci retracement before continuing to challenge the all time high.
Wave (3) of a motif wave appears complete adding confluence to a shallow retracement for wave (4).
Daily RSI is extremely overbought.
Safe trading
