$HUT Clear for Further Upside?NASDAQ:HUT is having a great time clearing resistances, the weekly 200EMA and the weekly Pivot point did not prove challenging.
It is currently sitting in a High Volume Node (HVN) where price is likely to reject and retest the weekly pivot as support before continuing upwards towards $32 and beyond in wave 3.
Wave 2 tested the 'alt-coin' golden pocket between 0.618-0.782 Fibonacci retracement giving me confidence in the count.
Safe trading
ALT

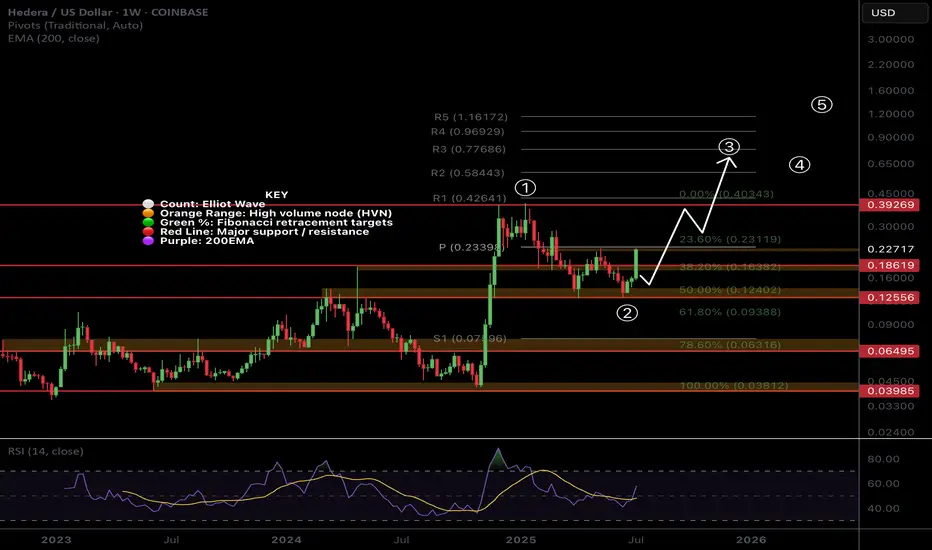
$HBAR Weekly Pivot Time...In classic CRYPTOCAP:HBAR fashion what a powerful move this week! Moves like this leave me skeptical of continuation straight away as you often get a pretty decent pullback afterwards before the next leg up. However how many times have you seen a move like this that completely unwinds weeks later and goes lower?
Wave (3) looks truly underway after wave (2) tested the High Volume Node and 'Golden Pocket' 0.50.618 Fibonacci retracement as support on weekly bullish divergence from the RSI.
The weekly pivot is now resistance and it already proving itself. If price continues the all time high is next resistance and price has a weekly R5 pivot target of $1.2 while the Fibonacci extension targets have a minimum of $5.2..
Analysis is invalidated below $0.12
Safe trading

$FET Does Zooming out look better?NYSE:FET has been underperforming lately and the local chart looks trash so I wanted to zoom out to give us all some context on the larger picture which hasn't really changed.
Price appears to have completed wave II at the High Volume Node (HVN) support and 0.5- 0.618 'Golden Pocket' Fibonacci retracement and wave 3 is underway but finding local resistance.
Pivots are warped due to the strength of the move last year so wouldn't count them as reliable so focusing on support and resistance. The megaphone pattern is clear and the next area of resistance when FET starts moving is the $1.2
Weekly RSI is decreasing and is attempting to cross bearishly. If Bitcoin has a significant pullback I would expect new lows for FET at this rate. I have a neutral stance at this point.
Analysis is invalidated below $0.546
Safe trading

$ETH Pullback to $2630 Support?CRYPTOCAP:ETH has a great week pushing through resistance and making new local highs after testing the daily 200EMA and daily pivot as support.
Price is likely to retest the swing high and previous resistance as support around $2600-2700, also the .382 Fibonacci retracement.
RSI is printing daily bearish divergence in overbought from the wave (3) top to current as it did at the wave (5) top seeing large rejection. The retest of $2600 would reset RSI.
Price is ultimately set to test $3600 as the next resistance if the Elliot wave count is correct.
Analysis is invalidated below $2050
Safe trading

$AAVE Macro outlook Grinding the PathCRYPTOCAP:AAVE continues to grind higher poking above the swing high which was rejected to test the weekly pivot and .382 Fibonacci retracement as support successfully. This was a shallow wave 2 so I am expecting a big thrust up in wave 3. However, the alternative count could suggest a wave is only completing now with wave 2 actually being wave (4) of 1, this would be the case if price falls back below $171.
Weekly RSI is still bullish with plenty of room to rise ahead of it. It printed a weekly bullish divergence at the wave II low and major support high volume node.
AAVE is definitely one too watch this cycle.
Safe trading

ALTUSDT Forming Potential BreakoutALTUSDT is shaping up to be an interesting opportunity for crypto traders watching for potential breakout plays. The pair has recently tested a strong horizontal support zone multiple times, forming a solid base around that level. This accumulation range is a key area where buyers seem to step in aggressively, suggesting that a bounce and a trend reversal could be on the horizon. The technical outlook points toward a projected gain of around 90% to 100%+, which could attract more traders looking for high risk-to-reward setups in the altcoin market.
The trading volume remains healthy on ALTUSDT, confirming that there’s good liquidity and market participation to fuel a potential rally. When volume supports the price action like this, it generally adds strength to the bullish case. Many traders keep an eye on such setups because once the price breaks out from the consolidation phase, it often does so with momentum that can yield quick returns. The chart also shows early signs of a move upward with bullish candles forming off the support zone.
Investors are increasingly taking interest in the project behind ALTUSDT, drawn not just by its technical potential but by the community sentiment and developmental updates. This is critical because strong fundamentals combined with a bullish technical pattern can create the perfect storm for a powerful price surge. As the crypto market enters a more optimistic phase, coins like ALTUSDT could see amplified moves as traders look to rotate capital into promising altcoins with clear breakout setups.
✅ Show your support by hitting the like button and
✅ Leaving a comment below! (What is You opinion about this Coin)
Your feedback and engagement keep me inspired to share more insightful market analysis with y

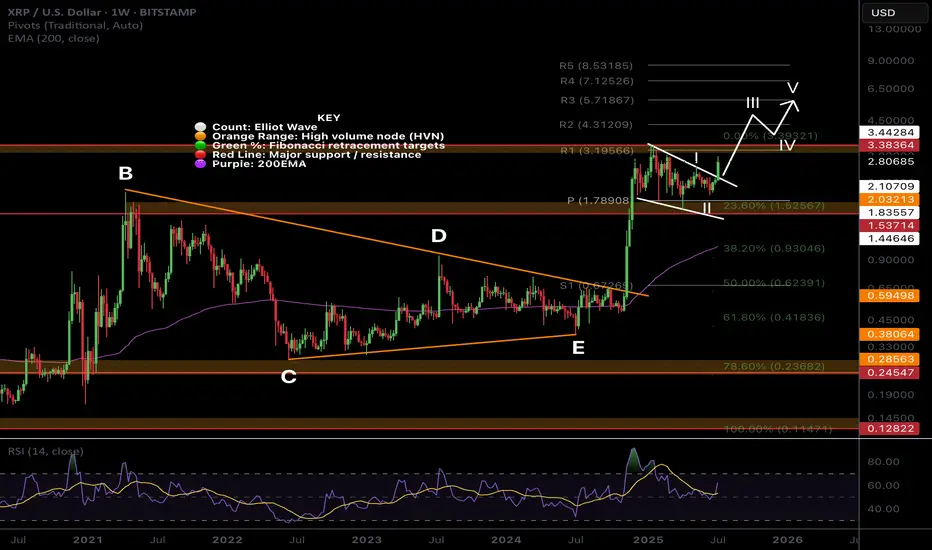
$XRP Macro Tiangle Final Thrust ContinuationCRYPTOCAP:XRP completed a macro triangle pattern last year. Triangles proceed a terminal motif wave which already completed a wave 3.
Wave (3) of (5) is underway with a terminal target around $5.7 after price broke out of the pennant / wedge pattern.
Weekly RSI confirmed bullish divergence.
Safe trading
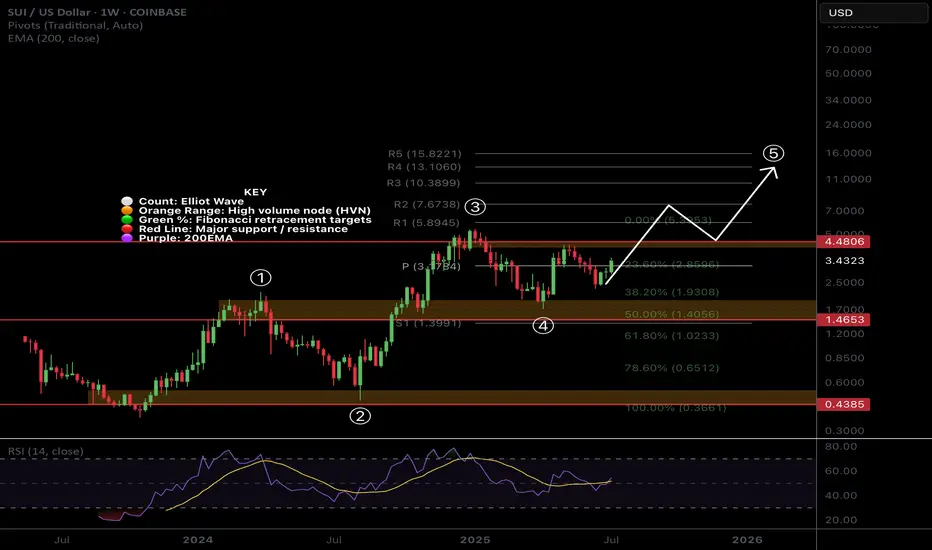
$SUI Wave 3 to Continue with a Strong Weekly CloseCRYPTOCAP:SUI printed a great weekly candle that will be closing today above the weekly pivot point with RSI trying to flip bullishly.
Price found support at 0.5 Fibonacci retracement and High Volume Node.
Wave 4 penetrated wave 1 which we potentially have a ending or leading diagonal Elliot Wave count limiting the potential upside with my current terminal target being around $10-13. Wave 4 could also actually be another wave 2 which would give us ridiculous targets but this is my preferred count for now.
Safe trading
$HBAR Shooting Up in Wave 3CRYPTOCAP:HBAR is flying off the High Volume Node and 0.5 Fibonacci retracement with Elliot wave 3 characteristics keeping the count alive.
Price is testing the weekly pivot point which should act as resistance for the time being but a break straight through will demonstrate a very bullish trend. Traders should be cautious about entering here.
RSI confirmed a weekly bullish divergence
Safe Trading
$ETH clear for an impulsive move to $3600?CRYPTOCAP:ETH has slowly but surely cleared resistance, with just the swing high to tackle which will activate another trade signal in my Trade Signals Substack.
Major support High Volume Node, daily pivot and daily 200 EMA proved tough support and demand continues to come in.
ETFs had an astonishing amount of inflows yesterday at $200M+
Analysis is invalidated below $2100
Safe trading

$HBAR Resistance at daily 200EMA!CRYPTOCAP:HBAR analysis continues to play out but should consolidate for a while before moving to the next target at $0.22.
This area should be tough resistance as its the daily 200EMA and major High Volume Node resistance and R1 daily pivot.
The CRYPTOCAP:HBAR signal has now hit take profit #1 from my Trade Signals Substack posted last week.
Safe trading

$SUI Big Breakout Happening?CRYPTOCAP:SUI is smashing above triple resistance: a major High Volume Node , daily 200EMA and the daily pivot. The signal I posted in my trading signals Substack is now live, and the HBAR one is about to hit take profit 1.
Target for this rally remains $4.2 High Volume Node near the swing high.
Analysis is invalidated below the daily pivot at $2.8
Safe trading

$XRP Bias Change: Bullish Elliot Wave CountCRYPTOCAP:XRP is breaking out the descending resistance causing me to take another look at my WXYXZ corrective Eliot Wave count expecting lower. I have adjusted the count to WXY and a 1-2 new motif wave with a target of $3.8
Price is well above the daily 200EMA and daily pivot after testing both as support including the High Volume Node. Closing above the descending resistance today will be a bullish signal but a retest of that resistance as support before continuing onwards its what to look out for.
Analysis is invalidated below $1.8
Safe Trading

$SUI Gearing Up to Break Triple Resistance?CRYPTOCAP:SUI is consolidating under resistance which often leads to a breakthrough but can take some time.
Price is sat above the daily pivot after breaking the downward trend resistance, but still under the daily 200 EMA and High Volume Node resistance. A pop above $3.09 swing high would be a bullish signal to long towards a first target of $4.2 High Volume Node.
Analysis is invalidated with a move below $2.7, leaving heavy resistance still ahead.
Safe trading

$AAVE Ready to Pop?EURONEXT:AAVE long signal is now active.
Price is still well above the daily pivot and daily 200EMA showing a strong local trend.
I am still expecting a decent move to test the all time high, High Volume Node at $460.
Safe trading

$FET Ready for the next move up?NYSE:FET looks ready for the next move up with a similar analysis to many other alts I have shared.
It is breaking out of descending resistance after testing the .618 Fibonacci retracement and High Volume Node (HVN) as support. Price broke above the daily pivot and is now swinging below, a recovery above the local swing high will be a bullish signal to go long with a wave 3 target of the R3 daily pivot and major resistance HVN at $1.13.
Analysis is invalidated below $0.54
Safe trading

$HBAR Ready for a move up?CRYPTOCAP:HBAR appears to have completed its wave 2 WXYXZ complex correction
It has broken its descending resistance & daily pivot, retested both as support and is approaching the local swing high which would be a bullish long signal.
Cautious traders may want to take partial take profit at the first resistance High Volume Node and R1 pivot $.18 and a secondary target with good RR is the swing high resistance node at $0.22.
Analysis is invalidated below $.14 swing low.
Safe trading

$ETH Breakout this week?CRYPTOCAP:ETH local chart looks ready
I think were looking at a decent ETH breakout this week to the next resistance High Volume Node at $3600 minimum target.
👉 BTC is consolidating under all time high resistance after multiple tests which is usual a sign of bullish continuation. Usualy giving alts room to room.
👉 Ethereum is above the daily 200EMA, daily pivot and also consolidating under resistance once more after testing the 0.382 Fibonacci retracement and S1 daily pivot adding confluence to that being the local bottom. This appears to be Elliot wave 2, a shallow wave 2 retracement (less than 0.5) is a show of strength and investor impatience.
Analysis invalidated below the daily pivot and daily 200EMA as this will lock in 3 waves up and look corrective.
Safe trading

$NEAR Disappointing so far...CBOE:NEAR is disappointing me as it continues towards the lows
Testing the .786 alt-coin golden pocket High Volume Node so should see a decent reaction from here as it appears a an ABC correction is complete after an Elliot wave motif wave.
Safe trading

$AAVE Going Through a Major Bullish Trend Shift!CRYPTOCAP:AAVE continues to outperform on pumps and retracements this cycle after being beaten down for many years!
Price consolidated below the weekly pivot and found support, only retracing to the .618 Fibs.
Wave 3 of iii pf a new Elliot Motif Wave looks well underway with the next price target being the R1 weekly pivot High Volume Node at $448.
Long term outlooks is very bullish for AAVE with a terminal target of the R5 weekly pivot £1155
Safe trading

$ETH Wave 3 of 3 Underway?CRYPTOCAP:ETH is back into the range EQ as alt coins pump on the back of CRYPTOCAP:BTC breakout
Price caught a strong bid after testing quadruple support: the major High Volume Node (HVN), daily 200EMA, 0.5 Fibonacci Retracement and daily S1 Pivot. Last week I posted about this area holding to kick off wave 3.
There is still work to do to overcome the recent swing high at HVN major resistance but things are certainly looking bullish. The daily pivot point sits at $3150 as the next target.
Long term terminal target for wave 3 is still the R4 daily pivot at $7340, I don't expect the terminal wave 5 to extend much beyond this, perhaps a wick above to trap retail at the top with a lot of media hype attached.
Analysis is invalidated if we fall below wave (2) swing low $2050.
Safe trading

SOL Ready To Breakout?SOL had a decent move this weekend overcoming descending resistance and now testing as support.
Price appears to have a completed a wave (2) at the .618 Fibonacci retracement and S1 daily pivot and a larger degree wave 2 at the channel bottom, High Volume Node support and .618 Fibonacci retracement.
If a wave (3) of 3 is underway then we should expect a strong move sooner rather than later with an initial target of the swing high resistance a/ R2 daily pivot $208-$216 range
Safe trading.

SUI Wave 3 of 3 Started?SUI appears to have completed a local wave (2) at the .618 Fibonacci retracement and a larger degree wave 2 at the alt-coin golden pocket between .618-.782
Triple resistance looms ahead of the daily 200EMA, major resistance High Volume Node and descending resistance trend line.
A breakthrough and close above will be a bullish sign with an initial target of the December swing high range $4.48
Analysis is invalidated below the $2.5 swing low, locking in ABC correction instead.
The bullish case is in jeopardy below $2.29 swing low.
Safe trading
