ALT

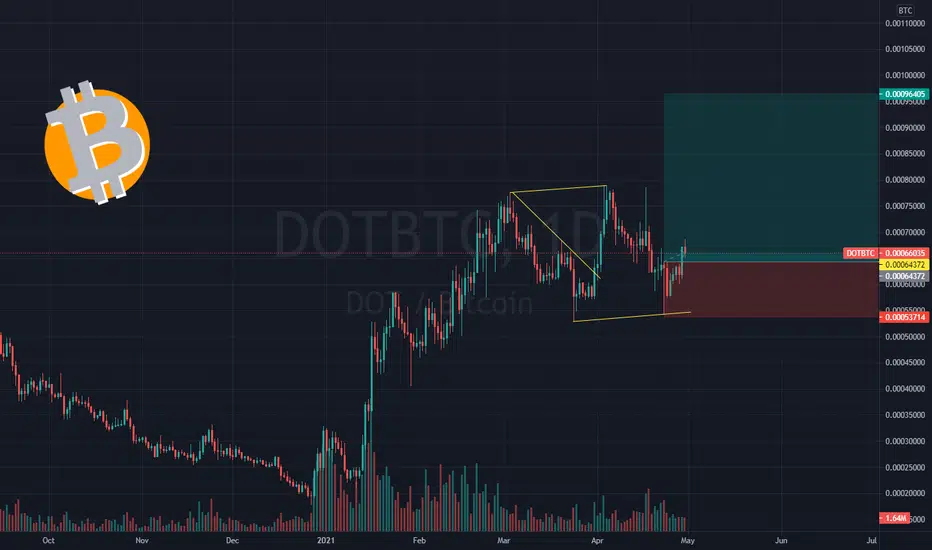


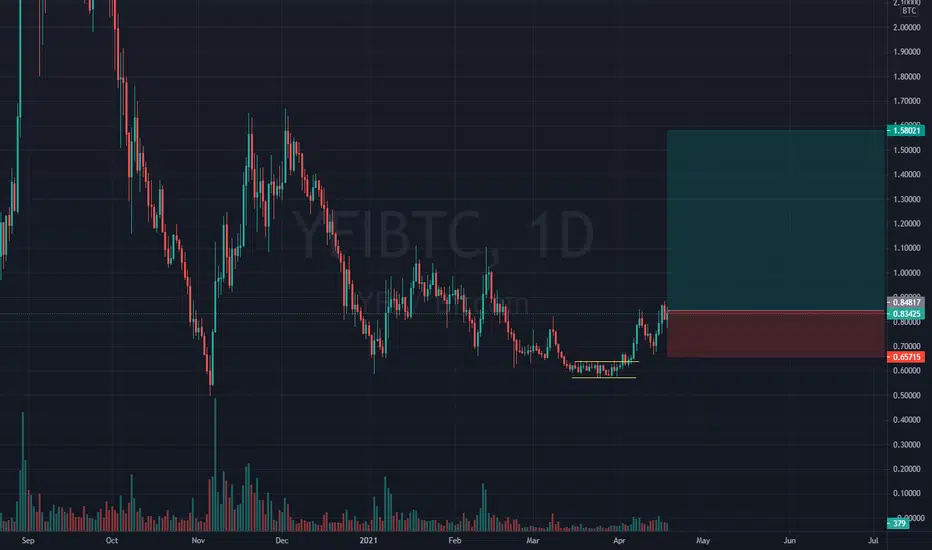
Huge Profit PotentialThis trade is going to be huge on the upside in the end and might already be starting. We may get one more wave down though so don't get freaked out if that happens. That fib suport of 0.618-0.65 should act as really good support. So if THAT fails, then maybe something's wrong with the count.
Honestly super happy with this chart pattern.
If this doesn't work out I'll have to hang up my hat.
Not financial advice. Let's call it a really really big hunch.

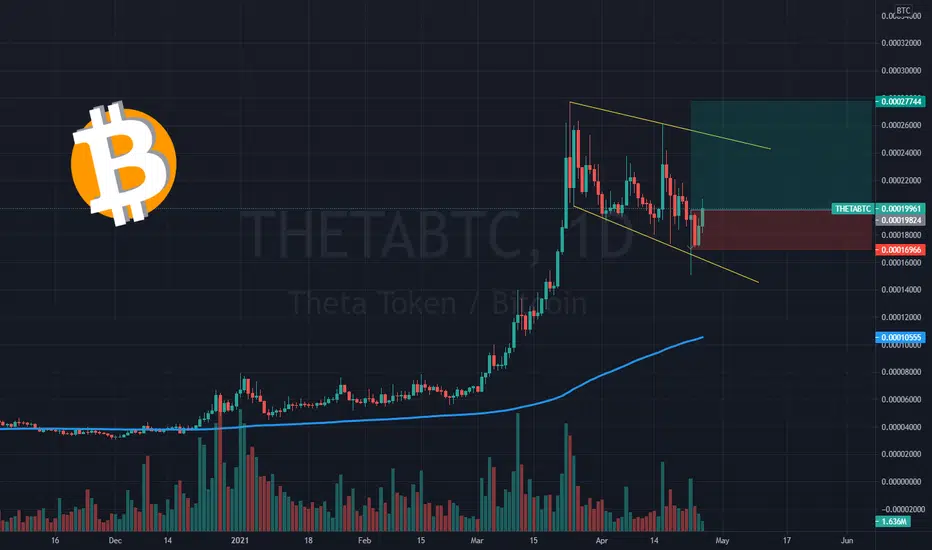
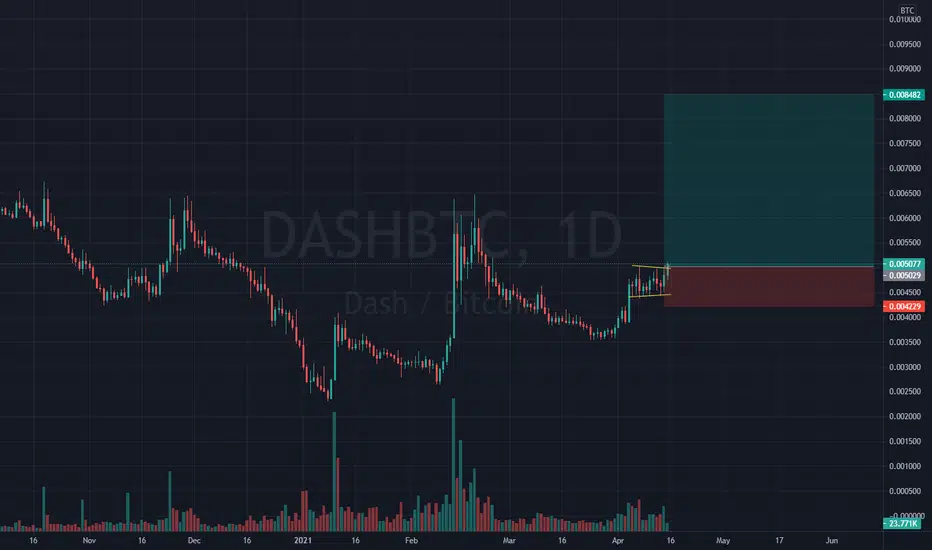
Long Term Perspective.A break into the $5.50-$6 dollar range is a major buy signal.
This think could explode like BNB.
They have already hooked up with VISA, Mastercard, Apple Pay, and Google Pay. They are going to push this card out all over. I want one for sure.
This could be a dream maker, Fingers Crossed!
Not financial advice.

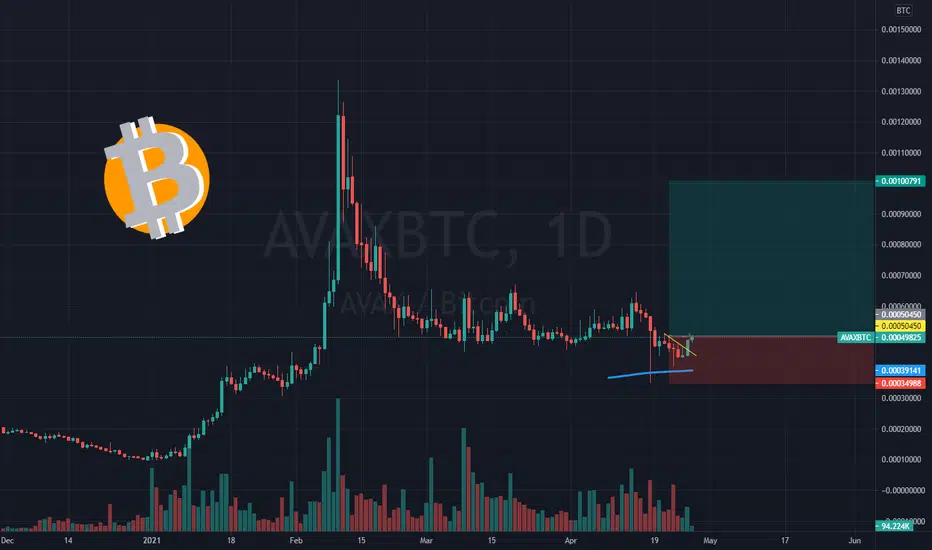
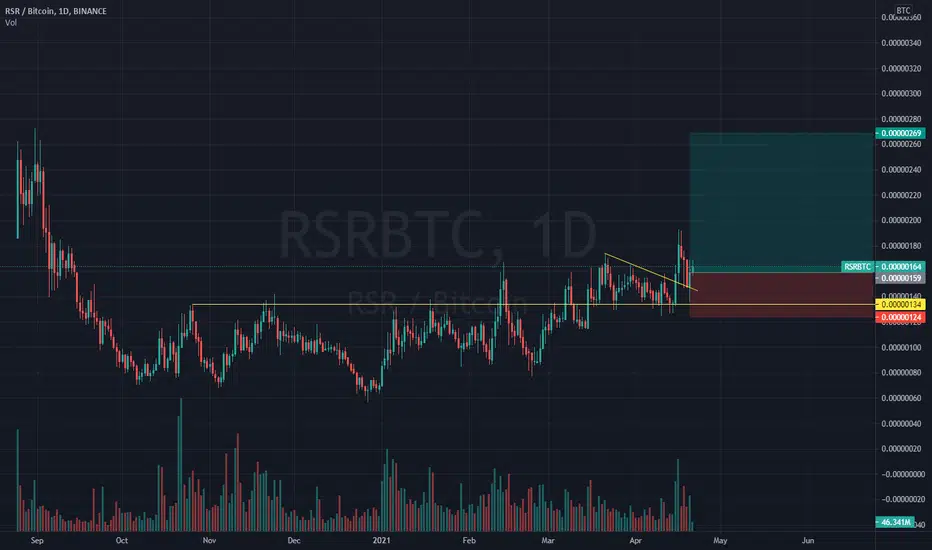
BUY Signal!ABC pullback has completed and we are breaking out to the upside!!
SEND IT!!!
Do not overlook this one. could be a +10 +20 bagger!
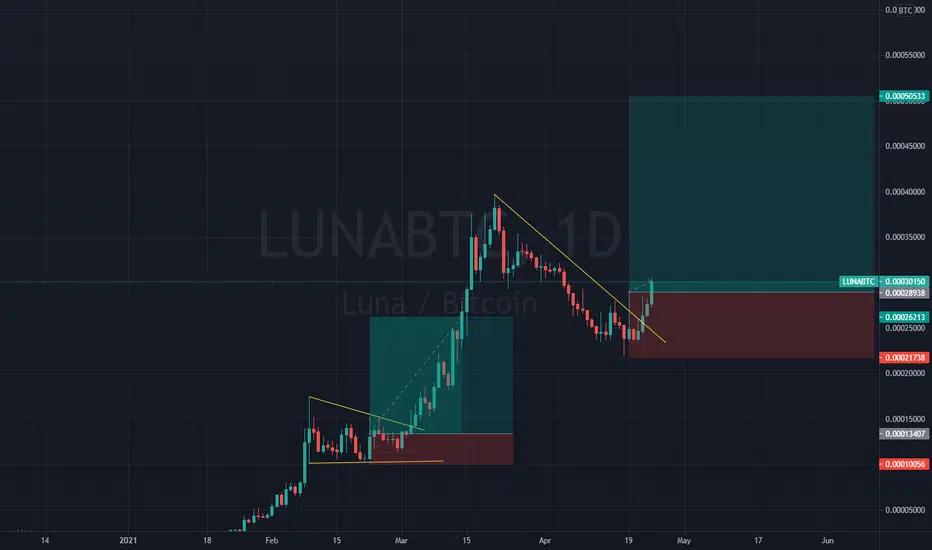
When I look at the long term chart this thing looks like it wants to freaking go!! Just what I'm seeing though.
