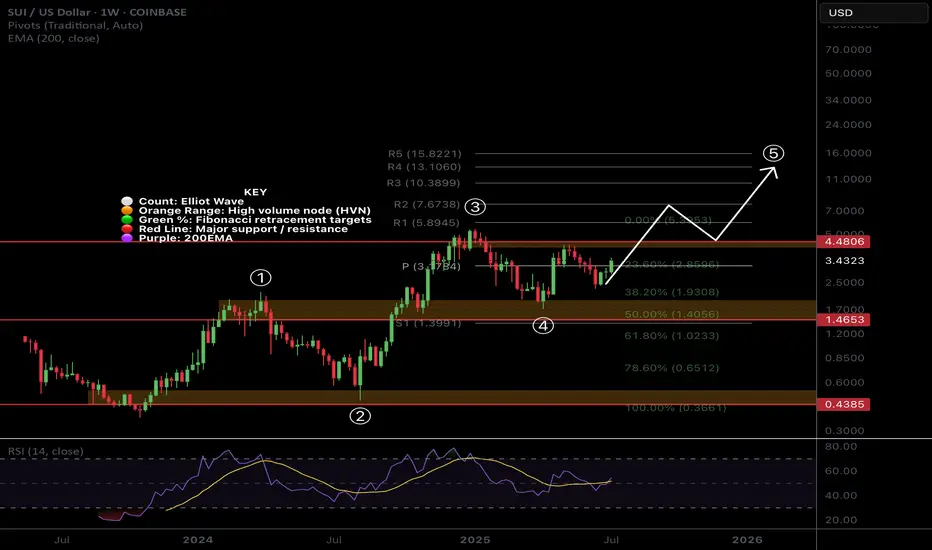
$SUI Wave 3 to Continue with a Strong Weekly CloseCRYPTOCAP:SUI printed a great weekly candle that will be closing today above the weekly pivot point with RSI trying to flip bullishly.
Price found support at 0.5 Fibonacci retracement and High Volume Node.
Wave 4 penetrated wave 1 which we potentially have a ending or leading diagonal Elliot Wave count limiting the potential upside with my current terminal target being around $10-13. Wave 4 could also actually be another wave 2 which would give us ridiculous targets but this is my preferred count for now.
Safe trading
Altcoin
SEI - One More Bullish Impulse Soon!Hello TradingView Family / Fellow Traders. This is Richard, also known as theSignalyst.
📈After surging by over 75% last week , SEI is currently in a correction phase.
However, it is approaching the intersection of the previous high marked in orange and blue trendline acting as a non-horizontal support.
📚 As per my trading style:
As #SEI approaches the blue circle zone, I will be looking for bullish reversal setups (like a double bottom pattern, trendline break , and so on...)
📚 Always follow your trading plan regarding entry, risk management, and trade management.
Good luck!
All Strategies Are Good; If Managed Properly!
~Rich


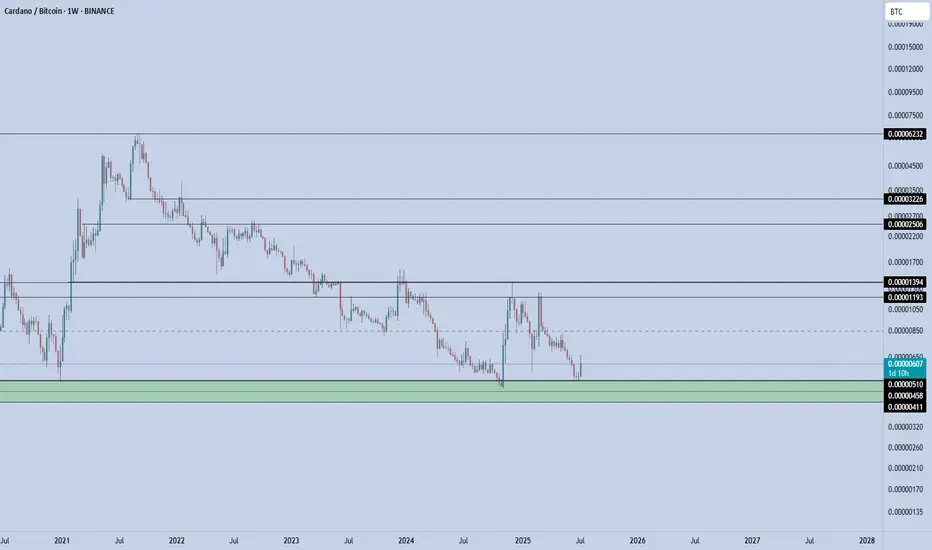
ADABTC – Long-Term Demand ZoneThe green box is a multi-year demand zone, tested multiple times, with each test producing strong upward moves.
Current structure aligns with previous cycle bottoms.
If BTC dominance stalls or rotates, alt/BTC pairs like ADA/BTC could rotate sharply upward.
📌 Risk Management:
A weekly close below 0.0000450 invalidates the long thesis. Until then, the risk-reward favors accumulation.
If market conditions align, ADA could be preparing for one of its classic ratio expansions — especially if Bitcoin cools and capital rotates into majors.
BTC – Bullish Continuation Ahead ?Bitcoin has been trading within a well-defined rising channel since mid-2023, respecting both upper and lower bounds beautifully.
After each impulsive move, we’ve seen healthy corrections followed by bullish continuations — a classic market structure in play.
🟦 Accumulation Zone: After a long accumulation phase, BTC kicked off a strong bullish cycle.
🟥 Correction Phases: Each major move was followed by a red correction zone before resuming the uptrend.
🟧 Current Phase: BTC is consolidating just below the upper channel boundary. A breakout above this zone could confirm the next bullish wave toward $140K+.
🔵 Key Observations:
Structure remains intact within the channel
Previous breakout zones now acting as support (blue arrows)
Continuation patterns are forming, signaling potential upside
🏹As long as the orange zone holds, BTC remains in a bullish structure, and a breakout would likely push us to new highs.
📍Will history repeat and BTC continue its journey toward the upper channel boundary? Let’s wait for confirmation!
💬 What’s your bias here? Are you bullish or waiting for a deeper pullback?
📚 Always follow your trading plan regarding entry, risk management, and trade management.
Good luck!
All Strategies Are Good; If Managed Properly!
~Richard Nasr

HolderStat┆SOLUSD above the $158 levelBYBIT:SOLUSDT broke through the $158 consolidation resistance following a strong triangle breakout. This confirmation shift puts the $180 resistance level within reach. The market structure continues to print higher lows, suggesting an ongoing bullish trend.

DeGRAM | SUIUSD got out of the channel📊 Technical Analysis
● Price pierced the four-week falling-channel roof and the apex of a contracting triangle, turning 2.88 support into a launchpad and carving a sequence of higher lows.
● Breakout measured move and channel mid-band converge at 3.15; a close above there exposes the next horizontal barrier and channel top at 3.46. Risk is framed by the former triangle base at 2.88 and major swing floor 2.69.
💡 Fundamental Analysis
● Sui’s on-chain TVL has climbed >15 % since 25 Jun after zkLogin main-net rollout and Mysten Labs’ new developer grants, underpinning demand despite broad market lethargy.
✨ Summary
Long 2.90-3.05; hold above 3.15 targets 3.46. Invalidate on a 4 h close below 2.88.
-------------------
Share your opinion in the comments and support the idea with a like. Thanks for your support!

Altcoins Market Cap: We on the Verge of a 5T Exposion!Hey crypto traders! Let’s dive into this monthly chart of the Altcoins Market Cap. You won’t believe what’s brewing!
We’re currently approaching a critical channel support at 200B, a level that might act as a springboard for massive rally — check out the jumps from channel support in 2019 and 2023! Each time the market cap hit this support, it skyrocketed, and now we’re at that pivotal moment again.
The chart projects a jaw-dropping target of $5T within the next 24 months if history repeats itself!
The price action shows we’re testing the lower boundary of this ascending channel, with the market cap sitting around 239.65B. A bounce here could send altcoins on a parabolic run, potentially hitting 5T by mid-2026. But if support fails, we might see a dip toward 100B — let’s keep an eye out!
Key Levels to Watch:
Support: 175B (channel support)
Resistance: 1.55T, 5T (projected target)
Breakdown Risk: 100B
Are altcoins about to explode to 5T, or will we see a deeper correction? Drop your thoughts below!
PS take a look at others vs. btc price action here:

XRP - Wait For It!Hello TradingView Family / Fellow Traders. This is Richard, also known as theSignalyst.
📈 Is history repeating itself? 🤔
XRP is now back at the $1.75–$2 support zone and forming a fresh inverse head and shoulders pattern.
As long as this support holds, we’ll be on the lookout for new long opportunities. 🟢
For the bulls to take over in the short term, a break above the green neckline is needed.
And for long-term control, a break above the red structure is essential. 🔺
For now, we wait patiently! ⏳
📚 Always follow your trading plan regarding entry, risk management, and trade management.
Good luck!
All Strategies Are Good; If Managed Properly!
~Rich

SUI - Channel Structure
SUI just printed a powerful +12.95% daily move, bouncing cleanly from the mid-range of its long-term ascending channel. This structure has been respected since mid-2023, guiding both impulse legs and corrective phases with precision.
Now trading around $3.47, the next logical magnet is the channel top near $5, especially if momentum persists and market sentiment remains risk-on.
Technical Structure:
Bullish trend within a well-defined ascending channel
Clean reaction from dynamic support (midline)
Clear higher low + breakout structure in play
Upside Target:
$5 (channel resistance)
As long as SUI holds above the rising midline (~$2.80 area), this setup remains valid for trend continuation toward the upper range.
📌 Risk Management:
Break below the midline flips the bias short-term. Until then, trend = friend.

SAND – Rotation in PlaySAND is showing early signs of strength off the long-term demand zone near $0.23–0.24, where it's been accumulating for several months. Price just printed a strong weekly bounce, up +16%, reclaiming the bottom of the range.
This area has acted as a key base since mid-2023 — with each touch producing a notable reaction. Now trading at $0.286, SAND is attempting to rotate toward the top of the established range.
Key Levels
Support (Range Low): $0.23–0.24 (strong demand zone)
Resistance (Mid-Range): $0.43
Range High: $0.85
A clean flip of the mid-range ($0.43) could open the door to test $0.70+.
📌 Risk management: A break and weekly close below $0.23 invalidates this setup. As long as it holds, the upside potential is attractive from a risk/reward standpoint.
This is a classic accumulation > reclaim > expansion structure. Let the chart speak if the range holds, the rotation is in play.

HolderStat┆SOLUSD held the support lineOKX:SOLUSDT is consolidating above 147.63 inside a rising channel. Bullish continuation is likely, with 167.89 acting as the next key resistance. Historical patterns suggest a breakout is forming.

HolderStat┆AVAXUSD seeks to the $20OKX:AVAXUSDT is coiling inside an ascending triangle with resistance at 19.96. If this level is broken, price may rally toward 21.00 and beyond, supported by strong structure and repeated bullish formations.

HolderStat┆HYPEUSD back to the trend line$OKX:HYPEUSDT is breaking out of a triangle formation, continuing a sequence of bullish consolidation and triangle patterns. Price is targeting the upper channel line near 42.75, with the structure supporting continued upside momentum.

$XRP Bias Change: Bullish Elliot Wave CountCRYPTOCAP:XRP is breaking out the descending resistance causing me to take another look at my WXYXZ corrective Eliot Wave count expecting lower. I have adjusted the count to WXY and a 1-2 new motif wave with a target of $3.8
Price is well above the daily 200EMA and daily pivot after testing both as support including the High Volume Node. Closing above the descending resistance today will be a bullish signal but a retest of that resistance as support before continuing onwards its what to look out for.
Analysis is invalidated below $1.8
Safe Trading

Stellar Lumens Looks Ready for Blast-Off!There is a very similar trend happening with the technology of the internet and computing as what we’re seeing now with AI and crypto. The early accumulation cycle for Nvidia would have shaken out many investors simply because of how long it took before going parabolic. Stellar Lumens is showing the same pattern—but the wait could be over. I see a large parabolic run coming for Stellar Lumens very soon, one that could take us to new all-time highs and spark a mass adoption cycle similar to what happened with internet and computing technology.
As always, stay profitable.
- Dalin Anderson

Cronos (CRO) Soars +20% – Can the Rally Push to $0.10?Over the past 24 hours , the Cronos project with the CRO ( COINBASE:CROUSD ) token has seen a price increase of nearly +20% .
Let's see if we can still profit from the movement of the CRO token .
What is Cronos (CRO)?
Cronos is an EVM-compatible blockchain built on the Cosmos SDK. It supports DeFi, NFTs, faster payments, and even AI‑capable dApps. Its native token, CRO, powers fees, staking, and ecosystem activities.
Why CRO Jumped +20% Today (July 8)
Technical leap: Sub-second block times and faster throughput
Better UX: Real-world ready for fast DeFi, payments, and AI dApps
Increased adoption: Greater utility across CAPITALCOM:CROUSD ecosystem
Trader momentum: Volume surges and speculative interest
Strategic roadmap alignment: Upgrades following gas fee improvements ---------------------------------------------------------------------
Now let's examine the CRO token chart on the 4-hour time frame from a technical analysis perspective.
CRO token is currently trying to break the Resistance zone($0.0960-$0.0925) .
Also, in terms of Elliott wave theory , this CRO token price increase with high momentum should be in the form of wave 3 and we can expect a correction to the Potential Reversal Zone(PRZ) for CRO .
I expect CRO to re-attack the Resistance zone($0.0960-$0.0925) after entering the PRZ and rise to at least near $0.1(Round Number) .
Note: Stop Loss (SL) = $0.847= Worst Stop Loss(SL)
Note: If the CRO token breaks the Resistance zone($0.0960-$0.0925) without correction, we can expect a break of the Resistance lines.
Note: It is better to enter a trade if you find the right trigger for a Long position, as a Short position is more risky.
Please respect each other's ideas and express them politely if you agree or disagree.
Cronos Analyze (CROUSD), 4-hour time frame.
Be sure to follow the updated ideas.
Do not forget to put a Stop loss for your positions (For every position you want to open).
Please follow your strategy and updates; this is just my Idea, and I will gladly see your ideas in this post.
Please do not forget the ✅' like '✅ button 🙏😊 & Share it with your friends; thanks, and Trade safe.

$SUI Gearing Up to Break Triple Resistance?CRYPTOCAP:SUI is consolidating under resistance which often leads to a breakthrough but can take some time.
Price is sat above the daily pivot after breaking the downward trend resistance, but still under the daily 200 EMA and High Volume Node resistance. A pop above $3.09 swing high would be a bullish signal to long towards a first target of $4.2 High Volume Node.
Analysis is invalidated with a move below $2.7, leaving heavy resistance still ahead.
Safe trading

$AAVE Ready to Pop?EURONEXT:AAVE long signal is now active.
Price is still well above the daily pivot and daily 200EMA showing a strong local trend.
I am still expecting a decent move to test the all time high, High Volume Node at $460.
Safe trading

HolderStat┆XRPUSD targeting $2.4BINANCE:XRPUSDT is printing repeated consolidation zones and ascending structures. Price is currently rebounding above 2.20, eyeing a breakout toward 2.40. The bullish momentum persists with higher lows and breakout setups.

HolderStat┆BNBUSD forming the triangleBINANCE:BNBUSDT is approaching the apex of a symmetrical triangle pattern with strong support from 650. Repeated rebounds and higher lows indicate bullish pressure. A breakout above 665 could drive price to test the 695 resistance block.

HolderStat┆ADAUSD rising topBINANCE:ADAUSDT is breaking out of a falling channel, following a long consolidation period and bullish wedge development. Price action is coiling around 0.58–0.60 and may rally toward 0.65 if the breakout sustains. Historical patterns suggest continued strength from this structure.

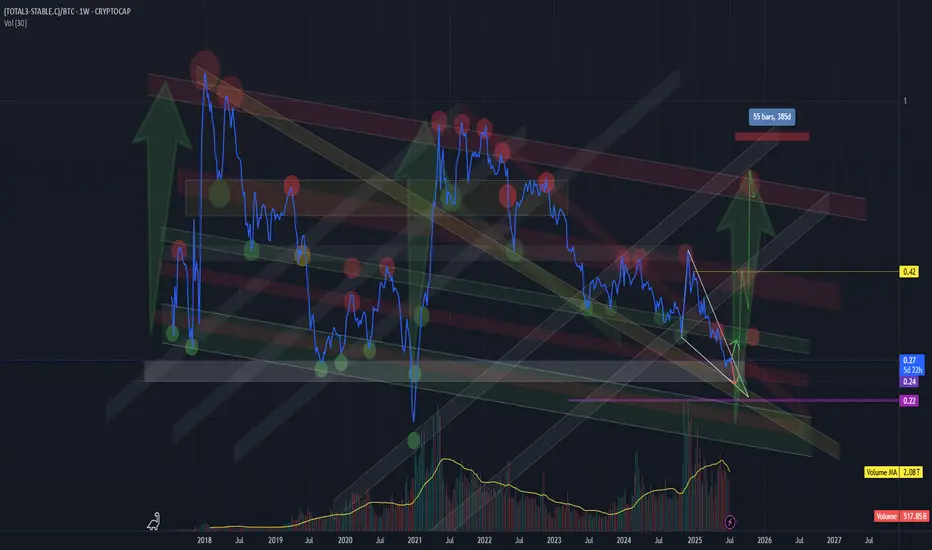
True altcoin-to-BTC strength indicator(CRYPTOCAP:TOTAL3-CRYPTOCAP:STABLE.C)/CRYPTOCAP:BTC
This formula strips out the noise and gives a true altcoin-to-BTC strength indicator.
STABLE.C removes all major stable coins (USDT, USDC, DAI, etc.).
The chart clearly shows previous capitulation zones and launch points for altseasons since 2017
Current formation – potential triangle:
Market makers appear to be coiling price action, forming a triangle-like structure.
This often precedes a volatile breakout — likely to the upside if history repeats.
Market psychology:
Many traders are already heavily positioned in altcoins, which suggests we could be nearing final capitulation.
Historically, altseasons never began with euphoria — but rather fear, exhaustion, and apathy.
BTC halving occurred in April 2024, and typically, the peak of the altseason follows 12 to 16 months later.
The seasonal strength of Q4, often fuels altcoin rallies.
!!! A final washout into a key support zone (on this ratio) could mark the trigger for the next major altseason — possibly starting around August 2025 !!!!!!!!