Solana Potential UpsidesHey Traders, in today's trading session we are monitoring SOL/USDT for a buying opportunity around 166 zone, SOL/USDT is trading in an uptrend and currently is in a correction phase in which it is approaching the trend at 166 support and resistance area.
Trade safe, Joe.
Altcoin

Impulse or Illusion? Key Level to Watch If you find this information inspiring/helpful, please consider a boost and follow! Any questions or comments, please leave a comment!
Recap
Since the price surge off the March 11 low, structure appears to be developing into a potential 5-wave impulse. However, with only three legs printed so far, it remains premature to confirm the full impulse structure.
Structure Assessment
The move resembles a possible ABC zigzag, but the center leg (possible wave 3) is showing strong impulsive characteristics — momentum, follow-through, and vertical lift. That raises the probability of it being an unfolding wave 3, rather than just a C wave.
What’s missing? A clear wave 4.
Until a fourth wave correction is established, and followed by a decisive wave 5, the bullish impulsive count remains tentative.
Outlook
📌 Key level: 0.00001087
The hold of this level will make the look of the structure ideal.
A break below 0.00001087 would dip into unacceptable territory for a developing wave 4 and opens the door to a bearish reassessment — and if the PA enters the price territory of the wave 1 cause a conclusive invalidation of the potential impulse.
✅ If price holds the level and a shallow wave 4 consolidates, we can then watch for signs of wave 5 to confirm the impulse and unlock bullish continuation potential.
Watch this level. Structure will confirm or collapse soon. More updates to follow.
Trade safe, trade smart, trade clarity.

KASPA CUP AND HANDLE (TA+TRADE PLAN)Cup and Handle pattern clearly formed with rounded bottom and emerging handle.
This is a strong bullish continuation pattern suggesting a potential breakout once the handle completes.
The neckline resistance is approximately at $0.12, and a breakout above this could trigger a strong upward move.
Support & Resistance Zones (S/R)
Current Price: $0.10895
Major Resistance Levels:
$0.12 (neckline)
$0.14
$0.16
$0.19 (pattern target)
Major Support Levels:
$0.10
$0.085
$0.065
Volume Analysis
Volume increased during the formation of the right side of the cup – a bullish signal.
Volume has decreased slightly during handle formation, which is expected.
Indicators
RSI (14): 52.89 – Neutral zone. Not overbought or oversold. Room for upward movement.
Stochastic (14, 3, 1): 27.76 – Close to oversold; potential bullish crossover incoming.
Money Flow Index (MFI): 62 – Healthy inflow of money, not overbought yet.
Wave Momentum/Cipher B: Shows bullish divergences and momentum building from recent lows.
Price Target (Pattern Projection)
Cup depth: ~$0.12 - $0.06 = $0.06
Breakout target: $0.12 + $0.06 = $0.18–0.19 zone
📈 Trading Plan – KASPA/USDT
Strategy: Cup and Handle Breakout
Entry
Aggressive Entry: Buy near current price ($0.108–$0.11) if expecting early breakout.
Conservative Entry: Buy on confirmed breakout above $0.12 with strong volume (daily close).
Stop-Loss
Place SL below handle low, approx. $0.096–$0.098 (depending on risk tolerance).
Alternative: wider SL below $0.085 support if aiming for longer-term hold.
Take Profit Levels
TP1: $0.14
TP2: $0.16
TP3: $0.19 (pattern target)
Use laddered take-profits for partial exits at each level.
Risk Management
Risk per trade: 1–2% of capital
Use position sizing calculator to adjust size based on SL distance
🔄 Re-entry Plan
If breakout fails, monitor $0.085–0.095 zone for support and potential re-entry on double-bottom or bull flag.
⚠️ Bearish Scenario
Breakdown below $0.085 invalidates cup and handle.
Next support at $0.065.
Reassess structure and macro sentiment.

SOLANA - Light it up
SOLANA can flip the $185 resistance into support, it opens the door for a potential rally toward the next key levels:
T1: $241
T2: $301
T3: $371
T4: $468
The structure is clean, and the market sentiment is shifting. As long as SOL holds above the reclaimed range and macro conditions remain supportive, this setup could deliver serious upside.

SUI/USDT Potential UpsidesHey Traders, in today's trading session we are monitoring SUI/USDT for a buying opportunity around 3.85 zone, SUI/USDT is trading in an uptrend and currently is in a correction phase in which it is approaching the trend at 3.85 support and resistance area.
Trade safe, Joe.

ETH/USDT Potential UpsidesHey Traders. in today's trading session we are monitoring ETH/USDT for a buying opportunity around 2420 zone, Ethereum is trading in an uptrend and currently is in a correction phase in which it is approaching the trend at 2420 support and resistance area.
Trade safe, Joe.

NEAR is here to stay!Hello TradingView Family / Fellow Traders. This is Richard, also known as theSignalyst.
After breaking above the falling wedge pattern, CBOE:NEAR has been overall bullish, trading within a rising broadening wedge 🔼 marked in blue and red.
📉 As it approaches the lower bound of the wedge — which perfectly intersects with the green support zone — we’ll be watching for short-term long opportunities 🎯.
From a long-term perspective, for the bulls to fully take control, a break above the $3.6 resistance is needed to confirm the next bullish wave 🚀.
📚 Always follow your trading plan regarding entry, risk management, and trade management.
Good luck!
All Strategies Are Good; If Managed Properly!
~Rich

TRX/USDT Potential UpsidesHey Traders, in today's trading session we are monitoring TRX/USDT for a buying opportunity around 0.2680 zone, TRX/USDT is trading in an uptrend and currently is in a correction phase in which it is approaching the trend at 0.2680 support and resistance area.
Trade safe, Joe.

Caught the pivots up, now what?If you find this information inspiring/helpful, please consider a boost and follow! Any questions or comments, please leave a comment!
After catching the directional turn and key pivot level ahead of the recent move, Ethereum delivered the reaction we were anticipating. But what comes next?
The current W2 corrective structure isn’t textbook, so what do we do?
At this stage, we’re anchoring our analysis off the Wave 3 price action, which likely completed before the latest correction. That sets us up to track a potential Wave 4 development.
Here’s what’s still on the table:
We have a sideways style W2
For a wave 4, based off of alternation, we should be looking for a:
A sharp zigzag
Or a contracting triangle coiling up for the next breakout
Key Level to Watch:
👉 A clean break below 2159 would invalidate the more bullish interpretations and open the door to deeper corrective action. ⚠️
Until then, staying patient and letting the structure develop will be key.
Trade safe, trade smart, trade clarity.

SHIB/USDT Potential UpsidesHey Traders, in today's trading session we are monitoring SHIB/USDT for a buying opportunity around 0.00001420 zone, SHIB/USDT is trading in an uptrend and currently is in a correction phase in which it is approaching the trend at 0.00001420 support and resistance area.
Trade safe, Joe.

SUSHI Token: A High-Potential Setup You Shouldn’t IgnoreHello everyone!
A huge opportunity has emerged on the BINANCE:SUSHIUSDT chart. I’ll break down the technical analysis for SUSHI using both the Daily and 4H timeframes , highlighting key levels and potential trade setups.
On 1D timeframe
- Price has swept the liquidity below the November 2024 low , forming an inverse Head and Shoulders pattern , which is a strong bullish reversal signal.
- Price recently broke did the May high after that retraced approximately 24% . This pullback aligned perfectly with a retest of the neckline from the inverse Head and Shoulders pattern, reinforcing its validity as a bullish setup.
On 4H timeframe
- If price breaks above $0.775 , it would serve as a confirmation of bullish momentum, suggesting a likely move toward the liquidity zone above $1.00 .
- In my opinion, if market conditions remain bullish and Bitcoin continues its upward trend, SUSHI is likely to break above the $1.00 level with ease and potentially reach the inverse Head and Shoulders target around $1.20+ .
In conclusion, SUSHI is currently showing strong bullish signals, and if the broader market gives altcoins room to run, this token has the potential to rally aggressively.
Note: SUSHI is a low-cap token with high volatility, so exercise proper risk management when trading or investing.

DOTUSDT Potential UpsidesHey Traders, in today's trading session we are monitoring DOTUSDT for a buying opportunity around 4.20 zone, DOTUSDT is trading in an uptrend and currently is in a correction phase in which it is approaching the trend at 4.20 support and resistance area.
Trade safe, Joe.

ALTS - Altcoins you MUST WATCH for ALTSEASON1) ONDO | BYBIT:ONDOUSDT
After some consistent higher lows, ONDO is likely on its way back towards it's previous ATH:
2) ATOM | BINANCE:ATOMUSDT
Cosmos is one of my favorites, and I'm patiently waiting for the parabolic run on this one:
3) SONIC | BYBIT:SONICUSDT
SONIC / previously FTM is trading nearly 290% away from its previous ATH, with great upside potential.
4) AAVE | BINANCE:AAVEUSDT
AAVE still has a bit to gain before reaching its previous ATH, and the parabolic run has actually already started:
5) ENA | BINANCE:ENAUSDT
IF ENA can hold it's current support, there's a huge upside awaiting this alt:
😊🧡 Please like and follow !!

POL/USDT Potential UpsidesHey Traders, in today's trading session we are monitoring POL/USDT for a buying opportunity around 0.2200 zone, POL/USDT is trading in an uptrend and currently is in a correction phase in which it is approaching the trend at 0.2200 support and resistance area.
Trade safe, Joe.

THETA Token Is In A Larger Flat CorrectionTheta Token with ticker THETAUSD made a deeper retracement in the last year, but it’s actually still above 2023 lows, so it can still be a larger regular 3-3-5 A-B-C flat correction in play. After recent projected five-wave impulse into wave (C) of a three-wave (A)(B)(C) decline in blue wave B, it can be now on the way back to March 2024 highs for blue wave C, which could be a five-wave impulsive cycle. Currently, it can be still unfolding a lower-degree five-wave impulse into wave (1), so more upside is expected for wave (3), especially if breaks above 1.74 bullish level, just be aware of wave (2) pullback.
Theta Token (THETA) is the native cryptocurrency of the Theta Network, a blockchain-powered platform designed for decentralized video streaming and content delivery. It aims to improve the efficiency and cost of streaming by allowing users to share bandwidth and computing resources on a peer-to-peer basis.

AVAX/USDT Potential UpsidesHey Traders, in today's trading session we are monitoring AVAX/USDT for a buying opportunity around 21.00 zone, AVAX/USDT is trading in an uptrend and currently is in a correction phase in which it is approaching the trend at 21.00 support and resistance area.
Trade safe, Joe.

Ripple is Nearing The Daily TrendHey Traders, in today's trading session we are monitoring XRPUSDT for a buying opportunity around 2.28 zone, Ripple is trading in an uptrend and currently is in a correction phase in which it is approaching the trend at 2.28 support and resistance area.
Trade safe, Joe.

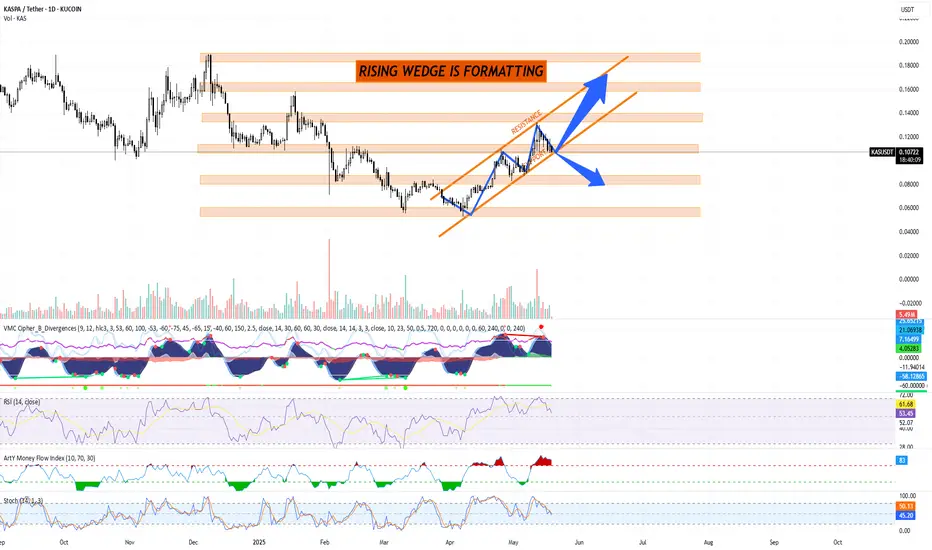
KASPA (KASUSDT) Technical Analysis, 1D Chart KUCOIN + trade planKASPA (KASUSDT) Technical Analysis — 1D Chart by Blaž Fabjan
Date: May 19, 2025
Exchange: KUCOIN
Pair: KAS/USDT
Chart Pattern: Rising Wedge (Bearish Reversal Signal)
A rising wedge is currently forming — characterized by converging trendlines sloping upward.
Support and Resistance levels are clearly outlined in the orange zones.
This pattern often signals a potential breakdown, but an upward breakout is possible with strong momentum.
Key Technical Indicators
1. Volume
Recent volume surge on uptrend suggests buying interest, but declining volume into the wedge tip hints at a possible exhaustion.
2. VMC Cipher B Divergences
Signs of bearish divergence forming; red dots and momentum wave flattening may signal weakening bullish strength.
3. RSI (14)
RSI at 53.27: In neutral territory. Slight bearish divergence observed from recent peaks. Watch for a move below 50 as a confirmation of bearish pressure.
4. Money Flow Index (MFI)
MFI at 83 (overbought zone): Indicates that buying pressure may soon fade, increasing the probability of a correction.
5. Stochastic RSI (14, 3, 3)
Stochastic RSI near 44–49 and crossing downward: Signaling a potential short-term correction.
Key Support & Resistance Zones
🟧 Resistance Levels:
$0.12 – $0.14 (current wedge resistance zone)
$0.16 – $0.18 (next target on bullish breakout)
$0.20+ (major resistance if trend continues)
🟧 Support Levels:
$0.10 (critical support)
$0.08 – $0.09 (wedge breakdown target)
$0.065 – $0.07 (strong demand zone)
Trading Plan for KASPA (KAS/USDT)
Bullish Scenario (Breakout Upwards)
Entry: Above $0.115 with strong volume confirmation
Targets:
TP1: $0.14
TP2: $0.165
TP3: $0.20
Stop-Loss: Below $0.10 (to invalidate wedge structure)
Bearish Scenario (Breakdown)
Entry: Below $0.10 (support break)
Targets:
TP1: $0.085
TP2: $0.072
TP3: $0.065
Stop-Loss: Above $0.11
Neutral/Range Strategy
If KAS trades between $0.10–$0.115 with low volume:
Avoid entry.
Wait for breakout or breakdown confirmation.
Risk Management
Risk/Reward Ratio: Minimum 2:1
Capital Allocation: Max 2–3% of portfolio per trade
Use limit orders to control entry points, especially due to high volatility in crypto markets.
The rising wedge pattern is often a precursor to downside in crypto.
However, macro bullish news, network upgrades, or volume surges may invalidate the bearish setup.
Traders should remain flexible and monitor volume, RSI, and support zones for any signs of reversal.
PEPE/USDT is Nearing an Important ResistanceHey Traders, in today's trading session we are monitoring PEPE/USDT for a selling opportunity around 0.00001330 zone, PEPE/USDT is trading in a downtrend and currently is in a correction phase in which it is approaching the trend at 0.00001330 support and resistance area.
Trade safe, Joe.

Your Guide to Token Trends & Market Action – With My AnalysisHey everyone! Hope you're all enjoying a great weekend !
If you'd like a Token analysis , please drop your request in the comments using the format below:
Request Format :
Project Name: Bitcoin
Token Symbol: BTC
Please Note:
I’ll be analyzing up to 10 tokens only .
One request per person — make it count!
Your analysis will be posted directly as a reply to your comment .
If you find this helpful, don’t forget to ✅ Like ✅ and Share it with your friends.
Wishing you health, wealth, and massive success!

LAUNCHCOIN - New TrendKeep an eye on Launch Coin. it could be the next trend in the making.
LAUNCHCOIN

Fartcoin Potential UpsidesHey Traders, in today's trading session we are monitoring Fartcoin for a buying opportunity around 1.0480 zone, Fartcoin is trading in an uptrend and currently is in a correction phase in which it is approaching the trend at 1.0480 support and resistance area.
Trade safe, Joe.

DOGE/USDT: Key Buy Opportunity at 0.22800 Support Zone!Hey Traders, in today's trading session we are monitoring DOGE/USDT for a buying opportunity around 0.22800 zone, DOGE/USDT is trading in an uptrend and currently is in a correction phase in which it is approaching the trend at 0.22800 support and resistance area.
Trade safe, Joe.
