Notcoin and the Butterfly Effect
🦋 Bullish Butterfly Pattern Forming | NOTUSDT Analysis
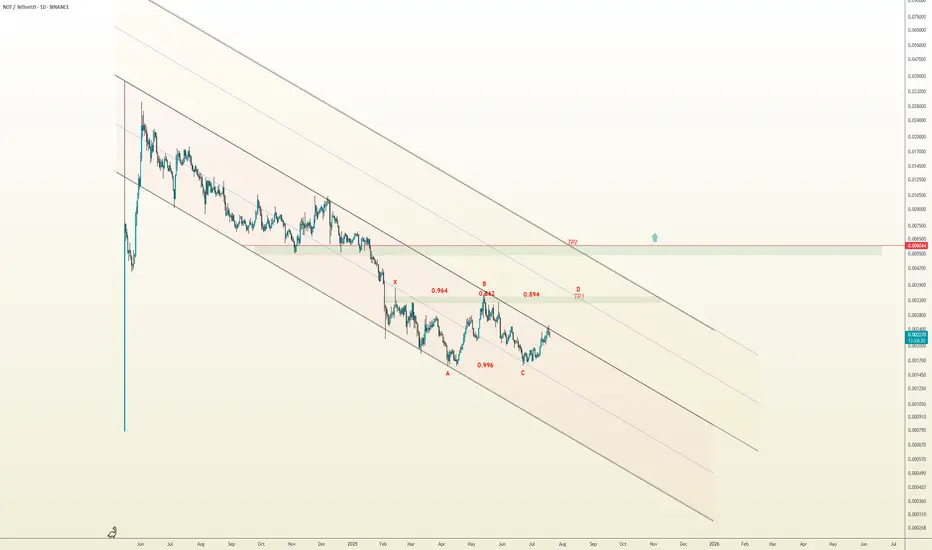
A potential Bullish Butterfly is unfolding on NOTUSDT:
X to A: initial decline
A to B: ~94.3% retracement
B to C: higher low at ~99.6%
C to D: projected bullish leg toward 0.00327 (127.8% Fib), aligning with midline of the yellow descending channel
The price is currently testing the top of the red descending channel.
If bullish momentum holds and this upper boundary breaks, we anticipate a continuation toward point D, and potentially toward 0.006044, the upper yellow channel — a highly critical resistance. A breakout and close above this level may trigger the beginning of a major bullish trend.
🔸 Risk Management:
• Consider partial profit-taking near the midline of the yellow channel
• Trail stop-loss as the price nears point D
• Use only 1% of capital per position
⚠️ Key Note:
• If price breaks below point C, this bullish butterfly setup becomes invalid
Altcoinanalysis
SHIBA INU Heist Plan | Layered Buy Limits + SL Strategy🏴☠️💸**SHIBA INU Heist Blueprint: Rob the Bulls, Outsmart the Bears | Thief Trading Style Strategy (Swing/Scalp)**💸🏴☠️
🌍Hola! Hello! Marhaba! Bonjour! Ola! Hallo!🌍
💰Calling All Market Pirates, Profit Seekers, and Silent Thieves... the vault is open!💰
This is a special market mission for SHIB/USD (SHIBA INU), based on the notorious "Thief Trading Style" — a method designed to sneak in, grab profits, and vanish with style. 💼✨
🧠Backed by a spicy combo of technical, fundamental, on-chain, and sentiment analysis, this strategy is crafted for both swing and day traders ready to infiltrate volatile zones and escape with gains.
🎯The Robbery Plan:
We're targeting a high-risk, high-reward breakout with our eyes on the ATR police trap zone, where market makers often lure and trap traders. Our focus? The sweet spot where consolidation ends, fakeouts begin, and true reversals take off. ⚠️🐍
📥ENTRY (The Break-in):
"The Vault is Unlocked!"
Sneak in using buy limit orders at swing lows or support zones—opt for the 15m or 30m chart to catch pullbacks.
We're stacking orders like a professional thief using DCA (Layering Method) to reduce entry risk. 📊💼
🔎 Entry Zone: Market or limit entries near structure lows—be precise, not greedy.
🛑STOP LOSS (Escape Hatch):
Use the 2H swing low around 0.00001150 as your escape signal.
Risk management is your armor: adjust SL based on your lot size, order count, and trade exposure.
🔒Thief Tip: Never trade without your getaway plan!
📈TARGET (The Safe Zone):
🎯 Primary Target: 0.00001290
Optional: Use trailing SL and scale out profits as the robbery gets hotter.
Scalpers—only join the long side of the heist! If you're packing a big bag of capital, jump in earlier; if not, ride with the swing team. 🚁💸
📊THIEF FUNDAMENTAL FUEL:
SHIB bullish momentum is rising due to macro sentiment shifts, market rotation, whale accumulation, and on-chain volume flow.
Check related macro reports, intermarket insights, and crypto futures data before loading your bags. 🧠📈🔗
🛎️HEIST WARNINGS – Stay Safe!:
🚨 During major news releases, volatility can explode. Don’t get caught!
❌ Avoid fresh entries during news
✅ Use trailing stops to lock gains on existing positions
💖LOVE THIS PLAN? SUPPORT THE CREW:
💥Smash that Boost button💥 to keep the Thief Trading Crew alive and plotting!
We drop fresh heist plans regularly—help us spread the love, grow the crew, and keep stealing profits from the noise. 🚀
📌Disclaimer: This analysis is for educational purposes only—not financial advice. Always DYOR and adjust based on your personal risk profile.
📌Stay tuned for more heist missions. Let’s outwit the markets—one trade at a time.
🤑🐱👤💎 #ThiefTradingStyle #SHIBHeist #CryptoStrategy #MarketRobbery #SmartMoneyMoves

SOL/USDT Technical Breakdown: $125 Support in Sight?Key Observations:
1. Bearish Momentum Intensifying
SOL has been in a steady downtrend since its recent local high near $190, forming lower highs and lower lows on the 4H timeframe.
The current price sits around $147.63, having broken below a minor support level near $149.81.
2. Key Support Level: $124.50
The green horizontal line at $124.50 marks a critical demand zone, which acted as a launchpad during the April rally.
A clear blue arrow on the chart suggests a potential bearish continuation into that zone.
3. Structure and Price Action
The market is forming a descending channel, respecting key horizontal levels.
If the current downward pressure persists, a retest of the $124.50–$125 area looks likely.
Levels to Watch
Immediate Resistance: $149.80 – previous support now flipped
Support Zone: $124.50 – demand-based with prior reaction history
Trend: Bearish in short-to-mid term
Trade Setup Idea (Not Financial Advice)
Entry: $147–$149
Target: $125
Stop Loss: $155 (above minor structure)
Note to Traders
This setup leverages classic support-flip mechanics and momentum-based sell-offs. Watch for confirmation via volume spikes or sharp candle closes. As always, adjust sizing based on your risk tolerance.

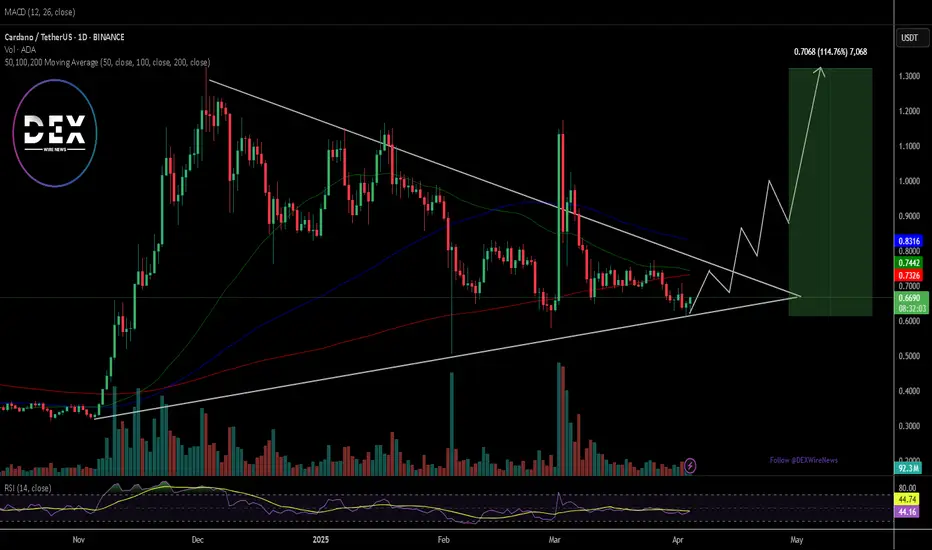
Breaking: $ADA Set for 100% Surge Amidst Launching of VeridianCardano the proof-of-stake blockchain platform that says its goal is to allow “changemakers, innovators and visionaries” to bring about positive global change, is set to breakout of a bullish symmetrical triangle with a 100% surge in sight amidst The Cardano Foundation launching "Veridian", an open-source identity wallet for secure, verifiable credentials on iOS and Android.
The asset is already up 2.24% despite the general crypto and stock market turmoil that saw over $1.5 trillion wiped out from US stock market at open today and over $2.85 trillion wiped out from the US stock market yesterday.
For Cardano ( CRYPTOCAP:ADA ), a breakout above the ceiling of the symmetrical triangle could catalyze the bulls to step in and push the asset to new highs. Similarly, should CRYPTOCAP:ADA fail to pull that stunt and selling pressure increases, CRYPTOCAP:ADA might cool-off in the $0.50 region.
Cardano Price Live Data
The live Cardano price today is $0.660668 USD with a 24-hour trading volume of $868,773,182 USD. Cardano is up 6.97% in the last 24 hours. The current CoinMarketCap ranking is #9, with a live market cap of $23,300,460,393 USD. It has a circulating supply of 35,268,011,575 ADA coins and a max. supply of 45,000,000,000 ADA coins.
TOTAL3 - Altcoin Season DelayedCryptos are currently in correction mode, which could be a good time to accumulate.
TOTAL3 has an interesting setup, with the next relevant support at 765B-800B, which was the previous high in March 2024, and coincides with the daily SMMA (red line).
If we see a positive reaction in this area, we could at least retest the bearish trend line we have formed in the last few days.
I will update this idea as the setup develops.

ARB Analysis Pump IT Looking at this chart, do not underestimate the potential of ARB. The price could reach its target much faster than expected, potentially even before the projected timeline of April 2025.
If it does reach this level ahead of schedule, you’ll be surprised by the price it achieves. Let’s just say it’s a double-digit figure, but I’ll keep the exact number to myself for now.
Stay tuned—this is going to be an exciting journey! 🚀

Polygon's Next Move: Breakout Above $0.388 or Slide to $0.29?Hey trading family! Grab your coffee and let’s dive into what’s next for Polygon (MATIC). We’re at a key level here—if MATIC can break above $0.3881, we could see some real upside. But if it slips below $0.366, we might be looking at a drop to $0.31, $0.30, and potentially all the way down to $0.29.
In this video, I’ll walk you through the technicals and what to expect next. Is MATIC gearing up for a breakout, or are we about to take a detour down? Either way, it’s time to prepare!
If you found this helpful (or just enjoyed hanging out), give it a like, comment your thoughts, and hit follow. Because, let’s be honest, navigating crypto is like trying to drink coffee without spilling—it’s messy but worth it!
Mindbloome Trader
Happy Trading

Solana’s Next Move: Will It Break 163 or Drop to 120? Find OutSolana is at a make-or-break moment. If it can push through 163.25, we could be looking at a run up to 189 and beyond—but if it stays under 157, things could get a little dicey, with a drop to 145 and maybe even all the way down to 120.97.
We’ll break down what to watch for and where the next moves might happen. Solana’s either gearing up for a moonshot, or it’s about to take a nap at 120. Either way, we’re here for it!
If this gave you some clarity (or at least a laugh), don’t forget to like, drop a comment, and hit follow for more updates. Because let’s face it—predicting crypto is like trying to guess when the Wi-Fi will suddenly stop working!
Happy Trading
Mindbloome Trader

Alpha Potential Surge: Preparing for the Next Bull Run 2025Alpha is currently showing a strong support level at $0.07250. This presents a significant opportunity for potential gains. If the support at $0.07260 breaks, the next strong support lies at $0.06735, where we expect a bounce. With the alt season approaching, it's crucial to monitor these levels closely.
Historical data suggests that AlphaUSD could reach a minimum target of $5.62 during the next bull run. If this resistance is flipped by January or February 2025, we might see the price surge to a maximum target of $8.72. The previous bull run in January 2021 showed unexpected volatility.
It's essential to keep the trade active while observing the resistance zones. Remember, we should exit the market around March or October 2025 as the alt season is likely to end during this period.
For more analysis like this, follow us on TradingView to stay updated with our latest trading ideas and insights.

Altcoin Season Soon! (Altseason)Altcoins marketcap seems ready to explode, they have been rising in recent weeks managing to close above the April high.
The rise will be significant when we confirm above the red resistance (450B).
We are just getting started.

🐸💹 PEPE/USDT Analysis 🌐📊📊 Current Market Status:
PEPEUSDT sitting on a key support/resistance level at $0.00000087.
📈 Technical Indicators:
Stochastic RSI printing a cross up.
RSI is reversing, indicating potential upward movement.
🔄 Trading Strategy:
Partial Position: Initiating a partial position.
Next Resistance: At $0.00000183, potential for over a 100% move.
Lower Support: At $0.00000065, be aware of this level.
📣 Market Insight:
Altcoins tend to move during Bitcoin consolidation.
Trade wisely!
📈💡 #PEPE #TradingStrategy #AltcoinAnalysis 🌐📊

Long trade setup for KNCUSDTFor the BINANCE:KNCUSDT.P Long Trade Setup, the following values are suitable for our interval trade:
Entry: 0.7427
Target: 0.8082
Stop: 0.6948
Cost Reduction: 0.7213
The profit is reasonable relative to the risk.
*This is not investment advice; you can lose money. Crypto AI Signals is not responsible for any trades. 🚫💰

Long trade setup for RSRUSDTFor the BINANCE:RSRUSDT.P Long Trade Setup, the following values are suitable for our interval trade:
Entry: 0.002760
Target: 0.002867
Stop: 0.002672
Cost Reduction: -
The profit is reasonable relative to the risk.

Long trade setup for ACHUSDTFor the BINANCE:ACHUSDT.P Long Trade Setup, the following values are suitable for our interval trade:
Entry: 0.01813
Target: 0.01934
Stop: 0.01745
Cost Reduction: -
The profit is reasonable relative to the risk.
*This is not investment advice; you can lose money. Crypto AI Signals is not responsible for any trades. 🚫💰

Long trade setup for UNIUSDTFor the BINANCE:UNIUSDT.P Long Trade Setup, the following values are suitable for our interval trade:
Entry: 1.340
Target: 1.393
Stop: 1.306
Cost Reduction: -
The profit is reasonable relative to the risk.
*This is not investment advice; you can lose money. Crypto AI Signals is not responsible for any trades. 🚫💰

Long trade setup for ATAUSDTFor the BINANCE:ATAUSDT.P Long Trade Setup, the following values are suitable for our interval trade:
Entry: 0.0796
Target: 0.0836
Stop: 0.0775
Cost Reduction: -
The profit is reasonable relative to the risk.
*This is not investment advice; you can lose money. Crypto AI Signals is not responsible for any trades. 🚫💰

Long trade setup for KNCUSDTFor the BINANCE:KNCUSDT.P Long Trade Setup, the following values are suitable for our interval trade:
Entry: 0.7213
Target: 0.7696
Stop: 0.6955
Cost Reduction: -
The profit is reasonable relative to the risk.
*This is not investment advice; you can lose money. Crypto AI Signals is not responsible for any trades. 🚫💰

Long trade setup for TUSDTFor the BINANCE:TUSDT.P Long Trade Setup, the following values are suitable for our interval trade:
Entry: 0.02138
Target: 0.02273
Stop: 0.02063
Cost Reduction: -
The profit is reasonable relative to the risk.
*This is not investment advice; you can lose money. Crypto AI Signals is not responsible for any trades. 🚫💰

Long trade setup for STMXUSDTFor the BINANCE:STMXUSDT.P Long Trade Setup, the following values are suitable for our interval trade:
Entry: 0.00667
Target: 0.000725
Stop: 0.00623
Cost Reduction: -
The profit is reasonable relative to the risk.
*This is not investment advice; you can lose money. Crypto AI Signals is not responsible for any trades. 🚫💰

Total 3 Bull Market in Jan - Mar 2024Total 3 - Altcoins (minus BTC & ETH)
A different "perspective" to yesterdays chart.
Yesterdays chart suggested TOTAL 2 (Altcoins minus BTC) has a probability of breaking out in Dec 2023.
The TOTAL 3 (Alts minus BTC/ETH) chart suggests we could break out later between Jan - Mar 2024. This would make sense as BTC and ETH are typically first movers, and are followed by the altcoin market.
Its important to understand that these charts help gauge timing a long term trade in altcoins. The charts only provide a rough time frame of a probability of a break out into a new secular bull market between Dec 2023 - Mar 2024. All this offers is a probable time window. I would hope it would help you sit on your cash until we have some confirmation of price direction within a historically reasonable time frame, as illustrated in the charts.
PUKA.

CQT bullish scenarioHello Traders, I want to share with you a low cap token with good fundamental named Covalent KUCOIN:CQTUSDT .
This is my view from technical analysis perspective :
CQT has reclaimed its structure for bullish move.
The price was staying above MA200 since mid Dec 2022.
Making higher low since Aug 2022 yet btc had lower low in last Nov.
Below $0.11 is good for accumulation.
Once breakout the target are 0.189 ; 0.224 ; 0.289

APEUSD (APE) - Broken through key resistance 📉APEUSD has broken through key resistance and is prepped to drop towards the take profit levels shown.

WABI potential to give more than 100% profit #WABI/BTC
there is an ascending support zone that price must hold to break out from descending resistance and give us great profit.
as you can see in weekly time frame, RSI candles are above HMA that van be a bullish sign.
