When Altseason? Clues in other chart Ex) #1Hi guys.
So Its no secret bitcoin has been ripping.
We are at new all time highs, and in full on price discovery mode.
I recently posted an ongoing macro analysis on ADA (Cardano) supporting my theory that it is one of the better alts to be investing in for alt explosion.
I want to look elsewhere to see if i can find supporting evidence that its time to invest or trade altcoins.
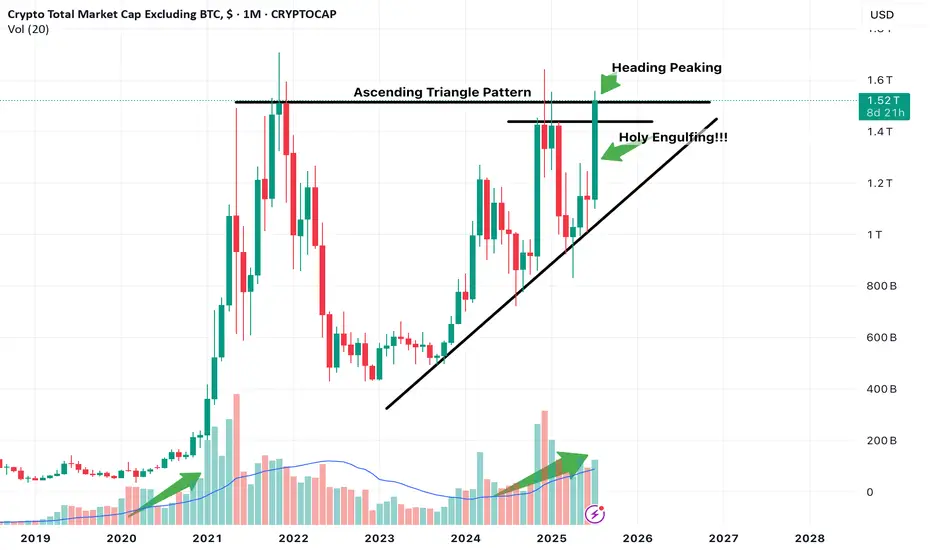
One chart that can be used is the Total Market Cap of Crypto excluding Bitcoin.
This chart showcases total altcoin market capitalization and its movements.
I believe certain Technical developments can really help us gauge at whats to come.
NOte this is on the 1 Month timeframe aka looking into Macro developments.
Just focusing on Candlestick action.
Notice we have been in this ascending channel trend, along with a potential Ascending triangle pattern development which if breakout occurs with confirmation can push Altcoin market cap higher indicating that liquidity is entering altcoins which indicates potential Uptrend.
The month of July so far is in position to print a massive engulfing Bullish candle, which is a great sign.
The upper part is also peaking its head above the Horizontal resistance line. Need to observe confirmation of this breakout. Look for it in smaller timeframes, ill look for it in the 3 day or 5 day.
We are also in position to print a higher high first time in a while.
Notice also Volume. We are seeing currently similar increasing volume as previous alt coin market cap expansion.
Keep an eye out on more posts to add to evidence that supports we are in the verge of potential altcoin season.
Altcoinmarketcap
Total2 wants to inv h&s its way into completing its cup’s handleShould break above the neckline of this lemon lime colored inverse head and shoulder pattern in the upcoming 1-3 weekly candles here, and we are likely less than a week a way from the daily chart golden cross (not shown here). The breakout target from this inverse head and shoulder pattern will take price above the rimline of the larger cup and handle pattern and upon triggering the breakout from that we head to the light blue erasure move target which fro where price action currently is is about a 100% gain for the alt racket which should confirm alt season. *not financial advice*

BTC.D (Dominance at Critical Fibonacci Confluence) 2025 Weekly
**Summary:**
Bitcoin Dominance (BTC.D) is testing a major Fibonacci confluence near the 66% level. This zone historically acts as a major pivot and may signal either a continued dominance rally or a potential reversal setting the stage for altseason. We use three layered Fibonacci retracements to outline dominant trend zones, key resistances, and projected targets.
**Chart Context:**
This chart uses **three distinct Fibonacci retracements** to map the historical and projected behavior of BTC dominance:
1. **Primary Fib** (100% to 0%): Captures the macro move from BTC.D \~100% down to its 0% level at \~0%, which aligns with the first altseason (2018–2019).
2. **Secondary Fib** (100% to 38.88%): Maps the first bearish wave to identify potential recovery levels. BTC.D retraced up to the 61.8% (\~73.68%) but failed to break further.
3. **Third or the Current Fib** (73.68% to 38.88%): Maps the latest bearish fall in BTC.D. As of now, BTC.D is hovering at the 78.6% retracement level of this move, indicating heavy resistance.
**Key Technical Observations:**
* **1st TP (Resistance):** 66% — Strong Fibonacci confluence zone:
* Fib2 48.6% ≈ Fib3 78.6%
* Major reversal zone historically
* **2nd TP (Support):** 52.25% — Multi-Fib confluence:
* Fib1 48.6%, Fib2 61.8%, Fib3 38.2%
* **3rd TP (Ultimate Support):** 38.88% — Historical BTC.D bottom, aligned with the first altseason.
* Intermediate Fibonacci confluences between 48%–60% serve as layered support during decline phases.
**Indicators:**
* No external indicators used; pure multi-frame Fibonacci confluence.
* Price action structure and historical patterns highlight potential market rotation zones.
**Fundamental Context:**
The current phase of the market reflects increasing speculative activity in altcoins while Bitcoin consolidates. Historically, high BTC.D correlates with Bitcoin-led rallies, while a sharp drop often triggers altseason.
* Growing inflows into ETH, SOL, and possible now XRP, and mid-cap alts suggest capital rotation.
* If BTC.D faces rejection from 66%, the market could enter a new altseason phase.
* Macro tailwinds (e.g., easing monetary policy, risk-on sentiment) support altcoin performance in the medium term.
**Philosophical or Narrative View:**
BTC.D acts as a barometer of market risk preference. As confidence expands beyond Bitcoin, money flows into altcoins—like tributaries branching off the main river. The rejection from major confluences signals this psychological shift, marking phases of creative decentralization.
**Related Reference Charts:**
* TOTAL3 Fibonacci Setup (Altcoin market excluding BTC & ETH):
* TOTAL2 Correction Probabilities:
**Bias & Strategy Implication:**
* **Primary Bias:** Bearish rejection from 66% followed by correction to 52% and potentially 38.88%.
* **Alternative Scenario:** Brief breach above 66% before reversal.
* Traders may consider rotating into altcoin exposure if BTC.D confirms reversal at the confluence zone.
**Time Horizon:**
* Mid to Long Term (1–6 months outlook)
* Weekly timeframe tracking
**Notes & Disclaimers:**
* This analysis is for educational purposes. Market conditions may evolve rapidly.
* Use proper risk management when acting on dominance signals.

TOTAL3 – Altcoin Market Cap (Excluding BTC & ETH) Weekly TF 2025Summary
TOTAL3 is currently in a macro bullish cycle and undergoing a mid-cycle correction. The chart presents a Fibonacci-based structural roadmap with 3 Take Profit zones, identifying both correction supports and breakout targets. There is a high probability of short-term downside before a significant altcoin rally.
🌈 Chart Context
Fibonacci Retracement (Primary Leg):
100% = 285.3B
0% = 1.16T
Trend-Based Fibonacci Extension
A = 285.3B
B = 775B
C = 464.11B
Price as of analysis: ~845.62B
Key Technical Observations
Support Levels:
61.8% Fib Retracement = 618.5B
Strong Confluence Zone: Fib Retracement 48% + Fib Extension 50–61.8% (highlighted on chart)
38.2% Fib Retracement = 824.38B
Resistance Levels:
951.73B: 23.6% Retracement + 100% Extension – strong resistance zone before $1T psychological level
Take Profit Zones:
1 TP (1.1T) = 127% Fib Extension (Upper leg of parallel extension)
2 TP (1.28T) = 161.8% Fib Extension
3 TP (1.7T) = -61.8% Fib Retracement and 261.8% Extension confluence zone
Pattern & Projection:
The structure suggests a possible correction phase to lower support before continuation.
Bullish continuation expected after corrective phase, shown by the projected dotted path.
Structure: Bullish structure with healthy correction in mid-phase of the macro uptrend.
Fundamental Context
Altcoin Lag: TOTAL3 remains ~40% below its ATH, while BTC and ETH have already hit new highs.
Liquidity Shift Expected: Altcoin capital rotation tends to follow after BTC dominance stabilizes or drops.
Macro Backdrop:
Fed expected to cut rates later in 2025
Stablecoin legislation and ETF narratives building altcoin trust
Institutional inflows are slowly diversifying from BTC to ETH and large-cap alts
These suggest a possible shakeout or deeper correction before altseason breakout gains strength.
Bias & Strategy Implication:
Bias: Bullish Mid-Term – Correction Before Continuation
Expected Scenario: Pullback to strong support zones (824B–733B–618B), followed by a sustained breakout toward 1.1T–1.7T.
Invalidation: Weekly close below 618B may delay bullish structure and extend correction.
Strategy:
Long entries at support zones with tight invalidation
Scaling out near TP1, TP2, TP3 based on market momentum
Philosophical View
Patience is the virtue of the second leg in a macro trend. The correction serves to eject the impatient, reprice risk, and strengthen conviction. When TOTAL3 rises from deep support, it will be not just price but confidence that rallies.
Related Reference Charts
TOTAL Market Cap Structural Breakout:
TOTAL2 Altcoin Chart with Fibonacci Path:
✅ Tags
#TOTAL3 #AltcoinMarket #Fibonacci #Altseason #CryptoCorrection #CryptoMacro #TechnicalAnalysis #BullishOutlook #MidCycleCorrection #Crypto2025
⚠️ Notes & Disclaimers
This analysis is educational and not financial advice. Markets are inherently risky. Do your own research and manage risk accordingly.

TOTAL2 – Altcoin Market Cap (Weekly TF) 2025
**Summary:**
The TOTAL2 chart (crypto market cap excluding BTC) is showing a structurally bullish formation after a deep retracement and a higher low confirmation. This setup suggests a potential multi-phase rally toward 2.98T and beyond, with defined support zones and Fibonacci targets aligned with liquidity cycles. This analysis visualizes the expected roadmap based on trend-based Fibonacci extensions, retracement levels, and psychological market phases. Notably, the outlook includes the possibility of an initial correction to retest strong support zones before the market begins its ascent.
**Chart Context:**
TOTAL2 represents the aggregated market capitalization of all crypto assets excluding Bitcoin. Historically, it reflects capital rotation into altcoins, especially following BTC dominance peaks. The current chart shows strong reaccumulation above the 1T support zone, with Fibonacci confluences hinting at a sustained recovery pattern. Dotted arrows illustrate a wave-like projection of accumulation, rally, retracement, and expansion. The possibility of a near-term correction to lower support zones is also embedded in the path structure.
**Key Technical Observations: and Levels**
TP1 = 1.78T
TP2 = 2.05T
TP3 = 2.4T
TP4 = 2.85T
* **Secondary Fib Retracement :** 0% = 1.23T, 100% = 425.89B
* Key zones: 23.6% = 1.04T, 38.2% = \~840.42B, 61.8% = \~569.41B
Possible Support Levels: 1.04T, 930B, 840B, 766B, 735B,
* **Trend-Based Fib (A-B-C):** A = \~420B, B = \~1.23T, C = \~735B
* This projection aligns with TP1 at 1.78T
* **Support Area:** Around 1T psychological zone (930B)
* **Strong Support Zone:** 735 Bto775B
* **First Target Zone:** Between 1.73T and 1.89T (early resistance + Fib cluster)
**Indicators:**
* Weekly structure forming higher lows
* Long-term Fib retracements respected
* Trend-Based Extension projecting 1.618 move
* No divergence, confirming strength
**Fundamental Context:**
* Liquidity conditions are improving globally with rate cuts expected into late 2025.
* ETH and ecosystem tokens are likely to lead altcoin recovery.
* Regulatory clarity and ETF flows add legitimacy to broader crypto allocations.
* Historical alt-seasons emerge from BTC profit rotation—TOTAL2 leads that shift.
* However, several macro risks may trigger a correction before rallying:
* The Crypto Fear & Greed Index is currently high, suggesting overbought conditions.
* Macroeconomic uncertainties (e.g., inflation, rate hike fears) can suppress short-term risk appetite.
* Regulatory tightening across major jurisdictions introduces hesitation in capital deployment.
* Technical signs of a five-wave drop in BTC hint at a larger ABC correction scenario.
* DAT (Digital Asset Treasury) exposure among public firms may lead to forced liquidations during downturns.
**Philosophical or Narrative View:**
This is not just a market cycle—it's a reflection of decentralized innovation reclaiming narrative dominance. After fear-induced lows, TOTAL2's rise echoes the resilience of builders, protocols, and investor conviction. Each Fibonacci level acts like a checkpoint in the unfolding story of crypto's evolution beyond Bitcoin.
**Related Reference Charts:**
*
**Bias & Strategy Implication:**
* **Bias:** Bullish with short-term corrective risk
* **Accumulation Zone:** 1.0T–1.23T
* **Initial Risk:** Price may revisit the **Support Area (1T)** or even the **Strong Support Zone (775B–725B)** before a sustained move higher.
* **Partial TP:** 1.78T–2.05T
* **Extended TP:** 2.4T–2.98T
* Caution near TP4–Bonus zones as distribution risk increases
* Invalidated if closes below 725B (structure break)
**Notes & Disclaimers:**
This is a structural macro outlook and not financial advice. Markets are dynamic and subject to rapid shifts in sentiment, liquidity, and regulation. Always use risk management.

TOTAL 3Everything is clear; just look at the past chart. There are two scenarios. In any case, we should see a sharp move in altcoins soon.
My personal opinion is that the blue box scenario will play out within the next 2 to 6 months. If Ethereum rises above $3,000, altcoins will begin their growth.

Altcoin Market Signaling Potential Bullish Run to $1 TrillionTotal Alt Coins Market Cap analysis update
After a significant upward movement in the market cap, consolidation within a descending channel or flag suggests a period of profit-taking and market indecision, though the overall structure remains bullish. The market is approaching the upper resistance of the flag, signaling the potential for a breakout. Once the breakout is confirmed, a bullish move can be expected. Based on historical price action and technical patterns, the next major target post-breakout could be around $1 trillion before end of 2024.

TOTAL2 - Monthly Strong Bull Phase BeginsIn each circle the alligator indicator can be seen to be stretched out or "open"
When in a state like this bull action is most common
This is the Monthly timeframe so patience is required for big gains, regardless we will be seeing more green days than red.
BULLISH

#altcoins' dominance matters!#others chart (#altcoin market cap excluding top 10 #alt) is showing severe weakness. Even more low cap and mid cap altcoin price correction continuation to minor altcoins seem necessary in a few months. Not financial advice.

LINKUSDTLINKUSDT have done a perfect impulse to the upside in 1 2 3 4 5 Wave. After that it is correcting the entire impulse. For now it looks like it is going the collection in WXY. The 1:1 Extension and the .618 Golden pocket lines are perfectly. This chart looks extremely bullish. Let's see if we get a good reaction around the golden pocket. NFA.

ALTcoins - sh*&coin cycles - the casino that never closesALTcoins - sh*&coin cycles - the casino that never closes
ZOOM into this puppy to see the short term action better
Its been awhile since i looked at altcoins. we are experiencing a macro pivot here imo.
I have been loading up for months now. Will rotate out of the BTC bag after we hit the zone I am looking for on btc dom chart (see attached), into whatever alts in my port have done the best on this pre run we are getting now.
Altcoins have been VERY cyclical. I mean look at those repeating momentum cycles, its clear asf. You have to be blind not to see it. You can thank the whale algos for that. Altcoins, and crypto in general is just a huge casino, these guys just milk retail over and over.
Trick is you gotta learn to see what they are doing not what their bots or paid shills are telling you on twitter.
Ride the dragon then jump of that mofo before it evaporates.
I've been through several of these now and am only just learning the ways. Yes I am an idiot, I should be filthy rich by now, but the big picture is becoming clear to me..
Big question here is ; do we get some big black swan event, looking like late Nov, like last cycle, or just a healthy correction on the way up into the stratosphere??
"Show Me The Charts and I'll Tell You the News"

CONSERVATIVE TOTAL3 ALTCOIN MARKET CAP PREDICTIONThis is my conservative Total3 (no BTC or ETH included) altcoin market cap prediction for a minimum all-time high.
Following the past trend, we can expect a high around ~$1.85 trillion . This is +178% from our current price and only a +70% increase from the prior all-time high in 2021. The expected date is an estimate taken from the number of days from the 2nd last ATH to the last ATH.
The data is only a single set and should not be taken as fact in the slightest. However, if we use it as an estimate, we will reach a new ATH on September 15, 2025 , which is 558 calendar days from today.
This is a strictly TA breakdown of the Total2 market cap. With full transparency, I think it is realistic that we will see a greater move than this. We may see this trend line only as resistance before breaking even further above $1.85. I have no time estimate for this.
Everyone knows we now have Bitcoin institutionally adopted. ETFs have exceeded inflow expectations and could lead to greater ATH's than predicted, which could be an indicator for the same moves for altcoins.

CONSERVATIVE ALTCOIN MARKET CAP PREDICTION WITH DATESThis is my conservative Total2 (no BTC included) altcoin market cap prediction for a minimum all-time high.
Following the past trend, we can expect a high around ~$2.9 trillion . This is +156% from our current price and only a +75% increase from the all-time high prior to the last high in 2021. The expected date is an estimate taken from the number of days from the 2nd last ATH to the last ATH.
The data is only a single set and should not be taken as fact in the slightest. However, if we use it as an estimate, we will reach a new ATH on October 27, 2025 , which is 609 calendar days from today.
This is a strictly TA breakdown of the Total2 market cap. With full transparency, I think it is realistic that we will see a greater move than this. We may see this trend line only as resistance before breaking even further above $2.9T. I have no time estimate for this.
Everyone knows we now have Bitcoin institutionally adopted. ETFs have exceeded inflow expectations and could lead to greater ATH's than predicted, which could be an indicator for the same moves for altcoins.

Altcoin Season Soon! (Altseason)Altcoins marketcap seems ready to explode, they have been rising in recent weeks managing to close above the April high.
The rise will be significant when we confirm above the red resistance (450B).
We are just getting started.

SOL vs ADA - A Market Cap Risk Comparison SOL vs ADA - A Market Cap Risk Comparison
CRYPTOCAP:ETH , CRYPTOCAP:SOL & CRYPTOCAP:ADA can all rise together & one may win out over the other but I think this chart emphasizes the increased potential -92% downside risk in CRYPTOCAP:SOL
CRYPTOCAP:BTC , CRYPTOCAP:ETH & CRYPTOCAP:ADA have c.60% downside to their recent lows by comparison.
This also highlights just what an incredible run CRYPTOCAP:SOL has had. To be clear. I am not stating anything other than this.
▫️ SOL has increased downside risk vs BTC, ETH & ADA based on market cap increase
▫️ That Risk may never materialize but it is there and its better to know than not know.
▫️ There is room for all 3 in your portfolio, allocating based on downside risk avoidance may be beneficial.
Taking "some profits" when SOL hit $120 was clever and leaving something on the table for the larger long term move is also clever. Its not about being right, its about protecting yourself and trying to stay on the right side of probability. Allocate accordingly.
If you are a long term investor all this short term noise does not matter and you might be looking for SOL to make a new low to continue to DCA. Also fine.
I am presenting this visual to offer perspective to help you with your own personal portfolio decision. Its just a perspective worth considering.
PUKA

APE BUY SETUPHi Everyone!
APE setup today
APE Analyze ( APEUSDT.P ), 15 Minute time frame ⏰
APE looking good to buy, if you want to BUY APE, you can BUY in RETEST AREA
but, Don't forget set up your trading plan, risk reward
Good luck Guys!
*Follow For More!
*DYOR

Altcoin Season - The Most Important Chart in Crypto!The altcoin total market cap just broke from a 2 YEAR CONSOLIDATION!!!
This is HUGE.
Altcoins should fly soon once BTC decides to take a break and range...
Market is getting super bullish before the end of the year and this breakout from BTC surprised many.
Time is running out to get a good entry. FOMO is starting to take over.
People had two years to buy already. Bitcoin is now less than 50% from its All Time High! That takes less than 2 days in a good week.
Enjoy the pumps!

Long trade setup for ARKUSDTFor the BINANCE:ARKUSDT.P Long Trade Setup, the following values are suitable for our interval trade:
Entry: 1.3350
Target: 1.5289
Stop: 1.2670
Cost Reduction: 1.2807
The profit is reasonable relative to the risk.

#altcoins will have a blood bath?Here' s the #altcoin #totalmarketcap incl. #ethereum . This chart shows , altcoins' market cap have come to the top of the channel. Declination here is will doom altcoin bag holders. Clear breaking channel with volume and weekly closings is the invalidation. I showed the support levels on the chart. The war is not good for markets, a friendly reminder. Always use stop losses. I don' t say buy or sell , always train yourself and this is NOT FINANCIAL ADVICE.

ALTCOIN MC update ; looks... badALTCOIN MC update ; looks... bad
zoom in, you can see momentum is rolling over to the downside;;; again.
its all just getting dragged out this time. which sucks because that prob means massively long lame asf bear market.
good aspect of that is it gives you time to accumulate shit coins that will survive.
aim for the ones with LONG dev runways who maintain development. thats it. the only two things that count.
everything else will die or barely survive and only half ass pump next time.
*activate hybernation mode
*apply for mcdonalds job

IMPORTANT LEVEL FOR CRYPTO MARKET CAP!CRYPTOCAP:TOTAL 1 (2D)
Decision time for the whole of the #Crypto Market.
We have formed an Ascending Triangle currently up against heavy resistance between ~ $1.13T & $1.18T.
Break up, obviously good things to follow.
Lose the trend line and we target the red circle.
MIL:BTC EURONEXT:ALTS

Crypt Total Market Cap, Uptrend?This chart shows the total Crypto Market Cap, includes every coin on the market.
The Fib levels are drawn from the Covid Crash to the ultimate November Top. Upon the bearmarket retrace we bounced of teh 0.786 support zone to reach current resistance at 0.618.
There is a clear uptrend forming, now this is nothing to trade with imo, just important to note that this might be an area of support.
BTC is strong and we can clearly see that when comparing to the "Total Crypto Market Cap excluding BTC and ETH"
If there is more downside here i expect BTC Dominance to hit those 52%-55% levels
and ETH dominance to hit 22%-25%
while the Altcoin market will suffer greatly...
I still like the odds and will be swapping some ETH into altcoins once all the economical announcements are made this week and the data is clear.
Will also keep ammo for lower levels.
One thing to keep in mind, its all about perspective, just imagine seeing these levels during the bullmarket. These are the "Ah man i wish i bought then" levels

Total 3 Bull Market in Jan - Mar 2024Total 3 - Altcoins (minus BTC & ETH)
A different "perspective" to yesterdays chart.
Yesterdays chart suggested TOTAL 2 (Altcoins minus BTC) has a probability of breaking out in Dec 2023.
The TOTAL 3 (Alts minus BTC/ETH) chart suggests we could break out later between Jan - Mar 2024. This would make sense as BTC and ETH are typically first movers, and are followed by the altcoin market.
Its important to understand that these charts help gauge timing a long term trade in altcoins. The charts only provide a rough time frame of a probability of a break out into a new secular bull market between Dec 2023 - Mar 2024. All this offers is a probable time window. I would hope it would help you sit on your cash until we have some confirmation of price direction within a historically reasonable time frame, as illustrated in the charts.
PUKA.
