If TOTAL3 repeats itself...I don't particularly believe in fractals etc... however if TOTAL3 (altcoins market cap without BTC and ETH) repeate his previous run in the same time we should see next top at 1.273 trillions dollars. I think it could be higher but let's just stuck with the projection of history repeating itself.
Off course I made the projection assuming the bottom of this bearish channel will be touched again (it means new lows are coming). In that case go watch what price had your favourite altcoins last time TOTAL3 touched ATH (red arrow), assess where do you see it bottoming unless you think it has already bottomed and do a math proportion to understand where price could go.
This is an indicative method to understand which altcoins is more worth to accumulate during bear market.
Good luck
Altcoinmarketcap

BTC Dominance is DominatingThe 49% Resistance area for BTC D. has been at play since the summer of 2021 when we first hit that resistance level.
You can see in previous areas BTC D finding resistance was bullish, money flowed into Alts and Total Crypto MC pumped hard. The 3d retrace was marked by a further dip in overall Crypto MC but coincided with a drop in BTC price. Currently since the last time resistance was hit we have seen several alts pop off and BTC find resistance at 30800.
While BTC D was rejected at resistance once more on 12 April, a retrace occured that found support around 47%.
Currently we are bouncing back to the resistance at 49%. BTC Dominance
Over the last 3 days BTC Dominance has been pumping back to resistance.
If it breaks out to the upside, expect ALTS to bleed, would be a good moment to load up on Altcoins.
Hitting Resistance and breaking down to previous levels would likely be bullish for altcoins as long as BTC price either stabilizes (ideal scenario) or pumps along with the alts.
Patiently waiting...

#ALTCOIN MARKETCAP is Flashing Important Signal.Have a blessed Sunday to you all.
ALTMACP broke to the upside.
I am just skeptical about it for one reason, the confirmation candle closed in the red.
Unless we get a candle closing in green above the same, expect manipulation.
Be careful about holding the maximum portion of your portfolio in ALts.
Alt/BTC pairs will bleed.
I prefer holding BTC and a few alts with fundamental advantages like VRA is 230% already, HFT has started its run( Chart coming soon), and many other Gems APT did 4x.
So follow me if you want to know the next potential 50x coins!
DYOR, This is not financial advice.
Do show your support if you like my work.
Thank you
#PEACE

TOTAL ALTS ; WEVE MOVED!! update ; flip bull?yo yo we finally made some sorta move.
decided to clear this up a bit. these two macro fractals both kinda make sense.. we'll get a clear invalidation of one of them in a few days. lambos or traps?
i have no frigin idea which one but i bet one of them plays and it becomes more clear very soon.
regardless we prob have a few more days of UP to get everyone nice and semi hard again.
gl degens

TOTAL3 Bullish Cypher Remains Strong Despite Bearish PushbacksDespite the recent Bearish pullbacks, the news driven dumps, and coin collapses (particularly among coins that have heavy unstable associations with DeFi); the Total 3 Market Cap itself has remained stable above the 78.6% Retrace Cypher PCZ and above the 200 Week Moving Average.
I think we will see marketcap flow out of the DeFi space and into coins like Litecoin, Dogecoin, and XRP and that that will keep the Total 3 Marketcap afloat.

This is the TIME to Put Money in the Crypto🔥🔥🔥🔥In recent weeks we are seeing good decline in dollar index, tht why global market is breathing.
if we analyze TOTAL Crypto Marketcap its really great opportunity to accumulate top cryptos.
if u invest some money now, then i would recommend u to book the profit at 2 trillion dollar marketcap.

ALT COIN MACRO REPEAT - update OCT 2022An update on the ALT macro repeat idea i posted before.
I wanted a map for the continued downside option here.

TOTAL2 vs BTC.D - Signs Of Potential Alt Season To Come When you compare Total Altcoin market cap (Crypto market cap excluding BTC) side by side, you can see that when BTC dominance (BTC.D) falls is usually when alt season happens. When BTC.D goes sideways, altcoins tent to do the same or even consolidate for a while, like we've seen for the last year or so.
An a chart altseasn is marked in green, consolidation/sideways movement in yellow and in blue is when crypto winter comes.
After BTC topped in Dec. 2017, BTC dominance continued to fall as BTC went into a retracement. Altcoins continued to rally into this moment. After that The whole market crashed and BTC dominance rose significant. This is a typical sign of bear market. This time is a bit different. After BTC made first ATH in 2021 and had its first major selloff, BTC dominance started to go sideways while altcoin market cap (TOTAL2) capitulated. BTC dominance than actually continued to go sideways even after whole marked crashed which does show a sign that the bull market, at least for the altcoins is not over. If it would be over, BTC dominance would have to be rising right now a lot, but it doesn't. Instead it is looking like it will continue to crash, which is a very good sign for altcoins. Remember that time is irrelevant here as no one knows for how long and when things will play out.
I am very positive that it will come while BTC will slowly be rising into a retracement.
DISCLAMER:
I am not a financial advisor so non of this should be taken as a financial advise. Be well.

TOTAL2 - Recovery FormationSimilar scenarios can be seen to the earlier green rectangle period
This green period was the result of a breakout from a falling wedge (recovery formation)
The green rectangle period we are approaching now also follows a recovery formation, however a different one, an inverted H&S
This rise will lead to another retest of the strong downward resistance in white
Daily timeframe

LITECOIN to Take $19 Billion From The TOTAL2 Altcoin MarketcapWe have a Bullish 3 Line Strike as well as a Tweezer Top Visible on the Monthly Timeframe which would Currently put LTC on a path to take atleast a 3.7% Market Cap Dominance over the Total2 Crypto Market Cap which at TOTAL2's current USD value would put LTC at a Market Cap of atleast $19 Billion which is a little over 11 times more than it's current Market Cap; Assuming that the Circulating Supply of LTC remains near where it is, that would imply that the LTC/USD price will go up to around $584.85 per coin of this TOTAL2/LTC chart were to play out.

TOTAL2 - Daily Bullish DivergencePrice prints lower lows
While indicator prints a higher low
This is a Classic Bullish Divergence
Daily timeframe
TOTAL2 (Altcoin Market) Bearish SentimentUsing two different Fibonacci Circle plots we can see price being rejected at purple and inversely being supported as orange
Currently price is in the middle of the purple fib ring, this allows a bearish conclusion to be made
Bearish action is plotted by Bars pattern in red (just a guess of how it will undergo)
Once price reaches orange again resumption of a bull market is possible (green)
Bitcoin will recover before altcoins

Total 2 - Altcoin Market exc BitcoinAs you can see i predict a x4 increase in the altcoin marketcap during 2022 as i also predict one more leg in the equities makret including the Dow Jones. Complete euphoria moment for cryptocurrency

OTHERS strong bounce from 320B+ - ALTS rally soon.next possible resistance.
clear outbreak and trend to keep going higher for now.

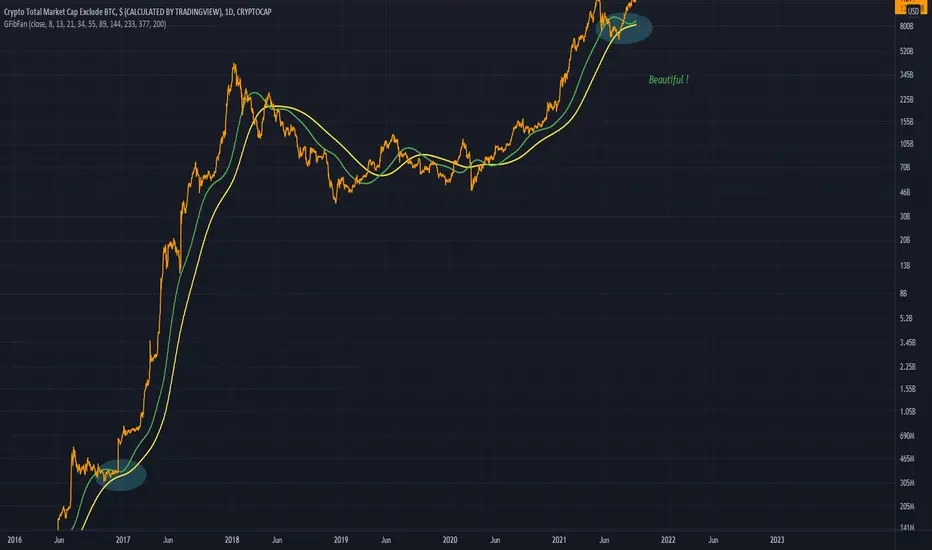
TOTAL marketcap excluding BTC; ALTCOINS macroTOTAL marketcap excluding BTC; ALTCOINS macro
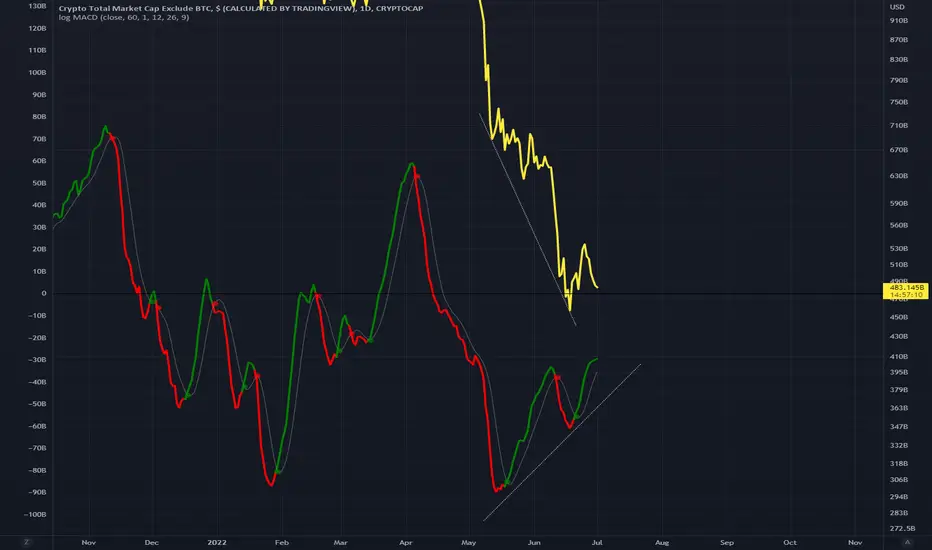
this is an update of an old macro idea, its linked, have updated where we are based on long term momentum indicator there and obvious similarities in cycle position and macro price action.
this whole thing is probably a rhyme..
we could be entering the final stage here.
it also lines up with other fractals im looking at in terms of peak timing.
gl and god speed.


TOTAL2 Analysis 4HR (altcoin market)Repeating ABCD pattern
Either this occurs or a breakout to the upside out of the channel that has formed on this timeframe
1234 and ABCD are separate formations, with ABCD forecasted to repeat
Linking a longer term analysis of the same ticker for those who are looking to hodl for a long time

TOTAL2 Cup and Handle ideaAn idea showing a cup and handle comparison with one we have already seen on the way up during this bullrun
Last time at this stage a bullish, very bullish move was experienced, will it play out like before?
Very different price action but I still consider both Cup and Handle

Altcoin need some breathing Altcoin have been bleeding and crashing this couple of days
because of massive btc rising price and btc dominance
but this support level are prove strong because it has been tested couple times in a short period of time

Why I think we are going up TOTAL2The recent break up above the 50MA is a bullish sign
We are in for another more rapid period of a bullrun
This is a chart for the Altcoin market
see attached

New example Idea regarding relationship of BTC.D against AltsLooking at previous two cases alts tend to crash later. Alts tend to follow BTC then just parabola, take dominance and rally when BTC starts to level off. It makes sense - retail is more involved with alts so more likely to react later. Also for smart money they would want to rotate out of BTC to take profit and look to put some of that profit into the alt market.
This idea is nothing more than example movements, and is not meant as attempting to establish either BTC top price, Alts Market Cap or BTC.D. Chart just published as a best guess of the three in conjunction.

ALTS Bullish 📈Altcoin market cap on the chart, as you can see we double bottomed out to break through that falling resistance line.
We then found ourselves on previous resistance and failing to break it.
I believe now we should have our last minor dip before we continue our bull run into November.
I have drawn out a path of which I think fits the run the best (obviously it wont follow it 1/1)

TOTAL2 An Avoided DeathcrossLooks like a very clean miss of the death cross
More bull action is coming based on this comparison to the early bull run
Looks great really