Bitcoin Monthly Update + Top Altcoins Choice, Your PickThis is a monthly Bitcoin chart and is really interesting, it supports without a shadow of doubt a strong continuation and bullish bias.
First, the month started red but is now green. This is always a strong signal when the action starts bad but recovers quickly during the month just to end up good. Starts red to end up closing green.
Bitcoin also closed four consecutive months green. This one will be the fifth month. Since the bears already gave everything trying to push prices lower and failed, we know higher prices are guaranteed next.
We also know this because Ethereum just hit its highest price since December 2021, near the top of the last bull market. Now we have Bitcoin, XRP and Ethereum, the top three Cryptos and the biggest projects, moving forward and doing great.
It is only natural. It is the logical sequence, the smaller pairs/projects will do the exact same.
Just as XRP gained in bullish momentum and hit a new all-time high, to follow Bitcoin, Ether did the same. Then we have Solana and Cardano, Dogecoin, Toncoin, Polkadot, Shiba Inu, Avalanche, Notcoin, Chainlink, Bitcoin Cash, Uniswap and the rest.
They are preparing to grow now and are bullish now. Ready to grow and strong.
No more retraces, no more corrections; the 2025 bull market wave & bull run is getting close.
The next immediate target is $137,206. Notice how the $122,630 target on this chart was hit perfectly. So these numbers are good and work long-term.
» After $137,206, Bitcoin is set to hit $155,000.
(Leave a comment with your Top Altcoins Choice, I will do an analysis for you!)
Thank you for reading.
Namaste.
Altcoins

Ethereum vs Small Cap. & The 2025-26 Cryptocurrency Bull MarketThe last three days ended up being a very nice flush, a strong one but the action quickly recovered above the 18-May low.
Ethereum was trading above $2,300 since mid-May and always stayed above this level. It broke suddenly below, out of nowhere, but the action is bullish again. We can say that this was a stop-loss hunt event, a bear-trap and nothing more or else we would see a continuation of the bearish action rather than a strong inverse reaction, a bullish jump.
It is not only Ethereum of course that is experiencing this type of bullish action, some altcoins are going nuts. Really crazy right now producing so much momentum that people are still wondering if the market is going down... Or is it going up?
It is obviously up, just look at the 7-April low.
Ethereum hit a low of $1,385 on 7-April. The higher low yesterday ended at $2,111.
You see what I mean?
The market is ultra-bullish because the last low is so far away. It is impossible that it will be tested even less possible for it to break. Ok, so a market shakeout we agree but now that the shakeout is complete what is supposed to happen next?
Watch the smaller altcoins.
Thank you for reading.
Namaste.
ETH - Eyes on a New All-Time High?ETHUSDT has been on fire lately, following a textbook bullish structure of Impulse → Fakeout → Impulse.
After breaking above the previous range in July, ETH confirmed strength with a sharp impulse move, only to shake out weak hands via a fakeout retest before pushing higher again. 📈
Currently, ETH is in the midst of another impulsive leg, with the next major target sitting at the ATH around $4,876.
📊 Key Notes:
- Fakeouts have served as liquidity grabs before strong rallies 🏹
- Current momentum favors the bulls 🐂
- As long as price holds above the last breakout zone (~$4,050–$4,150), the path of least resistance remains up.
🎯 Next Stop: ATH and beyond if bullish pressure sustains.
📚 Always follow your trading plan regarding entry, risk management, and trade management.
Good luck!
All Strategies Are Good; If Managed Properly!
~Richard Nasr

Ethervista · Recovery & Bullish WaveIt seems like September 2025 will be a great month to be in Crypto. That is really good.
Good afternoon my fellow Cryptocurrency trader, I hope you are having a very nice, wonderful, day.
The project is called Ethervista. The ticker is VISTAUSDT for this trading pair. We have an interesting chart setup, one that is strong. One that looks better than most of the recent ones because the next advance is already confirmed.
VISTAUSDT is trading above EMA55 and moving above EMA89 today. The break above EMA89 is happening after two strong rejections; one in May and the other one in July. Both times VISTAUSDT failed to conquer this level as resistance. Now that things are changing, EMA89 as resistance is no more. This is the blue dotted line on the chart.
This was the most important resistance to break. With the action happening above, we have a bullish bias fully confirmed. When a trading pair moves above this indicator on the daily timeframe, with market conditions as they are now, it means a bullish breakout can happen anytime. Even tomorrow or today. It can also extend a bit longer but on this zone advances tend to be fast and strong. This is no longer an accumulation zone but more like a free zone, where large price swings are possible and with a bullish market these things favor the upside.
The bearish impulse ended in March producing a major low. After VISTAUSDT moved lower to produced a lower low in June, now it has fully recovered. This recovery supports all the bullish signals mentioned before.
Oh! and there is a long-term higher low because the market bottom happened in October 2024.
Thank you for reading.
Namaste.

Moonbeam All-Time Low & Bullish Reversal—Trading 101 (PP: 1250%)GLMR (Moonbeam) has been trading at bottom prices and you know once we hit bottom, there is no other place left to go but up.
The all-time low happened in April 2025 and then we have a reversal pattern. The pattern is composed of lower highs and higher lows, the action converging and becoming compressed until finally a strong breakout happens.
We know the breakout will be bullish because of marketwide action. Ethereum (Ether) is trading at its highest price since December 2021. Bitcoin and XRP are trading at all-time highs and many of the strong projects are doing great. As the big projects grow, the smaller projects will follow. It is the natural sequence and how it always works.
GLMRUSDT has huge potential for growth as we are looking at true bottom prices. A ~1,250% target can be hit easily in the coming months. Another one around $0.66 gives 777%.
There is no need to use a stop-loss with this type of trade setup. Only one action is required here and that is to buy. After you buy, waiting comes naturally as nothing else can be done. When our target is reached; sell, collect profits and move on. Cryptocurrency Trading 101.
Namaste.

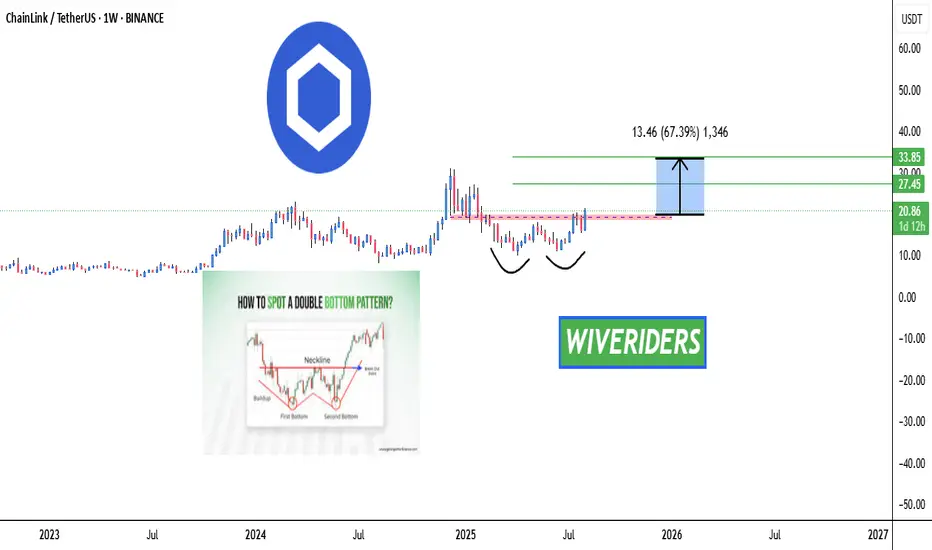
LINK Weekly Breakout Watch – Bullish Double Bottom Forming! 🚨 CRYPTOCAP:LINK Weekly Breakout Watch – Bullish Double Bottom Forming! 🔴📈
CRYPTOCAP:LINK is showing a bullish double bottom pattern on the weekly timeframe and is now testing the red resistance zone.
📊 If breakout confirms, next move could target:
🎯 First Target → Green line level 1
🎯 Second Target → Green line level 2
A breakout here could signal strong bullish continuation in the long term.
FARTCOIN Breakout Watch – Red Resistance Approaching! 🚨 $FARTCOIN Breakout Watch – Red Resistance Approaching! 🔴⏳
$FARTCOIN is approaching the red resistance zone.
📊 If breakout confirms, next move could target:
🎯 First Target → Green line level
A breakout could trigger bullish continuation and upside momentum.

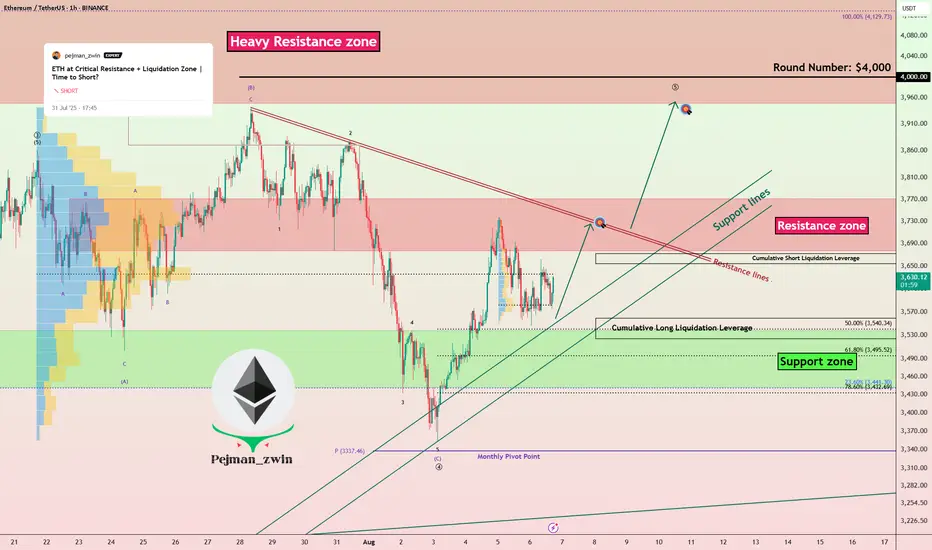
Ethereum Ready to Attack Resistances — Time to Long ETH?Ethereum ( BINANCE:ETHUSDT ) fell to the Support zone($3,538-$3,442) and Support lines as I expected in the previous idea .
Ethereum is currently trading near the Support zone($3,538-$3,442) , Support lines , and Cumulative Long Liquidation Leverage($3,559-$3,524) .
In terms of Elliott Wave theory , it seems that Ethereum has completed the main wave 4 . The main wave 4 has an Expanding Flat structure(ABC/3-3-5) . To confirm the main wave 4, we must wait for the Resistance zone($3,771-$3,677) and Resistance lines to be broken.
I expect Ethereum to trend higher in the coming hours and attack the Resistance lines and Resistance zone($3,771-$3,677) .
Cumulative Short Liquidation Leverage: $3,672-$3,645
Note: Stop Loss: $3,450 =Worst
Please respect each other's ideas and express them politely if you agree or disagree.
Ethereum Analyze (ETHUSDT), 1-hour time frame.
Be sure to follow the updated ideas.
Do not forget to put a Stop loss for your positions (For every position you want to open).
Please follow your strategy and updates; this is just my Idea, and I will gladly see your ideas in this post.
Please do not forget the ✅' like '✅ button 🙏😊 & Share it with your friends; thanks, and Trade safe.
Ethereum Hits a New All-Time High? Altcoins Bull MarketEthereum just hit its highest price since December 2024. Here is the thing, first XRP moves forward and we know the rest of the market will do the same. We saw this happen with Bitcoin Cash, it just kept on moving straight up and with this we knew the rest of the market to do the same. Then we have Litecoin and now Ethereum keeps on going higher. What one does, the rest follows.
Crypto will continue to grow; the altcoins will continue to grow and because the altcoins are growing Bitcoin will also continue growing. The altcoins growing and moving forward confirms that Bitcoin's top is not in, far from this being the case. So, Ether will continue to grow, Bitcoin will continue to grow and the smaller altcoins will follow.
Watch Solana go next and Dogecoin. Litecoin will be big of course. If you buy Litecoin now below $200, you will do good when Litecoin trades at $1,000 plus. The thing is that the next advance will change everything with the ETFs. Each time there is a bear market there is a crash and flush you can always buy again at market bottoms and lows. When a Crypto gets ETFs, corrections will not be the same. Demand will be too strong and we will experience long-term growth. Something like how Bitcoin is behaving now but also on some major altcoins. There will continue to be and appear new variations across the market. The altcoins will separate into different groups and cycles. The broader market cycle will continue to evolve. Things will never stay the same. Change is the only constant.
Namaste.

Shiba Inu Trades within Opportunity Buy Zone · Last ChanceShiba Inu grew more than 1,600% in October 2021. All this bullish action happened in just one month, under 30 days. These are the strong variations I keep talking about.
» Tezos's previous bull market lasted 714 days.
» Shiba Inu's previous bull market lasted 49 days (coming from the September 2021 low).
Since October 2021 SHIBUSDT has not seen a new bull market. After the all-time high there was a correction leading to the same pre-bull market support zone being activated but no new lows. We can see a long-term double-bottom and this is a signal of strength.
SHIBUSDT consolidated nicely in 2022 and there was a bullish jump in late 2023 leading into Q1 2024. This is the same move that produced big waves across the entire Cryptocurrency market. Here it was a minor event relatively speaking. If we were to compare this jump to bull market action, it is nothing really. The good news is that we are now entering a completely new market phase.
While we have higher lows in 2024 and 2025 compared to 2022 and 2023, the action for SHIBUSDT is still happening within the "opportunity buy zone." The same range used to buy before a major change of trend. This is mostly relevant for whales because they need years in order to create a position.
So Shiba Inu is in a new and strong accumulation zone ready to grow. Long-term higher lows, sideways and marketwide bullish action; the best is yet to come.
We are looking at bottom prices. You are looking at the lowest levels in 2025 before the bull market phase. There is still some time left but SHIBUSDT is ready to move ahead...
Time is running out.
Market conditions are great.
Simple strategy: Buy and hold.
Thank you for reading.
Namaste.

BTCD Bear Market Confirmed · Altcoins Bull Market ConfirmedThis is a rising wedge pattern and it broke for the first time after 792 days. We are looking at Bitcoin Dominance (BTC.D) on the monthly timeframe, super long-term.
A classic long-term double-bottom in 2022 launched a massive uptrend. This uptrend developed within a perfect rising wedge. Last month BTC.D broke this pattern with a full red candle and the highest volume since November 2024.
To add some perspective, the highest volume months were last month (red) and November 2024 (red). The highest volume before these two only happened during the climax of the 2021 bull market, so you can have an idea how strong the volume is this time around.
Since Bitcoin Dominance has an inverse relation with the growth in prices of the Cryptocurrency an Altcoins market, when Bitcoin Dominance was ultra bearish and crashing down, 2021, the Cryptocurrency market was ultra bullish and moving up. Seeing this major long-term signal, the highest bearish volume month to break a 792 days long uptrend, reveals the start of another major crash on this index. The major crash on this index is the confirmation of the late 2025 altcoins bull market.
Bitcoin and the altcoins market will continue growing on all terms.
Thanks a lot for your continued support.
If you agree, leave a comment.
Namaste.

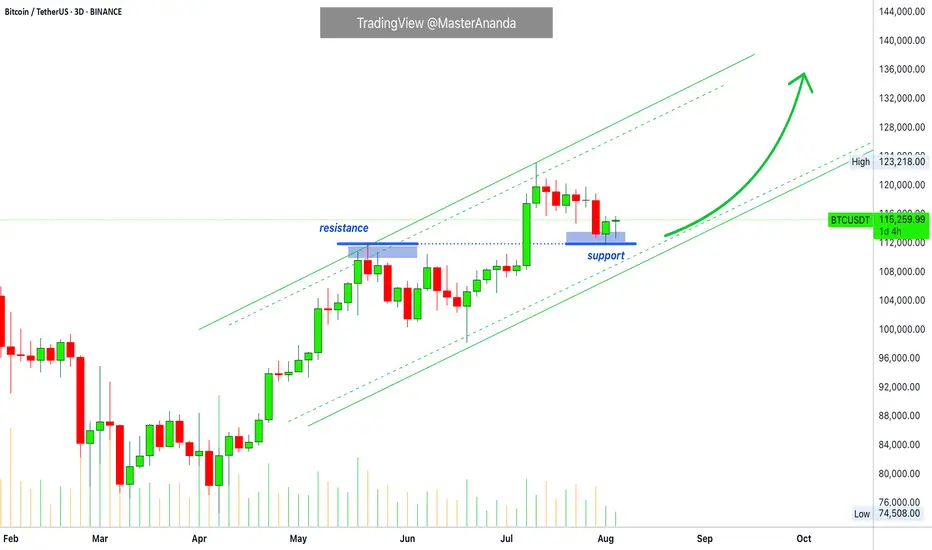
Bitcoin Update • Resistance Turned Support · TOP Altcoins ChoiceTraders hedge for a Bitcoin drop below $100,000?
Meanwhile, Bitcoin is rising trading above 115K. Resistance turned support.
The last all-time high turned out to work as support this time.
The retrace from 123,000 to 115,000 amounts to a 6.5% decline, which simply means that Bitcoin is trading at or near resistance. Staying close to resistance after a new all-time high is major signal of strength. A bearish signal would only become real if a high volume drop develops or Bitcoin closes weekly below 110,000. This isn't happening right now so the bulls win.
Are you a bull? You win.
I am a bull. I win.
👉 As Bitcoin continues bullish the altcoins market will continue to grow. Knowing this, which one is your Top Altcoin Choice ?
👉 Leave a comment with your favorite altcoin.
I will do a full analysis for you and publish in my profile.
If the chart doesn't look great, I might reply right here in the comments section.
Thanks a lot for the continued support. It is appreciated.
Let's play again.
Let's trade again.
Together we can win.
Success, profits and growth long-term.
Namaste.
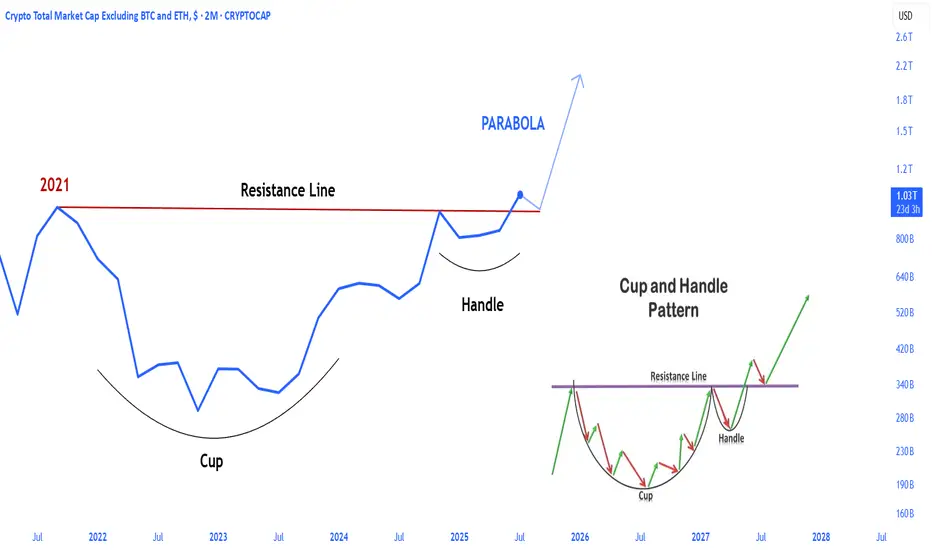
SOMETHING BIG IS COMING! ALTCOINSThe total3 index, an important metric for altcoins, broke out of the handle cup formation that began at the 2021 all-time high level. After the retest phase in the coming period, it will transition to a sharp rise phase.
Pippin · 5,895% Last Wave vs 3,000% Profits PotentialThis one looks good. Here the variation comes from the fact that in June there was a higher low compared to April, then again in July another higher low. Even before the last bullish wave we have higher lows and this is good.
PIPPINUSDT grew a massive 5,895% just 8 months ago. This reveals that this pair can do wild numbers. If done once, can happen again.
Then we have a full correction, the one that ended in April, and this is even better. Since the bullish move was corrected, it means a new one can develop. After the correction ended we have higher lows. Even when selling pressure was really strong (based on the volume) you can see how buyers were always present.
The next rise can hit an easy target of $0.208 for a massive 1,100%. A standard bull market with the current chart can yield 3,000% at $0.531. The end result can be something different.
Prices can end up moving up but not reaching our targets or everything can happen where prices move much higher. Lower is not likely and very low probability. 1,100% I would say is the minimum and an easy target because it was already hit in January 2025, much higher. With the higher lows in place, clear and strong, we aim for a higher high and that is a new all-time high. 3,000%. Seeing the 5,000% done easily months ago, we know it is possible and it is likely that it will be done. It is going to happen.
Namaste.

swarms · Opportunity Buy Zone · 1,100% - 4,700% Growth PotentialI like it. It might not look like it but this is a great chart. SWARMSUSDT is trading at bottom prices within the accumulation zone but with the possibility that the bottom is already gone. That is, no new shakeouts or lows. From here on, growth.
There was a low in April followed by a lower low in June. The lower low in June was nothing more than a liquidity hunt event. There is no real depth on that last low. Seeing how SWARMSUSDT is now trading back above support (the April low), opens up many bullish signals.
As long as SWARMS trades above 0.01900 you can be extremely bullish, the bulls are in control and have the upper-hand. Can start moving anytime.
Patience is key though.
Growth potential is huge because this is a small cap project. The numbers might seen big now but once the bullish euphoria is turned on, it will look and feel like an easy job. An easy job to grow 4,000%. Can be more but also less.
Namaste.

Pepe Update · 5th Dimensional Technical Analysis & Rising PricesThe energy changes. Do we really have to look at a chart?
The market sentiment is so different when the market is trending compared to when the market is sideways. The energy is very different when the market is dropping compared to when it is rising. We can tell what is coming based on how the market feels, but it is a bit paradoxical.
Good feelings, greed and a high level of certainty doesn't necessary means that the market will move in your direction. These are your feelings but not necessarily the market sentiment, how the market is feeling.
The first step then is to learn to distinguish between the market sentiment, how the market and its participants are doing and our own feelings, intuitions, perceptions, ideas, impulses and emotions.
Well, maybe that is too hard. Since it is very hard to learn to be aligned with the market and interpret the correct meaning of the different feelings we get in relation to prices, we can just use a chart.
Pepe produced a rounded bottom followed by a bullish jump. Pepe now again produced a new bottom pattern but this time a rising triangle and has been moving up for months, five months to be exact.
Five months rising but there is no rise. This is a very strong accumulation phase. Accumulation leads to a massive bullish jump. How are you feeling? Are you feeling low or are you feeling great?
The calm before the storm. The market tends to become depressed before a major bullish run. If not in prices, people become depressed in feelings, that is because all of their bearish friends are gone. We suffer because they are getting liquidated but there is light at the end of the tunnel, our profits are going up.
Stay bullish. Choose wisely. Keep reading. Bet LONG.
There is no point in being bearish when the market is going up.
Only now we are preparing for a massive bullish run.
Join the wave and you will profit, have fun and grow. It is very simple, we all buy and hold.
Namaste.
Linear Tezos · 2,000% 2025 Bull MarketThe same support zone from 2019, pre-massive 2021 bull market, is being activated ultra long-term, since November 2022. That is, XTZUSDT (Tezos) has been trading at bottom prices for almost three years.
Just a month within the current price range managed to support a 1,111%+ bull market, one that lasted 714 days. Who is to say that the next bull market will only last 2 months? I saw one of the top authors here saying that everything would end after just 1-2 months. Why not 2-3 years?
So Tezos grew for 714 days, higher highs and higher lows, a classic uptrend. Then it entered a bear market and went down for more than a year. So years going up and more than a year going down. And then the market went sideways for almost three years. Notice how everything last years. One year or more.
This chart and much more I've been seeing is letting me believe that we are set to experience an ultra, unusual, splendid, unique and long lasting bull market. It will be different. It will be the same in the sense that it happens every 4 years and we have massive marketwide growth. It will be different because some pairs will grow for months while others will continue to grow non-stop for a decade or more. Some pairs will grow for 2 years and then crash while others will grow 3 or 4. It is a mixed bag. It is a big market and it continues to evolve. This is awesome news, don't get it confused. This is the best possible news ever. We are used to fast and this gives little time for adaptation. Market conditions are different now. You will have all the time you need to become rich. The bull market is being turned on and it will never be turned off again, at least not for our generation.
Thank you for reading.
Tezos is going up long-term. Massive growth.
Namaste.

DOGE Breakout?After a 13 day rally and a 12 day pullback, could DOGE be breaking out and confirming a new 4H trading range?
After a bounce off the bullish orderblock DOGE has broken out of the diagonal downtrend, then pulled back to retest the previous diagonal resistance level as new support. This is a textbook breakout play & retest but this doesn't 100% guarantee the breakout will be successful. Should it be a successful breakout Local Resistance is the first clear level of interest for the bears to fight back.
This type of setup does give a clear invalidation should price fall back into the downtrend with acceptance. A fakeout could also lead to a loss of the Major Support level, that would introduce a potential revisit of $0.166.

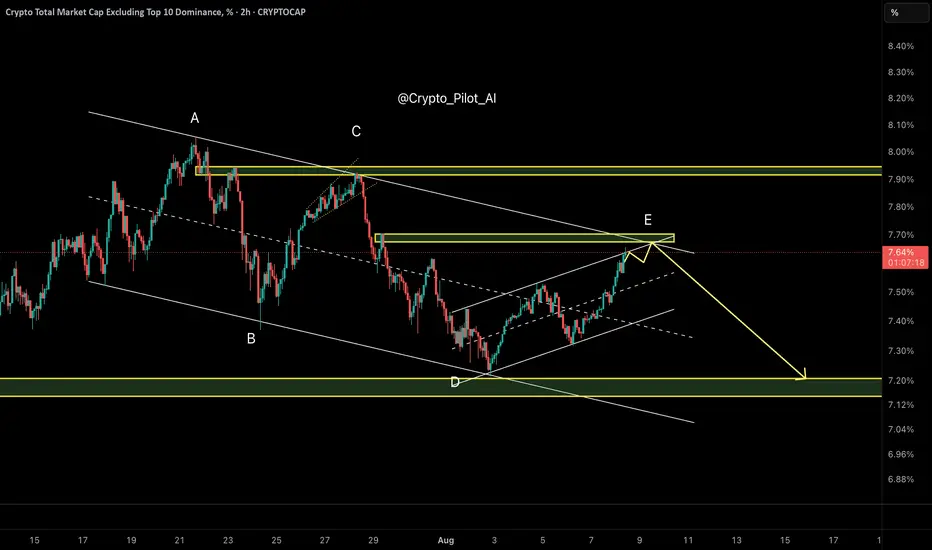
Is It Time for Altcoins to Dump? – OTHERS Dominance Final Wave As predicted in the last update, OTHERS.D reached the 7.20% demand zone precisely, showing a textbook reaction. The price has now rallied back toward the upper boundary of the descending channel and is testing the resistance area near 7.70%, where wave E likely completes within a Diametric structure (ABCDE).
This is a critical juncture: if rejected here, the next bearish wave could trigger an altcoin sell-off.
⸻
🔸 Market Structure:
• Diametric correction (ABCDE), with wave E likely terminating near 7.70%
• Price is testing the confluence of channel resistance and prior supply
🔸 Key Observations:
• Clear rejection signals are emerging around 7.70%
• No evidence of a sustained breakout yet
• Structure typically resolves with a deeper decline (wave F)
⸻
🔹 Scenario:
Base Case:
• Rejection from 7.70% supply
• Bearish continuation toward 7.20% demand
• Potential sweep down to 7.10–7.00% liquidity zone
Invalidation:
• Sustained breakout and acceptance above 7.80%
⸻
📌 Summary:
OTHERS.D is likely finalizing wave E. If this resistance holds, expect a bearish wave F and possible pressure on altcoins. Be cautious with heavy altcoin exposure until a confirmed breakout appears.
⸻
✅ Investment Strategy Selection:
Since declining OTHERS dominance = bearish for altcoins, you’d mark SHORT bias (expecting altcoin underperformance)
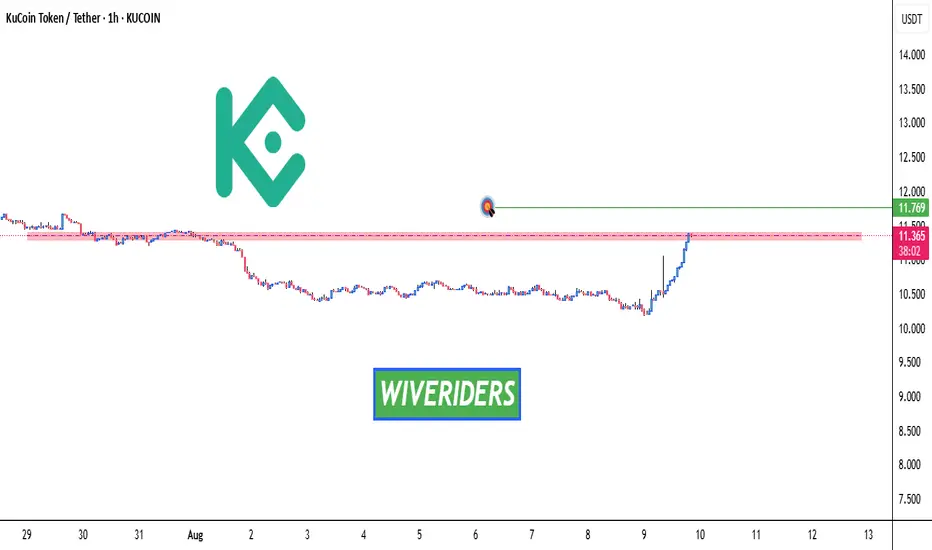
KCS Breakout Watch – Red Resistance Being Tested!🚨 KCS Breakout Watch – Red Resistance Being Tested! 🔴⏳
KCS is testing the red resistance zone.
📊 If breakout confirms, next move could target:
🎯 Next Target → Green line level
A breakout could trigger bullish continuation and upside momentum.
XTZ Breakout Alert – Red Resistance Cleared!🚨 SEED_DONKEYDAN_MARKET_CAP:XTZ Breakout Alert – Red Resistance Cleared! 🔴✅
SEED_DONKEYDAN_MARKET_CAP:XTZ has broken out of the red resistance zone.
📊 Breakout signals bullish momentum — next move could target the green line level.

XRP | Ripple Game Plan - Swing Long Idea📊 Market Sentiment
Overall sentiment remains bullish, supported by expectations of a 0.25% rate cut in the upcoming FOMC meeting. The weakening USD and increased risk appetite across global markets are creating favorable conditions for further upside in crypto assets.
📈 Technical Analysis
Price broke the bearish trendline that had been driving the downtrend since July 18th.
A strong breakout and close above the trendline confirmed the move.
The breakout area also aligns with a significant HTF key level, adding strength to this zone.
📌 Game Plan
Looking for a quick retest of the broken trendline and HTF key level before a rejection.
🎯 Setup Trigger
Confirmation will come from a clear 1H break of structure after the retest.
📋 Trade Management
Stoploss: Below the 1H swing structure that caused the break of structure
Targets: TP1: 3.57 | TP2: 3.66
Will trail stop aggressively to secure profits as the move develops.
💬 Like, follow, and comment if this breakdown supports your trading!
More setups and market insights coming soon — stay connected!

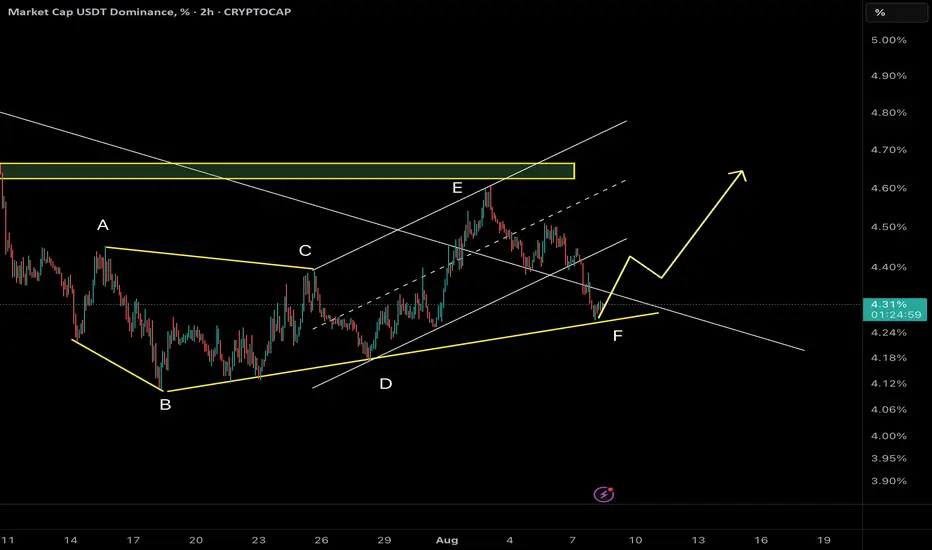
USDT Dominance – Precision Repeats: Final Wave F or Wave G Awake🔸 Market Structure:
Following the previous analysis, which precisely reached both projected targets, Tether Dominance continues unfolding its Diametric formation. After completing Wave E, price action has decisively shifted into Wave F, progressing toward the final stages of this structure.
⸻
🔸 Key Observations:
• The prior scenario anticipated a corrective decline, and price perfectly respected both the 4.40% and 4.28% targets before stabilizing.
• Currently, price is testing the ascending trendline and mid-range of the Diametric.
• Momentum remains corrective but has yet to show clear exhaustion.
⸻
🔹 Scenario 1 (Sc1) – Shallow Wave F Completion (~4.22%):
• Support around the minor ascending trendline.
• May trigger an early bounce if buyers step in.
• Less balanced geometrically for a clean Diametric conclusion.
🔹 Scenario 2 (Sc2) – Extended Wave F Completion (~4.12%):
• Aligns with the lower boundary of the Diametric.
• Provides better proportion and symmetry to finalize Wave F.
• Coincides with prior demand zone and the last reaction pivot.
• Statistically, this remains the higher probability path.
⸻
🎯 Expected Path:
Wave F is approaching maturity, and a deeper test near 4.12% remains likely before any sustainable reversal. Upon confirmation, this could trigger the start of Wave G upward, historically associated with altcoin weakness.
⸻
📌 Summary:
After executing the prior analysis with precision, USDT Dominance has advanced into the final legs of Wave F within the Diametric. Monitoring price behavior near 4.12% will be critical. A bounce here could catalyze Wave G and renewed pressure on altcoins. Should short-term support at 4.22% fail convincingly, deeper retracement becomes even more probable.
⸻
✅ Action Plan:
Closely track the reaction zones at 4.22% and 4.12%. A strong reversal signal (e.g., bullish divergence) could confirm the transition to Wave G.