SHIB Breakout Watch – Red Resistance Being Tested!🚨 CRYPTOCAP:SHIB Breakout Watch – Red Resistance Being Tested! 🔴⏳
CRYPTOCAP:SHIB is testing the red resistance zone.
📊 If breakout confirms, next move could target:
🎯 Target → Green line level
A breakout could trigger bullish continuation and upside momentum.
Altcoins

Ethereum Hits a New All-Time High? Altcoins Bull MarketEthereum just hit its highest price since December 2024. Here is the thing, first XRP moves forward and we know the rest of the market will do the same. We saw this happen with Bitcoin Cash, it just kept on moving straight up and with this we knew the rest of the market to do the same. Then we have Litecoin and now Ethereum keeps on going higher. What one does, the rest follows.
Crypto will continue to grow; the altcoins will continue to grow and because the altcoins are growing Bitcoin will also continue growing. The altcoins growing and moving forward confirms that Bitcoin's top is not in, far from this being the case. So, Ether will continue to grow, Bitcoin will continue to grow and the smaller altcoins will follow.
Watch Solana go next and Dogecoin. Litecoin will be big of course. If you buy Litecoin now below $200, you will do good when Litecoin trades at $1,000 plus. The thing is that the next advance will change everything with the ETFs. Each time there is a bear market there is a crash and flush you can always buy again at market bottoms and lows. When a Crypto gets ETFs, corrections will not be the same. Demand will be too strong and we will experience long-term growth. Something like how Bitcoin is behaving now but also on some major altcoins. There will continue to be and appear new variations across the market. The altcoins will separate into different groups and cycles. The broader market cycle will continue to evolve. Things will never stay the same. Change is the only constant.
Namaste.

Ethervista · Recovery & Bullish WaveIt seems like September 2025 will be a great month to be in Crypto. That is really good.
Good afternoon my fellow Cryptocurrency trader, I hope you are having a very nice, wonderful, day.
The project is called Ethervista. The ticker is VISTAUSDT for this trading pair. We have an interesting chart setup, one that is strong. One that looks better than most of the recent ones because the next advance is already confirmed.
VISTAUSDT is trading above EMA55 and moving above EMA89 today. The break above EMA89 is happening after two strong rejections; one in May and the other one in July. Both times VISTAUSDT failed to conquer this level as resistance. Now that things are changing, EMA89 as resistance is no more. This is the blue dotted line on the chart.
This was the most important resistance to break. With the action happening above, we have a bullish bias fully confirmed. When a trading pair moves above this indicator on the daily timeframe, with market conditions as they are now, it means a bullish breakout can happen anytime. Even tomorrow or today. It can also extend a bit longer but on this zone advances tend to be fast and strong. This is no longer an accumulation zone but more like a free zone, where large price swings are possible and with a bullish market these things favor the upside.
The bearish impulse ended in March producing a major low. After VISTAUSDT moved lower to produced a lower low in June, now it has fully recovered. This recovery supports all the bullish signals mentioned before.
Oh! and there is a long-term higher low because the market bottom happened in October 2024.
Thank you for reading.
Namaste.

FARTCOIN Breakout Watch – Red Resistance Approaching! 🚨 $FARTCOIN Breakout Watch – Red Resistance Approaching! 🔴⏳
$FARTCOIN is approaching the red resistance zone.
📊 If breakout confirms, next move could target:
🎯 First Target → Green line level
A breakout could trigger bullish continuation and upside momentum.

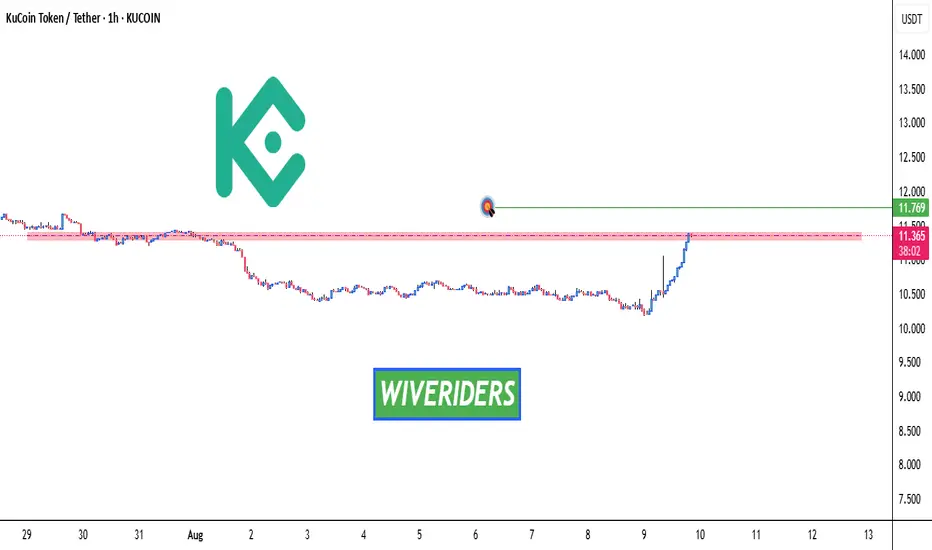
KCS Breakout Watch – Red Resistance Being Tested!🚨 KCS Breakout Watch – Red Resistance Being Tested! 🔴⏳
KCS is testing the red resistance zone.
📊 If breakout confirms, next move could target:
🎯 Next Target → Green line level
A breakout could trigger bullish continuation and upside momentum.
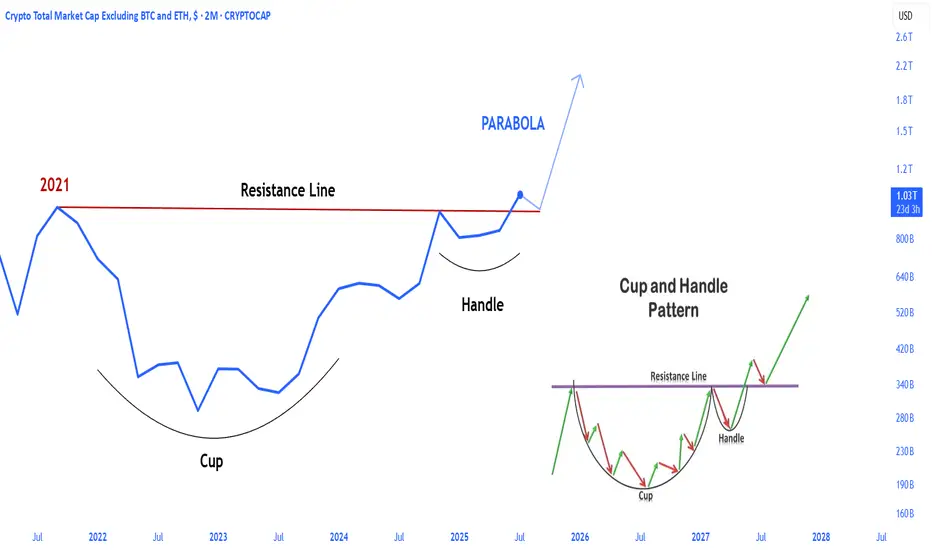
SOMETHING BIG IS COMING! ALTCOINSThe total3 index, an important metric for altcoins, broke out of the handle cup formation that began at the 2021 all-time high level. After the retest phase in the coming period, it will transition to a sharp rise phase.
ETH | Swing Long IdeaETH | Swing Long Idea
📊 Market Sentiment
Overall sentiment remains bullish, supported by expectations of a 0.25% rate cut in the upcoming FOMC meeting. A weakening USD and increased risk appetite across global markets are creating favorable conditions for further upside in crypto assets.
📈 Technical Analysis
Price has run the HTF liquidity level at $4100.
While the breakout above $4100 was aggressive, it appears price may require additional liquidity before pushing higher.
This idea focuses on a possible ETH retracement and continuation pattern over the coming days to weeks.
📌 Game Plan
If a deep retracement occurs, I’ll be watching the 0.5 Fibonacci discount zone and the 0.75 retracement level for optimal entries.
Key focus: daily demand zone at $3750 — ideally aligned with the 0.75 retracement.
I won’t wait for an exact touch of the 0.75 level; instead, I’ll watch for strength and a clear break of structure to trigger entries.
🎯 Setup Trigger
Look for a 12H–4H break of structure shift after the daily demand zone at $3750 is hit.
📋 Trade Management
Stoploss: 12H–4H swing low that caused the break of structure
Targets:
TP1: $4088
TP2: $4330
TP3: $5000 (possible swing point)
Will trail stops aggressively to secure profits as price moves in my favor.
💬 Like & follow if you found this breakdown helpful — more setups coming soon!

Shentu (CTK) Breaks Above MA200 · 415% Easy Target MappedLook here. First notice the volume. Immediately you see green bars sticking out. Since we have a low but some mixed action also, this volume signal is the first thing that will tell us that the bulls are in the game. If it isn't showing on the price, it will do eventually.
Then we notice the entire chart, the structure. On the left side we had a downtrend and then a major low. Many people can assume that after the bounce a bearish continuation is the next logical step. They would say that it is already dropping and it should continue doing so until there is proof of something different. But we already saw the volume signal and we also know the bigger picture, the market never stays the same. It fluctuates, so we are always looking to exploit this transition period, this moment of change.
After the correction bottom we have no new lows. CTKUSDT (Shentu) is moving above MA200. This level is matching perfectly the 3-February low. This is the final resistance. Once above this level, which is already happening, expect bullish momentum to grow; maximum speed up and the highest prices since 2021 or even ever. The highest ever. This is where we are going.
Thank you for reading.
Namaste.

$PROVE (PROVE) 4HPrice rallied sharply to $1.52 before retracing, showing early signs of local profit-taking. Current consolidation above $1.35 keeps the short-term bullish structure intact. Watching for a potential retest of $1.25–$1.28 as support before the next leg higher.
$PROVE is gaining traction as a newly listed token with increasing on-chain activity and early investor interest. Liquidity remains healthy post-launch, and positive sentiment is building as more exchanges consider listing it.

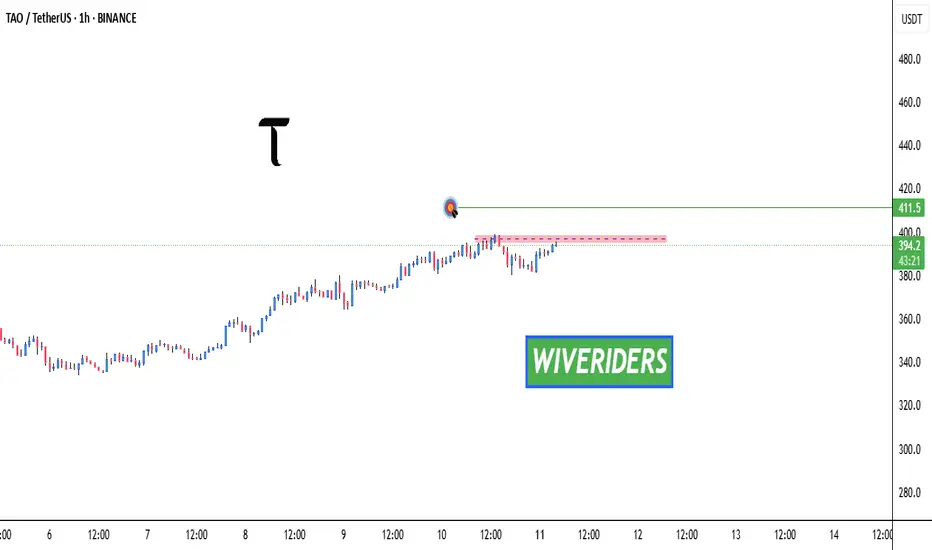
TAO Breakout Watch – Red Resistance Being Tested!🚨 TAO Breakout Watch – Red Resistance Being Tested! 🔴⏳
TAO is testing the red resistance zone.
📊 If breakout confirms, next move could target:
🎯 First Target → Green line level
A breakout could trigger bullish continuation and upside momentum.
PENGU Breakout Watch – Red Resistance Being Tested! 🚨 PENGU Breakout Watch – Red Resistance Being Tested! 🔴⏳
PENGU is testing the red resistance zone.
📊 If breakout confirms, next move could target:
🎯 First Target → Green line level
A breakout could trigger bullish continuation and upside momentum.

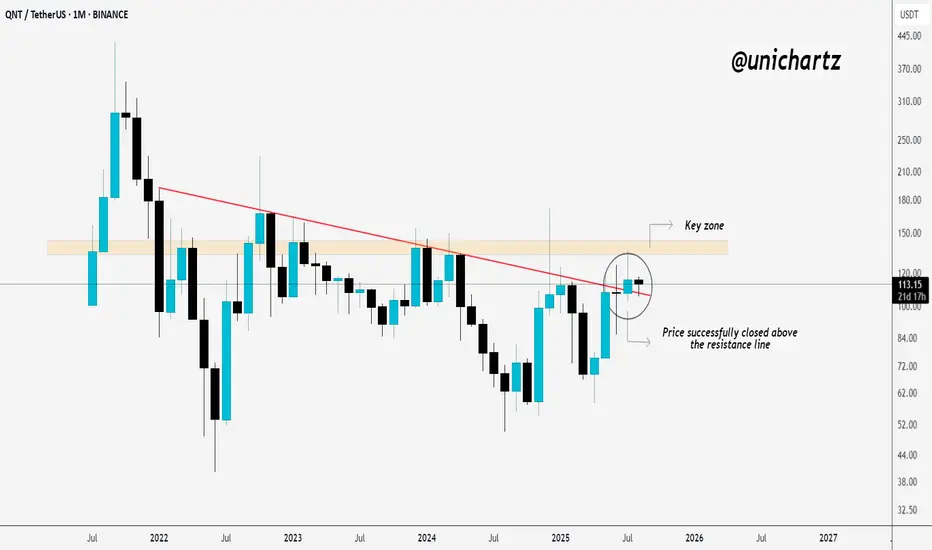
QNT at Breakout Point — Could This Be the Start of a $200+ RallyOn the monthly timeframe, GETTEX:QNT is looking strong. Price recently broke and closed above the long-term resistance trendline and is now sitting just below a key resistance zone.
If bulls push it through this zone and we get a confirmed close above, the path toward $200, $250, and beyond opens up.
I’m keeping this on my watchlist and monitoring closely for a breakout confirmation.
Do you think QNT will break this level on its first attempt, or will we see a pullback before the next leg up?
Alts Crypto Game PlanAs you can see the triangle at BTC dominance has met the minimum norms.
I think:
1) The setback will reach 0.382 - 0.5% level of the micro degree, after which we may see another decline to finish the micro degree 5.
2) A Zizgzag, correcting the Minor degree 5.
3) And another intermediate 5-wave downward wave, because the first 5 downward waves are usually never the end. It is usually a complex double combined zigzag.

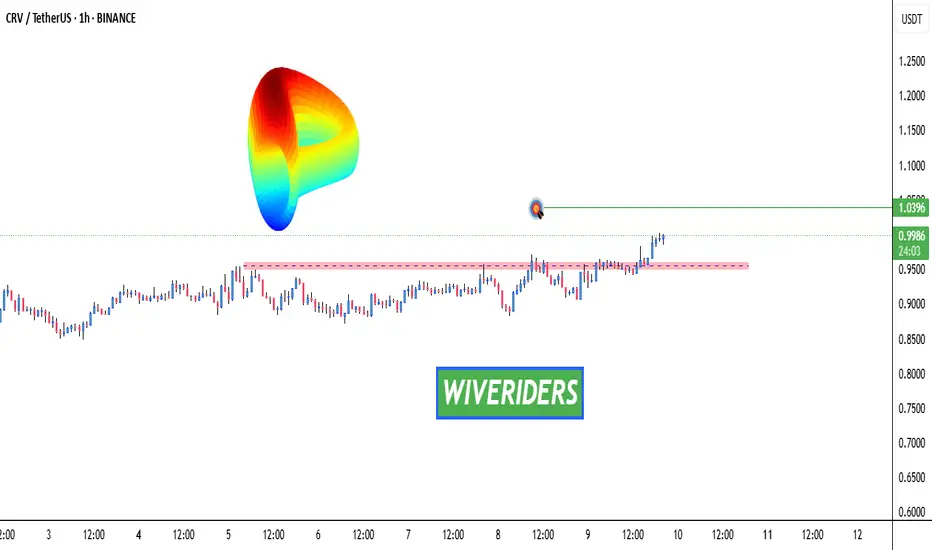
CRV Breakout Alert – Red Resistance Cleared!🚨 CRV Breakout Alert – Red Resistance Cleared! 🔴✅
CRYPTOCAP:CRV has successfully broken out of the red resistance zone.
📊 Next move could target the green line level.
🔥 Buyers showing strong momentum —
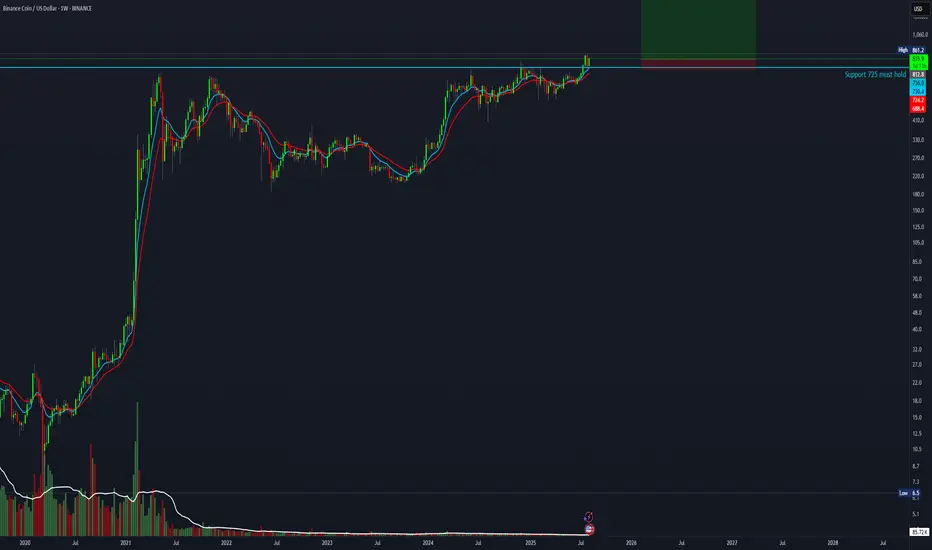
25R setup for BNBEveryone is talking about ETH right now, but don’t forget about this monster — BNB. BNB is about to break out after a successful retest of macro support. Where’s the end after the $850 breakout? Do you really want to bet against CZ? Stop-loss below support at $725.
Good luck — not financial advice.
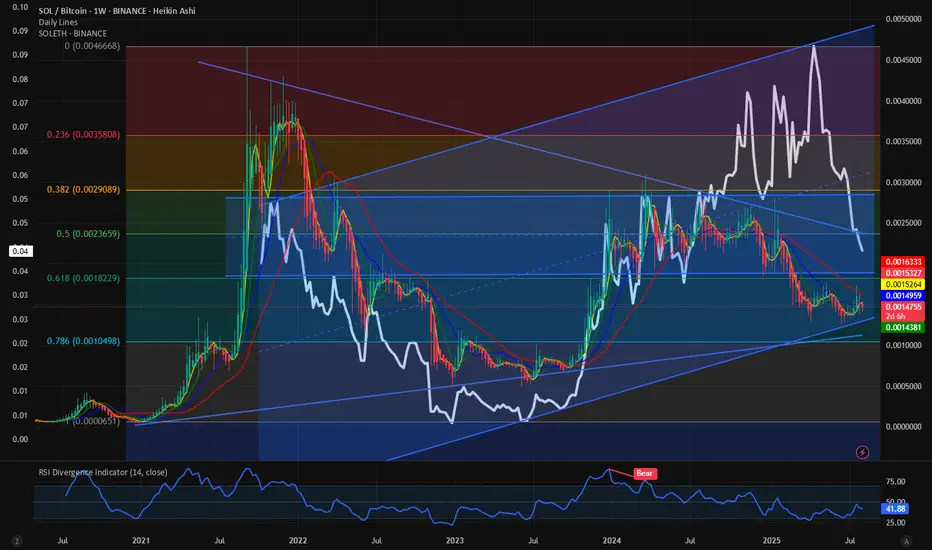
$SOLBTC Broke down. Same with $SOLETH. Will it rebound? We peaked in CRYPTOCAP:BTC.D chart as we predicted here.
CRYPTOCAP:BTC weathering the storm: CRYPTOCAP:BTC.D close to 66%. CRYPTOCAP:BTC to 160K. for BITSTAMP:BTCUSD by RabishankarBiswal — TradingView
Since then, Altcoins have shown signs of strength and CRYPTOCAP:ETH.D is bouncing back with BITSTAMP:ETHUSD at 4000 $. Please check my CRYPTOCAP:ETH.D blog here.
CRYPTOCAP:BTC.D : Cycle tops are in. CRYPTOCAP:ETH.D : Bounce form the all-time lows for CRYPTOCAP:BTC.D by RabishankarBiswal — TradingView
CRYPTOCAP:SOL being one of the large caps within the Altcoin must participate for the Altcoin summer to happen. But when we plot the BINANCE:SOLBTC and BINANCE:SOLETH then we see a broken chart with a fall from the cliff. On July 6th I wrote theta §SOLBTC looks bearish and we might find it difficult to break out of the range 0.0025 to 0.00125.
BINANCE:SOLBTC : Little strength to show for. for BINANCE:SOLBTC by RabishankarBiswal — TradingView
I put the BINANCE:SOLETH on the same chart and I was surprised how perfectly fit between the Fib retracement level. 😊 Now we would like to see where this chart goes and where does it bounce back. We see that the favorite range where BINANCE:SOLETH spends most of the time is between 0.053 to 0.04. Currently the ratio is at 0.044. My estimate is that the ratio will bounce back from the psychological level of 0.04 and then bounce atleast to 0.06 which is the mid-point of the upward slopping channel on $SOLETH.
Verdict: Altcoin summer is on. BINANCE:SOLETH is short term bearish but medium term bullish with 0.06 as target.
XRP | Ripple Game Plan - Swing Long Idea📊 Market Sentiment
Overall sentiment remains bullish, supported by expectations of a 0.25% rate cut in the upcoming FOMC meeting. The weakening USD and increased risk appetite across global markets are creating favorable conditions for further upside in crypto assets.
📈 Technical Analysis
Price broke the bearish trendline that had been driving the downtrend since July 18th.
A strong breakout and close above the trendline confirmed the move.
The breakout area also aligns with a significant HTF key level, adding strength to this zone.
📌 Game Plan
Looking for a quick retest of the broken trendline and HTF key level before a rejection.
🎯 Setup Trigger
Confirmation will come from a clear 1H break of structure after the retest.
📋 Trade Management
Stoploss: Below the 1H swing structure that caused the break of structure
Targets: TP1: 3.57 | TP2: 3.66
Will trail stop aggressively to secure profits as the move develops.
💬 Like, follow, and comment if this breakdown supports your trading!
More setups and market insights coming soon — stay connected!

ETH | Ethereum Game Plan - Swing Long IdeaETH | Ethereum Game Plan - Swing Long Idea
📊 Market Sentiment
Market sentiment remains bullish, supported by expectations of a 0.25% rate cut at the upcoming FOMC meeting. The weakening USD and rising risk appetite across global markets are favoring crypto assets in particular.
📈 Technical Analysis
Price swept the range low (Weekly Fair Value Gap), resulting in a deviation.
It then aggressively reclaimed higher levels and closed above key resistance.
A 12H demand zone was formed during this move.
We’re now seeing a retracement towards that 12H demand zone.
📌 Game Plan
I’m looking for price to hit the 12H demand zone at $3,530 and show a strong reaction.
This level is also below the 0.5 Fibonacci retracement, placing it in the discount area — an ideal entry zone for me.
🎯 Setup Trigger
After price taps the demand zone, I want to see a 1H–4H bullish break of structure to confirm the reversal before entering.
📋 Trade Management
Stoploss: Below 1H–4H swing low
Targets:
• TP1: $3,872
• TP2: $4,090
I’ll trail my stop to lock in profits aggressively as price moves in my favor.
💬 Like, follow, and comment if this breakdown supports your trading!
More setups and market insights coming soon — stay connected!

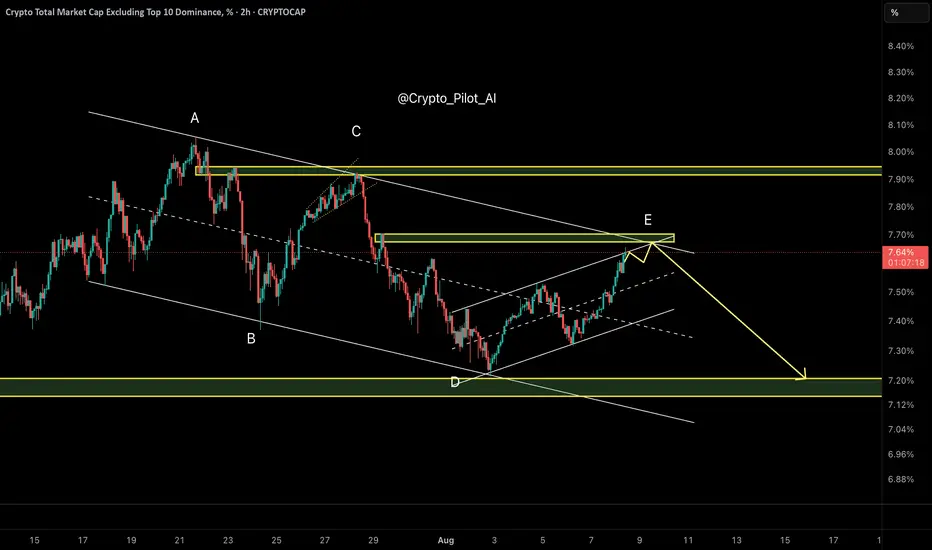
Is It Time for Altcoins to Dump? – OTHERS Dominance Final Wave As predicted in the last update, OTHERS.D reached the 7.20% demand zone precisely, showing a textbook reaction. The price has now rallied back toward the upper boundary of the descending channel and is testing the resistance area near 7.70%, where wave E likely completes within a Diametric structure (ABCDE).
This is a critical juncture: if rejected here, the next bearish wave could trigger an altcoin sell-off.
⸻
🔸 Market Structure:
• Diametric correction (ABCDE), with wave E likely terminating near 7.70%
• Price is testing the confluence of channel resistance and prior supply
🔸 Key Observations:
• Clear rejection signals are emerging around 7.70%
• No evidence of a sustained breakout yet
• Structure typically resolves with a deeper decline (wave F)
⸻
🔹 Scenario:
Base Case:
• Rejection from 7.70% supply
• Bearish continuation toward 7.20% demand
• Potential sweep down to 7.10–7.00% liquidity zone
Invalidation:
• Sustained breakout and acceptance above 7.80%
⸻
📌 Summary:
OTHERS.D is likely finalizing wave E. If this resistance holds, expect a bearish wave F and possible pressure on altcoins. Be cautious with heavy altcoin exposure until a confirmed breakout appears.
⸻
✅ Investment Strategy Selection:
Since declining OTHERS dominance = bearish for altcoins, you’d mark SHORT bias (expecting altcoin underperformance)
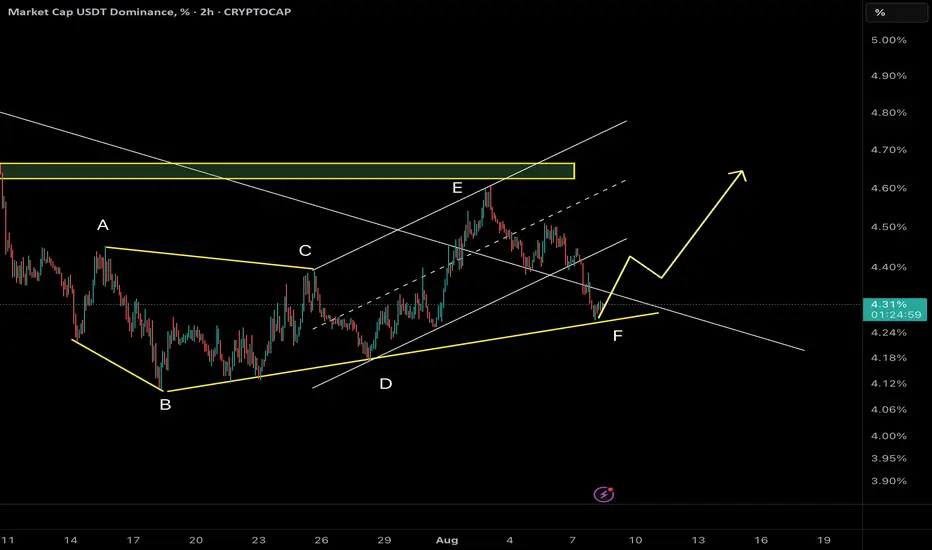
USDT Dominance – Precision Repeats: Final Wave F or Wave G Awake🔸 Market Structure:
Following the previous analysis, which precisely reached both projected targets, Tether Dominance continues unfolding its Diametric formation. After completing Wave E, price action has decisively shifted into Wave F, progressing toward the final stages of this structure.
⸻
🔸 Key Observations:
• The prior scenario anticipated a corrective decline, and price perfectly respected both the 4.40% and 4.28% targets before stabilizing.
• Currently, price is testing the ascending trendline and mid-range of the Diametric.
• Momentum remains corrective but has yet to show clear exhaustion.
⸻
🔹 Scenario 1 (Sc1) – Shallow Wave F Completion (~4.22%):
• Support around the minor ascending trendline.
• May trigger an early bounce if buyers step in.
• Less balanced geometrically for a clean Diametric conclusion.
🔹 Scenario 2 (Sc2) – Extended Wave F Completion (~4.12%):
• Aligns with the lower boundary of the Diametric.
• Provides better proportion and symmetry to finalize Wave F.
• Coincides with prior demand zone and the last reaction pivot.
• Statistically, this remains the higher probability path.
⸻
🎯 Expected Path:
Wave F is approaching maturity, and a deeper test near 4.12% remains likely before any sustainable reversal. Upon confirmation, this could trigger the start of Wave G upward, historically associated with altcoin weakness.
⸻
📌 Summary:
After executing the prior analysis with precision, USDT Dominance has advanced into the final legs of Wave F within the Diametric. Monitoring price behavior near 4.12% will be critical. A bounce here could catalyze Wave G and renewed pressure on altcoins. Should short-term support at 4.22% fail convincingly, deeper retracement becomes even more probable.
⸻
✅ Action Plan:
Closely track the reaction zones at 4.22% and 4.12%. A strong reversal signal (e.g., bullish divergence) could confirm the transition to Wave G.
DOGE Breakout?After a 13 day rally and a 12 day pullback, could DOGE be breaking out and confirming a new 4H trading range?
After a bounce off the bullish orderblock DOGE has broken out of the diagonal downtrend, then pulled back to retest the previous diagonal resistance level as new support. This is a textbook breakout play & retest but this doesn't 100% guarantee the breakout will be successful. Should it be a successful breakout Local Resistance is the first clear level of interest for the bears to fight back.
This type of setup does give a clear invalidation should price fall back into the downtrend with acceptance. A fakeout could also lead to a loss of the Major Support level, that would introduce a potential revisit of $0.166.

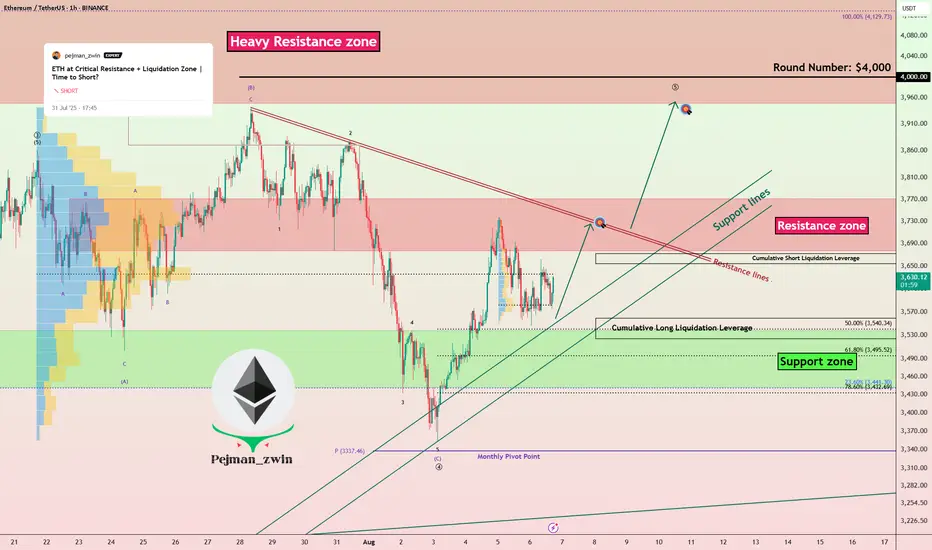
Ethereum Ready to Attack Resistances — Time to Long ETH?Ethereum ( BINANCE:ETHUSDT ) fell to the Support zone($3,538-$3,442) and Support lines as I expected in the previous idea .
Ethereum is currently trading near the Support zone($3,538-$3,442) , Support lines , and Cumulative Long Liquidation Leverage($3,559-$3,524) .
In terms of Elliott Wave theory , it seems that Ethereum has completed the main wave 4 . The main wave 4 has an Expanding Flat structure(ABC/3-3-5) . To confirm the main wave 4, we must wait for the Resistance zone($3,771-$3,677) and Resistance lines to be broken.
I expect Ethereum to trend higher in the coming hours and attack the Resistance lines and Resistance zone($3,771-$3,677) .
Cumulative Short Liquidation Leverage: $3,672-$3,645
Note: Stop Loss: $3,450 =Worst
Please respect each other's ideas and express them politely if you agree or disagree.
Ethereum Analyze (ETHUSDT), 1-hour time frame.
Be sure to follow the updated ideas.
Do not forget to put a Stop loss for your positions (For every position you want to open).
Please follow your strategy and updates; this is just my Idea, and I will gladly see your ideas in this post.
Please do not forget the ✅' like '✅ button 🙏😊 & Share it with your friends; thanks, and Trade safe.
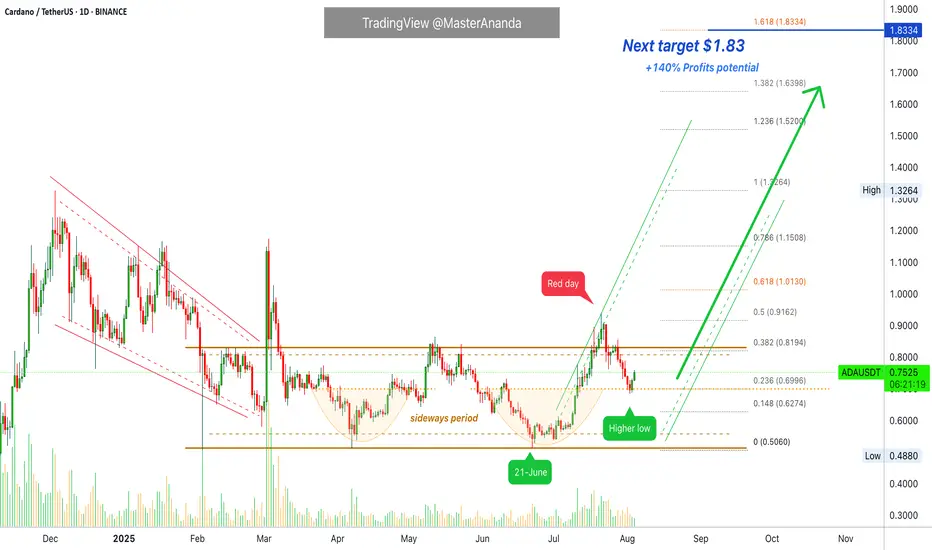
Cardano Higher High Hidden Signal Confirmed · UpdateGood news. We already have a higher low and Cardano back into the long-term accumulation zone but on the bullish side. You know a channel has a middle portion always and the lower portion relates to the bears while the upper portion is owned by the bulls. This is the good news, Cardano is staying safely, nicely on the bullish side of the 2025 consolidation channel. Cardano has been in this range almost the entire year but everything looks great.
The broader bias is bullish based on the strong advance late last year. This was a strong advance and every strong move needs to be consolidated before anything else happens. This is the correction followed by sideways action. After this phase is over, now, then we see a new move develop, the continuation of the previous move—the bullish wave.
We have 140% profits potential (PP) to $1.83 but this is still some middle way, mild, middle portion move. The market will continue to heat up, evolve and grow and as this happens we will be taking out several resistance zones and with these gone we can expect higher prices and finally the new all-time high we have been waiting for for so long. Patience of course.
Chart: Cardano (ADAUSDT) Daily Timeframe with MA200
Notice just three days below MA200 and now back above this level. In the past when ADAUSDT moved below MA200 it would stay months below this level. This time it was pierced briefly and the action moves back above. This means that the bulls are in control.
The retrace was short, small and low volume which means weak. Weak bears, weak sellers means that we are bullish and bullish means green.
With all this said and done, you can expect growth for months. Continue to buy, continue to trust and continue to hold. You will be happy with the results. Crypto is going up.
Energy for all readers. Let's grow together, let's be open, learn and share. The best is yet to come. You are special. You are a divine living being and you deserve the best... Thanks a lot for your continued support.
Namaste.