$SUI follow up for June 2025CRYPTOCAP:SUI has tapped my support zone around $2.85, which is currently holding well.
That said, the broader trend remains corrective, and it's likely only a matter of time before this support gives way.
If that happens, we could see a drop into my green buy zone — sitting just below a major order block. A break there might trigger heavy liquidations and a sharp move to the next support level.
I don't expect a deeper crash, as bulls are showing strong activity to defend this area.
If you set buy orders around this zone, a solid bounce could offer attractive profits.
As always, DYOR.
This is a follow up for this idea from May 2025
Altcoins

PARTI Near Bottom, Perfect Bottom; Wait Two Months (185%+)Particle Network is showing no momentum on the drop. The peak happened 13-May, more than 40 days ago. I think it is easy to say—or fair to say—that the correction has run its course, it is reaching its end.
Near bottom or perfect bottom? Think about it.
Can you catch a perfect bottom? Yes. No. Maybe.
Is it necessary? Absolutely not.
That's the thing. The bottom might not be in or might be in, but we don't want to catch a perfect bottom we just want to buy near support. Trading low and close to a reversal. That's exactly what we have here.
If it keeps on going lower it goes lower for a few more days or a few weeks. Once the rise starts, it will be strong.
Forty days moving lower. 24 days lasted the bullish jump.
So the drop can last 40 days, 45 days, 50 days... More or less. Not much longer.
Even 20 days would be a decent wait but once the bullish action starts it is a sure win.
Say you aim at a target of 0.57 with profits potential exceeding 185%. With this in mind, would you wait 2-3 months?
If you trade 1 BTC, it is worth the wait.
0.10 BTC that is also ok.
If your position size is 10K, a win after 3 months can produce 28.5K.
Sounds good—looks reasonable, an easy wait.
Perfect bottom or trading low near support?
It all depends on your trading style, your capital and your goals.
Spot trading = buy and hold.
By the way, we got the first PARTIUSDT wave, let's go for the second one. Looks like an easy trade.
Thank you for reading.
Namaste.

MACD Divergence Flashing Red, Could This Trigger a -30% Crash?Hey Realistic Traders!
Bearish Reversal Signal Flashing on BINANCE:ETHUSDT , Is the Bull Run Over?
Let’s Break It Down..
On the daily timeframe, Solana (SOL) has formed an ascending broadening wedge, which has now broken to the downside through both the lower trendline and a major support zone, indicating a shift in market structure.
Price action has also remained consistently below the 200-day EMA, signaling a potential transition from a bullish to a bearish trend.
A bearish divergence has appeared on the MACD indicator, where price makes higher highs while the MACD forms lower highs. This divergence indicates that buying momentum is weakening, even as the price pushes higher. Such a pattern often precedes a trend reversal and supports the expectation that the price may continue to move lower.
Given these technical signals, the price is likely to continue moving lower toward the first target at 1849.07, with a possible extension to the second target at 1534.44.
This bearish outlook remains valid as long as the price stays below the stop-loss level, currently marked at 2734.40. A move above this level would invalidate the bearish setup.
Support the channel by engaging with the content, using the rocket button, and sharing your opinions in the comments below.
Disclaimer: "Please note that this analysis is solely for educational purposes and should not be considered a recommendation to take a long or short position on ETHUSDT.

Bitcoin Weekly, Not Good But... Opportunities AboundI cannot say about the weekly timeframe the same I said for the daily, the situation here is different. The chart looks bad. The weekly close changes nothing.
If Bitcoin moves and closes weekly above $106,000, this can be good news, but any trading below this level has bearish potential. It can be a period of bullish consolidation but the bearish potential cannot be ignored. So, I will keep it short. Bitcoin remains in doubt on the weekly timeframe.
Bullish above $100,000. Bearish below $100,000.
It has been six weeks with Bitcoin moving with basically no change.
Last week's action did produce some loses for some traders, but for us the market remains the same. We focus on the altcoins, ignore Bitcoin for now, there is no growth and the action is still happening near resistance; at short-term support but overall, closer to a top than a bottom. It is risky to say the least. Many altcoins are trading at bottom prices and growing strong. We go for the low risk vs high potential for reward chart setups. We don't mind the market shaking, evolving or reacting to some geopolitical event, we do care about making the right choices... Focus on the altcoins for now, and for long...
Hold on. I shall give you more information.
Bearish action is indeed present but still weak.
Bearish volume is very low.
The fact that more than 1B worth of leveraged positions were liquidated calls for a pause. Each and every time this amount of money is taken out of peoples hands and transferred to the exchanges, the market changes direction. Regardless of the signals, the bigger picture or the long-term. This is a huge transfer, the whales are getting richer, retail is getting rekt.
So, the market is likely to shake some more. This is only because Bitcoin is trading way too high and hasn't produced any significant retrace after considerable growth. Again, we buy those trading low near support. We sell those trading high near resistance. As long as this is the MO, we are sure to win in the long-run.
I wouldn't want to buy-long a project that is crashing when there are others growing, yet to grow and with huge potential for growth.
Remember, the market is big now, Bitcoin is very strong above 100K. It can happen that Bitcoin goes on a retrace while the altcoins move ahead. Money flowing out of the big projects reaches the smaller projects, classic bull market dynamic. Nothing surprising; opportunities are endless.
Thanks a lot for your continued support.
Namaste.

Final Shakeout Complete, Bullish On Everything —The Wait Is OverToday the Cryptocurrency market completes its final shakeout. From now on, we are bullish —everything grows (altcoins).
This is an early signal but confirmation comes from the fact that many altcoins, specifically stable long-term projects, are moving ahead with force, some growing even three digits in a single day, while Bitcoin is producing a shakeout. There is more.
Bitcoin wicked below 100K but is set to close above this level. Even if it closes below a recovery is very likely to follow immediately. At this point, ignore Bitcoin and focus on the altcoins.
👉 We are ultra-hyper bullish on the altcoins market.
This is a friendly reminder my friend.
The wait is over.
Namaste.

Fun Token: March 2026 New All-Time High? It Will Be FunA very strong bullish signal is present on this chart and we have some interesting price dynamics as well and a time-fractal to consider.
Good evening my fellow Cryptocurrency trader, how are you feeling today?
There was a very strong market flush recently with FUNUSDT (Fun Token), removing all LONGs and all SHORTs between December 2024 and April 2025.
After December, there was a crash producing a major low. The lowest prices in 5 years, since March 2020. Then immediately there was a strong rise producing the highest prices since December 2023. Then a retrace and the action goes back to baseline.
The multiple years long low removes all LONGs. The more than a year strong high removes all SHORTs. A full market flush.
The very strong bullish signal is related to the low point from June 2023. As the present retrace ends, the action is back above this level and this is super-bullish.
From March 2020 through late March 2021 we have 55 candles and 385 days. The same would give us a date of 30 March 2026 for the new ATH. That is if FUNUSDT grows in exactly the same way. This is just an entertaining exercise. This bull market can last 221 days, 180 days, 360 days... Anything goes. It can last 465 days for all I know, but, if the same pattern repeats, we have an entire year to see the market grow.
The exact date? The exact high? Anything goes.
What cannot be doubted is the fact that the Cryptocurrency market is set to produce the strongest growth period since 2021. It will be FUN.
Namaste.

Gains Network Consolidation At Market Bottom, 1,176% Profits PotGains Network hit bottom in early February. Consolidation at the lows has been ongoing now for 133 days. This phase is reaching its end.
This is truly a wonderful chart, a great trade-setup. Many altcoins hit bottom in April, some even earlier and did so in March. The earlier the bottom, the stronger the pair. This one hit bottom in February which means that buyers were always present in the ensuing months. As the overall market continued to hit new lows, Gains Network was growing from its base and this is bullish.
This week we have a full green candle after five weeks of bearish-neutral action. The first three weeks were bearish and the last two neutral, a perfect transition. From bearish to neutral, from neutral to bullish. We will now experience very strong wave of growth.
We can expect first an easy target of 339% to hit within 1-2 months. Then we have more and 719% potential profits come into focus, 2-4 months. Last, and it can go higher, a new all-time high at $16 produces 1,176%. It will be fun to watch. We are ready and waiting... Thank you for joining me. Feel free to follow.
Namaste.

Bitcoin Short-Term Recovery Confirmed Bulls Win!Ranging markets/sideways markets is when traders lose the most money. Always keep this in mind.
» Short-term signals are pointing to a recovery right away.
» Bitcoin's drop wicked below the 13-June low but the RSI produced a higher low and thus we have a bullish divergence.
» Bitcoin's current drop went lower yet the chart reveals lower volume now compared to 13-June. This reveals weakness on the bear camp. This means a recovery will happen next, right away.
These are just a few signals but taken together with the altcoins analysis that I showed you and the bigger picture; Ha ha! The bulls win again.
Namaste.

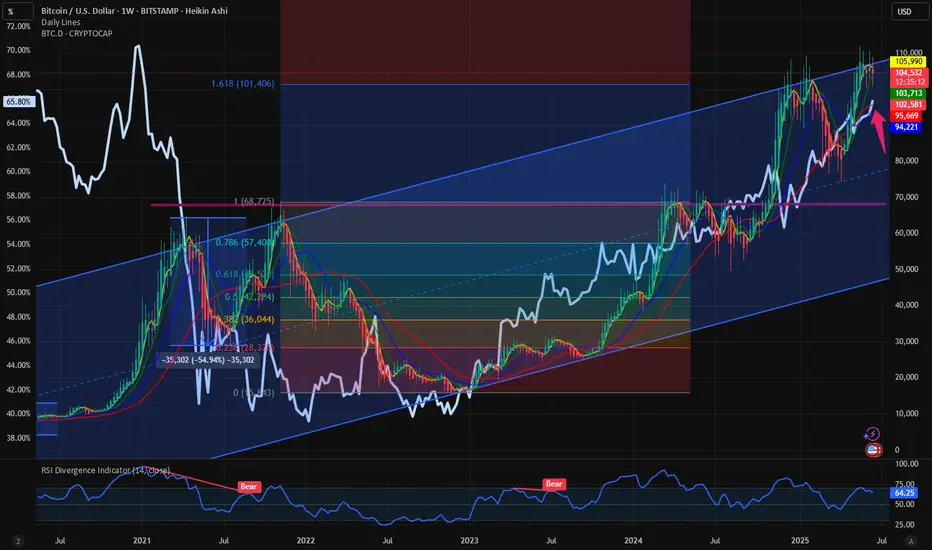
$BTC weathering the storm: $BTC.D close to 66%. $BTC to 160K. With all the volatility in the capital markets, Crypto is not immune to such swings. IN this space we have time and again analyzed the charts and have indicated that the best bet in the Crypto is to stay with CRYPTOCAP:BTC in these turbulent times. Even if CRYPTOCAP:BTC is above its previous cycle highs, this cannot be said about many altcoins like CRYPTOCAP:ETH , CRYPTOCAP:SOL , CRYPTOCAP:DOGE , CRYPTOCAP:LINK etc. A few days ago, on 15th June I wrote about the sloppy participation of CRYPTOCAP:TOTAL2 in case of an expanding $USM2.
CRYPTOCAP:TOTAL2 and ECONOMICS:USM2 : Correlation never broken. What now? for CRYPTOCAP:TOTAL2 by RabishankarBiswal — TradingView
Even if the ECONOMICS:USM2 is at an ATH CRYPTOCAP:TOTAL2 is still below its previous cycle highs. We asked the question what will CRYPTOCAP:BTC do if ECONOMICS:USM2 expands by 1-2T $. Even during the war and turbulent times CRYPTOCAP:BTC chart looks bullish as ever. It is still above its previous cycle highs; it is holding on to the psychological level of 100K $.
Now comes I think the most important chart in the crypto space is $BTC.D. The Dominance is currently above 65.5 %. Exactly here on 14th April we forecasted that CRYPTOCAP:BTC.D will go to 66%.
CRYPTOCAP:BTC.D to 66%, CRYPTOCAP:TOTAL2 / BTC down to 0.43 for CRYPTOCAP:BTC.D by RabishankarBiswal — TradingView
And again on May 20 I said the recent weakness in CRYPTOCAP:BTC.D is temporary and it will eventually reach 66%.
CRYPTOCAP:BTC.D : Have we seen the top or a local top in the CRYPTOCAP:BTC.D ? for CRYPTOCAP:BTC.D by RabishankarBiswal — TradingView
So where do we stand today. We are closer to 66% than to making a new local low. At 65.7% the path of least resistance is towards upside. And the USD valuation of CRYPTOCAP:BTC faces some resistance to breaking out of the upward sloping parallel channel which we have been following for the last few months. Currently the resistance level is 107K $ and we got rejected there.
Verdict : CRYPTOCAP:BTC.D goes to 66%. CRYPTOCAP:BTC consolidates here and 160K as Cycle top target.
VADER Enters Buying AreaDon’t Sleep on MEXC:VADERUSDT
It's currently in the process of doing a 3 waves pullback to correct the previous cycle and it reached the $0.044–$0.032 equal legs zone.
A bullish reaction could kick in next week — eyes open, structure’s still in play.

COOKIE Holds Above $0.2—What’s Next?📊 BINANCE:COOKIEUSDT has bounced off the support area at $0.2, signaling the start of a potential upside move that could take it toward $0.5.
🚀 Will momentum carry it higher, or is another test of support coming first?

WINkLink & Bullish AltcoinsYou thought I was a goner? You thought I sold my soul to the bearish side? No way... Consider the chart.
You know my altcoins analyses are good and straight, always right long-term. The macro, the bigger picture. Can't go wrong because there are only two possible directions. Once one is exhausted the market goes the other way. It is very easy when you think about it...
A pair that is trading near its all-time high can easily falter and move lower, I don't see anything wrong with that; nothing strange. A pair that is trading at very low prices near support, I can easily see a recovery around the corner, nothing changes on this front.
I would still recommend now selling those at resistance, buying those at support. Makes a lot of sense to me.
If you are spot, ignore those trading high up and buy those trading low and hold. Everything will be clear in a matter of months because even if the bullish action starts in two to three weeks, it takes months for a bullish wave to develop in full force... Everything can change in a day.
Thank you for reading.
Namaste.

Toncoin, Bullish On Everything; We Will WinSee (or watch), Toncoin is consolidating the higher low. I think I need to use new/different words because repeating the same words will get you bored eventually. Ok, that doesn't matter since we are talking about money right? If my analysis ends up being positive and being a money maker, then we can accept repeating the same terms over and over, what do you say?
Sounds good to me; I hope it resonates with you.
Let us see if you can grasp the situation from my perspective.
When Toncoin peaked in April/June 2024 I told you the thing was going to "go back to baseline" and produce a crash and then consolidate at the lows, etc., before a new wave of growth was possible. This is happening now but the fact that it is happening now also means that the down-wave is over.
After the bearish move comes the bullish move.
You know, this bearish move took more than a year to complete so you might not even remember when I was sharing all those bearish charts. The bullish move is the same, by the time prices go up and the market becomes bearish again, you will forget that I was telling you "it is going up," when the action was happening at bottom prices.
Technical analysis —TONUSDT
Classic price dynamics are present on the chart. The bottom is hit 11-March and there is a very strong reaction supported by high volume. Then the market goes sideways within a higher low.
That's it, this is the last consolidation at low prices before maximum growth. That's just the way it is. The market goes down, the market goes up.
It peaked more than a year ago now, June 2024. That is a long time ago specially in Crypto-terms. Once the bottom is hit, the market recovers and goes on a bullish wave.
How long will it take? 2 months? 1 week? 2 weeks?
Doesn't matter; it is coming, it is sure, it is true, it is easy, we will win.
Namaste.

Solayer, Big Rewards For The Patient, 630% Target ExposedYou could say that this is not an easy one because of Bitcoin's current situation. When Bitcoin is shaky, doubtful, the entire market becomes doubtful and hard to approach, but still, we buy the bottom/support and sell when prices are up.
Solayer produced an uncharacteristic rise previously, it can always repeat a strange behavior, it can detach from the market and move in its own way. There are always pairs that can do anything and do move strangely but also, market conditions can be something today and something different the next day. We shouldn't ignore a good opportunity based on assumptions or something that is not confirmed.
Solayer produced a double-bottom and the volume is good now with the current bounce.
There is also an ending diagonal (blue), which is a reversal pattern.
Say the short-term goes awry and Solayer continues lower, it hits a lower low; how long is it going to take for a reversal to happen? Once we hit bottom, if the bottom is not hit it isn't likely to be far away.
Say things go very bad and we get another low; how long will it take, two months?
That's the beauty of Cryptocurrency trading. Say it does go bad and instead of a reversal we get lower and it takes two months for prices to go up. Guess what? Profits potential would still go beyond 200% within 3 months. That's pretty good for sure no matter how you slice it, think long-term.
On the other hand, one can easy hit the first target for 130% or more within one month, short-term. If it doesn't work, try again, but you can't go wrong if you buy and wait. Notice the difference between current price and the all-time high... It is a nice chart setup, a nice trading opportunity; easy money, depending on your strategy, your thinking, your mindset.
If you are in too much a hurry, ok, you can secure a loss. If you have patience, you can end up with another win in the coming months. It is a great situation. Get ten like these and you set up yourself for success in the short-term. Once your targets hit, can take 3 months or 3 days, find a new set of charts. New opportunities are available every single day.
Take the time to take action. Take the time to choose; choose wisely, and the market will reward you with tons of profits; Crypto is here to stay.
Thank you for reading.
Your support is appreciated.
Namaste.

Solana Bearish Divergence, 20% Drop Incoming?Hey Realistic Traders!
Bearish Signal Flashing on BINANCE:SOLUSDT , What Signals Are Showing?
Let’s Break It Down..
On the daily timeframe, Solana has formed a double top pattern, followed by a neckline breakout, which is a classic sign of a potential shift from a bullish to a bearish trend.
This breakout was confirmed by a break of the bullish trendline, accompanied by rising selling volume, which reinforces the bearish momentum. Adding to this, a bearish divergence has appeared on the stochastic oscillator. Bearish divergence occurs when price makes higher highs while the oscillator forms lower highs, signaling weakening buying pressure and increasing the likelihood of a reversal.
Given these technical signals, the price is likely to continue moving lower toward the first target at 134.13, with a possible extension to the second target at 114.96.
This bearish outlook remains valid as long as the price stays below the key stop-loss level at 180.26.
Support the channel by engaging with the content, using the rocket button, and sharing your opinions in the comments below.
Disclaimer: "Please note that this analysis is solely for educational purposes and should not be considered a recommendation to take a long or short position on Solana.

Ethereum’s Last Chance: Let Jesus Take The WheelEthereum’s price action over the course of this crypto bull run, and especially since the beginning of this year, 2025, has been nothing short of horrendous. It’s failed to hold almost every single important level that it needed to, to be able to keep pushing higher. This has caused almost all crypto investors and altcoin traders to pull their investments out, and drive the price even lower. At its current point, altcoin traders have lost all but 100% of the confidence they once had in it, and to retail investors, this is basically toxic waste once they see the losses that have been taken, it’s driving them away en masse.
With that being said, this is ETH’s final stand, it’s time to either show out, or go home with nothing to show for itself. It’s at a very critical support level right now, and if it breaks down below this, the trade will be cancelled. It’s just finished completing the ‘Jesus Take The Wheel’ pattern on the weekly & MONTHLY. This is an extremely high probability pattern, and could cause a blow-off top for Ethereum.
We also see that we got a Wykoff Pattern here, with the last one that we got around the $2k level being a fake out. The only other times it has printed aside from the last fake out, it has been the start of a bull run. ETH now has 6 weeks in total, or about 4 more weeks from now to start recovering old levels, and taking off to the moon.
I drew a bar pattern on the chart that I took from its original bullish pattern from the start of the 2013 bull run. I believe we’ll have a shortened cycle, and due to not having much time left to complete the bull run during this 4-year cycle, that’s all we will get. Thankfully, the price has been beaten down so much, that getting in now, will offer 1000% gains, in just about 6 months. This will be one of the most incredible feats in all of crypto.
Fear is at an all time high, and ETH has been teasing everyone with a bull run for months and even years now. We haven’t seen an all time high since 2021. Most investors will suffer from boredom exhaustion as well, and with the stock market also sinking, we could see a huge push once we recover some levels, for the masses to finally come into the market via Ethereum ETF’s, so they don’t have to actually risk any money moving crypto around. The boomers and traditional investors with stock accounts will be free to throw cash at these ETF’s and that’s what will give us our final pumps past all time highs, once the crypto traders all get back into the market, and get us to new ATH’s in the first place, and help us recover key levels.
One thing is clear: ETH needs to stop trying so hard to control its environment, it’s time to just let Jesus Take The Wheel 🚀

Become Rich Trading Bitcoin Strategy Simplified Correction NullIs this a shakeout or a rejection?
A rejection implies no bullish action short-term thus lower prices. It is still early on the current move.
A shakeout implies a bear-trap and bullish action soon to follow, as soon as the shakeout is complete.
Daily and weekly close
Let's be fair and honest, it is too early to say. To determine if the current move is either a rejection or a shakeout we have to wait for the close today.
Price action
Why are these two in question? Because the daily session moved higher today reaching $106,500 followed by lower prices. The low hit $102,309, lower than 13-June but higher than 5-June, a higher low. More information can be acquired once the trading session closes but, we can move ahead and see what the chart has to say based on other signals.
The volume is low on the bearish side, on all sides. The higher low so far is strong. As long as $102,000 holds Bitcoin is ultra-hyper bullish, very strong. Even if we are considering the short-term it doesn't matter, if the action is happening above this level the bulls are wining and that's what we have.
If the action is happening above $100,000 we already know what this means and this level is not in question right now. Being price oriented that is why I say is still early, do you agree?
So, more shakeouts, more sideways, more retrace—a non-event; short-term noise.
We are looking for the next major move, not the next $1,000 drop.
Market conditions do not change
Rest easy, Bitcoin will continue bullish even if it wicks below 100K. As long as it trades above this level, or the $100,000 to $102,000 price range, the action is safe (coming from the bulls).
If the week closes above this range but starts red next week and goes below, no need to panic because the week can start red just to recover and this would only be a continuation of the shakeout; we take information from the weekly close and not the intra-week action makes sense?
Questions —Leave a comment
So, what is your take?
Just let me know truly, what is your belief?
Do you think Bitcoin is bearish or bullish?
It can be looked at in many different ways.
The bull market
The trend is bullish, mid- to long-term. The action is happening above 100K.
The altcoins market is weak but we all know from the bottom we grow, we are entering the summer now... Ahhh, the beautiful summer, bring the heat. With the summer prices tend to grow.
You can call it a relief rally but that will be only the start. The relief will turn into a major bullish wave and this wave will transform into a major bull run.
Motivation
I love you again wishing you the best forever more.
You deserve the best now and always.
Keep at it and keep trying, persistence is the key. As long as we continue to trade, in the end we are sure to win.
Invest in Crypto, it is very easy.
Think of all the people that joined us (the market) 10 years ago. What are their holdings worth now? Millions upon millions... Now, think of yourself 10 years into the future. Put whatever money in you can afford and watch it grow.
The way to riches is not through frugality or savings, the way to riches is through buying and investing. This is the right market for us. It is fast, it is volatile, it is young; just like most of us. If not young of age, we are young at heart.
Namaste.

ALTCOINS: Market bottomed and about to surge.The Altcoin market is almost oversold on its 1W technical outlook (RSI = 30.160, MACD = -0.160, ADX = 18.210) but this very same 1W RSI pattern has emerged numerous times before an altcoin market surge (Altseason). How high it can go depends on whether the Fed will cut on its next meeting or not. Nevertheless, this level is an excellent opportunity to start investing in altcoins.
## If you like our free content follow our profile to get more daily ideas. ##
## Comments and likes are greatly appreciated. ##

PURE TOTAL 3 ALTCOIN INDICATOR without stable coins, BTC and ETHCRYPTOCAP:TOTAL3-CRYPTOCAP:USDT-CRYPTOCAP:USDC-CRYPTOCAP:DAI
Original idea inspired by trader SpartaBTC — highly recommend checking out his page.

Sei Goes Bullish, Same Pattern & SequenceIt is the same price pattern and sequence. A bullish wave ends December 2024 and leads to a correction. The correction ends with a bottom 7-April. This bottom marks the start of a new phase, the bullish cycle. Recently, SEIUSDT produced a higher low and this higher low marks the start of the next advance, a bullish continuation.
Makes sense?
Bullish action already confirmed —The bigger picture
Today we have three green candles and the most bullish since the end of the initial bullish breakout. If you take this chart together with my other recent publications: COIN, ETH, DOGS, NOT and BCH, you can start to decipher the bigger picture. It is already confirmed.
A great opportunity
I am here to alert you of the event before it happens. Taking action now can be life changing or simply put, taking action now can translate into huge profits; the best possible entry after the 7-April low.
Don't worry, even if this opportunity gets away from you, the market will continue to produce countless more; endless opportunities the Cryptocurrency market has to offer for sure.
Thanks a lot for your continued support.
Namaste.

Bitcoin Cash, Anomaly or Predictive Signal?Some people can say that Bitcoin Cash right now is simply an anomaly, nothing to see here. But a closer look reveals nothing abnormal, more likely a very strong predictive signal that supports what we saw happening with the COIN stock and what was predicted recently to happen with ETHUSDT (Ethereum), that is, a very strong bullish breakout is the next main major market move.
Good morning my fellow Cryptocurrency trader, I hope this day finds you well.
How are you feeling?
Introduction —The market is one
In isolation, the market is tricky and hard to predict. Within a bigger context, we can easily predict what will happen next. Just look at Bitcoin Cash, it shows exactly what will happen because it has been being in perfect syntony with the rest of the market.
Many pairs are consolidating or retracing. My view is that a bullish move comes next.
Let's see how Bitcoin Cash has been behaving lately and compare this to the rest of the market. The fact that it is bullish now predicts that also the other pairs will be bullish because they are moving in the exact same way.
Price action —Past history
A crash ends in early August 2024. By late 2024 the action goes bullish. November 2024 marks the start of a month long advance that ends December 2024. This is true for most of the altcoins market.
The December 2024 peak leads to a correction with the main low happening 3-February. Another low and market bottom happens 7-April 2025. From this point on, we have a recovery and after a high in late May, the market goes into retrace.
Present day
This retrace is where we are today for most of the pairs. 100% of these are trading within a higher low compared to 7-April. Here BCHUSDT ended its retrace and moved ahead of the pack to hit a higher high compared to May. It also produced the highest price since January 2025.
The future
This is not an anomaly. Bitcoin Cash's price action simply reveals what is coming to the rest of the market. As it moved in perfect synchrony with other projects for months or even years, it will continue to do the same. The fact that it is trading higher now, means the other pairs will follow, in fact, some other pairs are already there; a bullish continuation.
Soon everything will grow.
Thank you for reading.
Namaste.

Notcoin, Get Ready For A New Bullish Wave; Never Give Up!You know these two tend to move together, Dogs and Notcoin. Also notice the strong similarities between the two charts.
Just for reference, DOGSUSDT I shared just a few minutes ago.
Past action
NOTUSDT (Notcoin) grew 125% as the initial bullish breakout in less than 1 month, 28 days. After the 7-April bottom. Here there was a double-bottom with the exact date being 16-April for the start of the last bullish move. The peak happened 14-May.
Back to basics
Current price action is trading within a strong higher low and the timing is right, the market is red.
Notice the need, the compulsion almost to buy when prices are low. Ahhhh, low, that's awesome. It is the best time to buy if what you want is profits, money, success. If you want the rush, losing money and stress, buy when prices are high and there is lots of hype.
If you want profits, success and growth, buy now when prices are low. I cannot stress this enough.
Where to next?
Very easy targets here we have 155% and 261%. Notcoin already grew 125% and remains within a strong higher low, this means that a higher high is mandatory next and it will happen, with a high level of certainty; this is sure, this is easy, it is just the way it is, it is how the market works.
First, you get a downtrend and there is always tons of red. Second, the market turns green and it always goes up. Both within the uptrend and downtrend you have bearish and bullish moves, only the bigger picture doesn't change. So you do get corrections in a bull market, periods of red but these tend to end just to produce more growth. This is what we are seeing today but only the start.
I can understand that many people are new to this market, to these pairs, to these charts; and so, there isn't much to go by. Notcoin has been trading only for a few months. But trust from someone with more than 10 years of experience in this market, since 2013, the next market phase is a major advance and it will be something like you've never experienced before.
In short, we are going up.
The time is right, the time is ripe. Prices are great.
Never give up
Genius and successful traders tend to buy when prices are low. Prices are low now.
I know it is hard to take the plunge, to move forward, to go ahead; but that is how it works.
If you want easy profits, sure profits and winning long-term, you have to detach from the herd mentality and move according to tested knowledge rather than impulsive buying.
How easy is to buy when everything is up?
Right now, instead of buying some people are actually thinking of selling, giving up. Never give up.
If you didn't sell when prices were high, why would you sell when prices are low?
Buy and hold
Better yet, buy and hold.
If you miss the next top, that's ok, keep holding long-term. But never sell at the bottom, it is a recipe for disaster; we all make mistakes.
If you are plagued by mistakes and you can't seem to get it right, never give up.
Go out and do some walking, running or whatever, when you comeback, you will be ready for more.
The market is not going away, there is a fortune here waiting for you, you have to prepare and the market will give you as much as you can take.
Thank you for reading.
Namaste.

Dogs, A New Round Of Growth, Easy 385% Target (1,045% Strong)Good afternoon my fellow Cryptocurrency trader, how are you feeling today?
Dogs has been bearish for more than a month after producing a nice ~150% jump after the market bottom. Would you say, 150% is big or small? Is this good or not good enough?
I say it all depends on how you approach the market. This type of move is awesome for short-term traders as well as leveraged traders, good profits can be made.
Long-term traders, well, they trade long-term so short-term moves make no sense. They don't make any difference.
Profits potential
The good news for long-term traders is that the "strong target" for DOGSUSDT is also an easy target and goes beyond 11X, 1,045% profits potential (PP).
The easy target is 385% and for a leveraged trader, with as little as 5X this can translate into 1,925%, but the risk is higher. Higher rewards potential but also higher risk. How you choose to trade depends on your risk tolerance, your capital, your goals.
I think this is a good chart setup, timing is great.
Market conditions and sentiment
Notice something, the market is quiet.
Notice something, there is no hype and no major event. People are not rushing to buy either. This means we are witnessing a market low. This is the exact-perfect time to buy and hold. When people are not watching or distracted doing other things, that's when the market grows. When the market has been growing for a long time, watch out because a correction tends to follow.
Now DOGSUSDT, and many other projects, have been bearish, or sideways, for more than a month. You see? After a month of rising prices you get a correction; April-May. After a month of bearish action you will get a bullish wave; May-June. The proof will come based on the results.
Timing is right, it should only take a few days. And the price is awesome. The downside is very limited almost fully exhausted.
Risk tolerance and trading approach
With all that said, be careful how you enter and how you trade. The market is tricky and tends to shake you out even if you hold a strong hand. Your position might not be at risk but with a sudden move, if you are unprepared, you can become anxious and fold at a loss. That is why planning is of the utmost importance. Just answer the question, how long am I willing to wait holding this pair? If it moves down, will I hold long-term or should I set a stop-loss?
Some people give up after 20%, that's ok. Because if you cap all your loses at 20%, then you cap your wins at 100% and 200%. You can end up winning long-term if you pick more winners than losers and that's easy with spot trading and the charts that I share daily.
Thank you for reading.
Namaste.
