XRP: You Have What it Takes, Success is Yours!It seems XRP has been trading at the same price for more than 7 months. The mean price since XRP broke above $2 back in December 2024.
Can you see what I am referring to? Good if you do.
If you don't, continue reading, everything will be clear in a few seconds.
Price action
Is neutral price action at this point bearish or bullish?
Bullish.
Most of the action has been happening above $2 and this is clearly bullish.
The upswings are bigger than the down-swings.
Buy volume is higher than sell volume.
The main move is an advance that started in November 2024.
The bigger picture and major trend is bullish.
The fundamentals are getting better everyday; there is nothing bearish on this chart.
Where to next?
New all-time high and higher prices.
How to approach the market
Start with 3-5X. When the bullish action is fully confirmed, the market starts to move higher supported by high volume and marketwide wide action, go all-in. That's the only way to win.
Make the winners pay big. Keep the losers small.
If you don't take risk you can't win in this or any other game.
Thanks a lot for your continued support.
Trading tips
Only risk money you can afford to lose and make sure to do a calculated risk. Not crazy risk nor gamblers risk. 2-3X. As the market advances, 3-5X. When the trend is confirmed, go higher and continue to increase until you max everything out. When our target hits sell everything and never look back. You can buy again when there is a crash or a retrace. Opportunities are endless.
If you secure profits and the pair continues to grow; who cares! Buy one that is safe and secure. Buy a new one that is trading low. Don't go back to the same pair just because you won. Detach. Take some time out. Secure profits. Comeback refreshed and the market will bless you with endless opportunities, it is not going away.
Motivation
Just make sure to win-win-win.
If you can win small, you will eventually win big.
Win, win, win. Make a habit of winning.
Go step by step.
Many people overestimate what they can do in a year but underestimate what they can achieve in a decade. Think long-term.
Instead of tomorrow, next week or next month, think how much money you are going to make in a decade if you start preparing now. What if everything you are doing does not need to yield an instant result? Now you can relax your mind. It will all come to you, but let it come, there is no rush.
Even if you hurry, life will continue to give you what you need, what you earned and not what you think is best. Whatever situation you are in right now is the result of past action. Take responsibility and watch everything grow.
Your future can change if you make the right choices today. You can change everything, start now; what can I do today to make my day better? What is the best action to take? Should I go out and get drunk, sniff a bunch of drugs, or, should I exercise and eat clean, do what it takes to reach my goals?
Choose wisely and watch your profits grow.
Whatever results you get when trading is just a reflection of your mind and the choices you make in your day to day live. Belief and take control.
You have what it takes.
Success is yours.
Namaste.
Altcoins

$banana PARALLEL CHANNEL ON BANANA GUN$banana parallel channel on banana gun.
Have we bottomed?
Do we now go to the top of the parallel channel?
I think we go there in june.
Q3 aka july, aug, sep going to be consolidation
Q4 we begin the bull run.

Dogecoin: Small Move, Big Move, What Will You Do?All gains have been removed, most of them. Dogecoin hit yesterday the same level from 6-May. This level was the base that propelled prices to 0.26000. From this high point 11-May, we witnessed a correction lasting more than a month. Total drop amounts to 36.9% (-37%).
Size and duration
» From 6 to 11-May we have 5 days.
» From 7-April to 11-May we have 34 days (bullish).
» From 11-May to 17-June we have 37 days (bearish).
I am making the case that the correction is over. Follow me a little longer and you will be convinced. If you are not convinced by my analysis, you will be convinced when prices start to increase.
Drop vs rise
» The 7-April low was 0.12986.
» The 6-May and 17-June lows was around 0.16400.
While the drop is bigger than the rise, in time duration, the action did not produce new lows (a lower low). Instead, prices remain strong as a higher low.
The low 17-June (yesterday) is 26% higher compared to the low that was hit 7-April.
Now I will make my case stronger.
Past action
Dogecoin peaked 8-December 2024. After this peak, bearish action is really strong and every few weeks we see a new low. Total drop from top to bottom amounts to more than 73%. But here is the thing, the final low in 7-April is still higher compared to the low in early August 2024.
» What you are seeing now is a "small move," (1).
» What comes next is a "big move," (2).
Now you know what is coming to Dogecoin—the altcoins market—what will you do?
Namaste.

Theta Fuel Whale Mistake Bullish Signal RevealedLook at this... The charts reveal everything always before the event takes place.
This happened yesterday on KuCoin, TFUELUSDT grew 185% but all the gains were removed.
The peak happened at 0.09500. This means one thing and one thing only, there is no longer any resistance all the way up to that price. All the sell orders that were placed have been filled. This means that once the market turns bullish, this pair will move straight up. That's the proof, right there, yesterday's candle.
This signal can be read in many different ways but they are all bullish, so, what will you do?
Theta Fuel is going up. You read about it here first.
Thanks a lot for your continued support.
I am keeping it simple; simple is best.
Namaste.

Tranchess Bull Flag... Do You Agree?This one here is also a bull flag, a wide one and you know where prices are headed next.
Let me ask you a question and be honest; do you have any doubts about what I am saying? You can answer in your own mind of course but just think about it.
I say the market is bullish but consolidating.
I say the market produced a retrace, in some cases a correction, which will only lead to higher prices.
I say this based on the information that is available through the charts and I share all the charts with the evidence.
Do you agree?
I am an optimist.
To me, I have 100% level of certainty but what about you?
I was right about the rise from April but that seems already to be far away. Do you believe me? Do you trust me? Do you know what will happen next? It is written all over the charts.
If you do, then you have to take action.
Money is on the table, and this is a money game.
If you agree and you can see what I see, how will you proceed to maximize profits?
What actions can you take now to maximize your earning potential and increase your trading success?
If you know the market is going up, then, you have to take action that goes in accordance with what you know.
First you read.
Through reading we learn.
We use the gained knowledge to achieve our goals.
Thanks a lot for your continued support.
Oh, and by the way, Crypto is going up.
Namaste.

Stratis Reveals A Bullish Bias Across The AltcoinsThe market is set to resume growing, the proof is in the charts. Stratis (STRAXUSDT) was one of the first projects to move strongly after its 7-April low. Here you can see a 150% jump within 10 days.
This type of move always reveals two things. The start of the next bullish cycle and the fact that the bottom is in. Both are one and the same.
Once the bottom hits, only growth is possible or else the bottom is not in. Once a new bullish cycle starts, then there can't be any new lows so the last low present on the chart must be the bottom.
After the initial bullish breakout we get the classic correction, now two months strong. The correction found support at the same level support was found in November 2024.
Here is the interesting part. Stratis was one of the first projects to move strong, seeing it getting ready to produce a new bullish wave, reveals that the market is done with its correction and will resolve to produce rising prices. What one does, the rest follows. Some projects move first though.
This is the signal. It is still very early of course, but that is the advantage we can enjoy by looking daily at the charts.
I will do a short-term trade-signal for this pair.
Thank you for reading.
Your support is appreciated.
Namaste.

Ampleforth 200%+ Bullish Breakout Explained & 267% TargetIn April, FORTHUSDT produced a 200%+ bullish breakout in just three days. The market has been sideways since, consolidating and this consolidation means preparation before the next move which can be something similar. The market is clearly bullish because of the higher low.
The major burst upward in early April confirms the bottom is in. A confirmed bottom once more simply means that Ampleforth is bullish; bullish means that the next major move is not a breakdown (drop) but a bullish jump. This is all confirmed based on the action from the past two months.
Knowing this, we can take action with a simple strategy of buy and hold. We buy waiting for the next market move to develop. When the market turns green, we collect profits and move on. Repeat the same process over and over, and watch your capital grow.
It doesn't matter how long it takes, patience is key; what matters is to be prepared to wait for as long as it takes. If you can wait 2 weeks, 3 weeks or 6 months, you can end up with a win. Some pairs will move in a matter of days, others in a matter of months. If you can't predict which one will move next, you can use a diversification strategy.
Just be prepare to win some, lose some. Not all trades can be won. But if wait for the winners to become big and keeping the losers small, that's a recipe for success.
Plan ahead of time.
There are countless ways to approach the market. It all depends on your trading style, your trading goals, your capital and risk tolerance... The only way to lose is to give up.
Perseverance is key.
Comeback for more.
Namaste.

Bitcoin Short-Term 4H Timeframe, Still Bullish But...Bitcoin continues bullish on the 4H timeframe and we have some positive signals coming out of the most recent swing and shakeout.
» The action went below 0.618 but is back above this level.
» The higher low did not reach 0.786 Fib. retracement support, which is a signal of strength.
» Trading volume continues to rise and as the action happens above $100,000, this signal works in favor of the bulls.
Short-term, Bitcoin continues green with the bulls in full control of the chart. When in doubt, zoom out; Crypto is going up.
This is obviously a consolidation pattern because we have higher lows but also lower highs. The revealing signal of course comes from the altcoins, look at Bitcoin Cash and you can get a good example.
The market will resolve bullish once the consolidation ends.
I say this based on market data and the charts.
If you agree leave a comment.
Thank you for reading.
Namaste.

Bitcoin Mid-Term, 4H Timeframe, Bullish ($119,165 Next Target)On the 4H timeframe we have a consolidation pattern with a bullish bias. Bitcoin is aiming higher after a close above EMA8 & 13 with higher lows.
The drop 13-June found support perfectly at 0.786 Fib. retracement on a wick. The session closed above 0.618. The action turned bullish immediately and we are seeing slow but steady growth.
The recent drop was a market reaction due to a geopolitical situation. As soon as the event is priced in, the market seeks balance and goes back to its previous trend.
Bitcoin's bullish bias is not only supported by strong prices, $105,600 is very strong, but also by the altcoins and the cyclical nature of the market.
While Bitcoin already produced several new all-time highs this year the altcoins are yet to do the same. A bull market happens every four years or the year after the halving. For Bitcoin this is already true but this is a marketwide event and the altcoins are yet to go there and this is a bullish factor and soon this will be obvious on the chart.
We are 5-6 days away only from very strong bullish action. Notice that this isn't a long time, it is less than a week. The altcoins will reveal this bullish bias much sooner than Bitcoin but Bitcoin will also grow and hit a new all-time high soon. This new all-time high will be the catalyst for everything to boom.
» Ignore the short-term it is all noise—crypto is going up.
The next target is $107,558, followed by $109,508 on this timeframe. The latter being a mild resistance.
The main target here is $119,165 and this is a good resistance zone. It can be rounded up to $120,000. If this level gets hit it will only confirm additional growth. The target that follows is $130,000 and the minimum for this cycle is $160,000 but we are aiming higher.
Feel free to follow for more.
I will continue to detail Bitcoin on all the timeframes as well as many of the top, mid- and small altcoins.
Thank you for your support.
It is appreciated.
Namaste.

Theta Is Ready for a Strong Recovery Soon!Looking at Theta, I see strong potential for a recovery very soon. We just completed a classic ABC correction, very similar to what Amazon experienced back in the day. I expect a big bullish move on this coin shortly. We are primed for a strong reversal here.
Theta is undervalued on both the higher and lower time frames, and with such strong project fundamentals, I see this as a major mover in the upcoming altcoin bull market. There’s potential for insane gains on the larger time frames and a strong recovery on the smaller ones.
Don’t focus on the news or media—crypto is ready for big things. As always, stay profitable.
— Dalin Anderson

Bitcoin Pushed Crypto Market Into A Higher Degree CorrectionGood morning Crypto traders! Cryptos are coming lower and we can now see a five-wave drop on Bitcoin, which indicates for a deeper, higher degree correction, so Crypto TOTAL market cap chart may stay in consolidation within an ABC correction, which can retest 3.0T – 2.8T support zone before bulls return.
Bitcoin has impulsive characteristics on 4h time frame, and we can clearly see five waves up that can send the price even higher after a pullback. Now that it’s back to all-time highs, we can see it making a higher degree ABC correction, which can take some time, and it can retrace the price back to 97k-93k support zone before a bullish continuation.
However, we may now see a temporary corrective recovery in wave B, where some ALTcoins could still be doing well, if we consider that ALTcoin dominance may start kicking in. Yesterday we shared a chart of the ratio of TOTAL3(ALTcoins) market cap against Bitcoin with ticker TOTAL3ESBTC, which shows that ALTcoins may start outperforming BTC soon. It can be finishing final subwave C of (Y) of a correction in blue wave B which may cause a new strong rally into wave C that can bring the ALTseason similar as in the beginning of 2021.

Maple (SYRUP) Bullish Impulse, Final Target & Correction Support+553% since its 7-April bottom, but the third wave is already in. Notice how the volume is super high until 15-May but then it drops as prices continue higher. This means that only the fifth wave remains. After the completion of the fifth wave there should be a correction before additional growth.
The two main targets for this current bullish impulse are shown on the chart but it can go higher of course. A number came up around $1.23 but this chart is just too young.
Once the correction starts, the main support will be where the 1.618 Fib. extension is now. Can wick lower but the 0.786 isn't likely to be tested. Maple Finance SYRUP.
Namaste.

Ronin: Low Risk vs High Reward Potential It is interesting the large amount of volume that has been coming in recently. Just yesterday it was the highest on a daily basis since November 2024 and we know November 2024 was a bullish month.
There is a very strong wipeout candle here, 30-May. These can be taken as a strong reversal signal but only at this juncture of course.
3-Feb we had a wipeout candle but there was no clear bottom in sight yet, and bearish volume was high and thus the market continued lower.
The one from 30-May is preceded by a bottom formation, so we know this one is the final low. Also, this candle is not present on other exchanges which is quite revealing. It means this exchange wanted to liquidate all its leveraged trades and activate all stop-loss orders. It certainly did.
So we ignore this candle but take from it that the bottom is already in. Confirmed. This means that growth will happen next and the high buy volume yesterday confirms this second statement. All in all, we can go LONG with a high probability of success.
Low risk vs a high potential for reward.
Namaste.

Avalanche, The Money Tree; Great Entry Price & TimingWhat's the first thing you consider when looking at a chart? What is the first thing that catches your attention?
When you take the leap, how confident do you feel that your conclusions are correction? Do you doubt yourself? I don't.
The first I look at are the candles and the chart structure. Later comes the volume and price patterns. Finally, if somehow the direction is not yet clear, I add some indicators for additional support. What about you, what is the first thing you consider when looking at a chart?
I think Avalanche is ready to grow based on a rising channel, a structure of a higher lows. This small and young structure is a period of consolidation before maximum growth. Timing is running out. The market is about to go bullish and it will grow with full force.
It doesn't matter what is happening "out there," Crypto is going up.
Looks like a great entry timing is possible on this chart. The price is awesome. It is the same chart setup we've been looking at for months and months. The current price range has been active since early March.
The rise from March, April and May all include the 3-February low. It is certain and highly obvious, this consolidation has been going for too long. The bearish bias is missing. Bullish consolidation means that a bullish breakout will follow when this phase ends. The start of a new uptrend. All those altcoins that moved first revealed what will happen to this pair.
Did you miss those? I showed you some pairs that grew more than 100% in a single day. You know something interesting? The chart on those pairs is exactly the same as this one. The drop, the recovery and the higher low.
Soon, very soon, Avalanche will follow and the rise will be very strong.
Namaste.

Bitcoin Will Continue Rising —Long-Term Chart —$200,000+ New ATHIn November 2021, the week after the all-time high was a crash. The weeks that followed were a continuation and the market went full red and didn't stop dropping until November 2022, a year later.
In May 2025, the week after the all-time high is neutral, sideways. Four weeks later and Bitcoin continues sideways consolidating near resistance, ready to break to new highs and continue rising.
Market conditions now are very, very different compared to 2021. Right now, we are only halfway through the current bull market, for Bitcoin, and we have room left available for plenty of growth.
In a matter of days, maybe 5-6 days, we get a new all-time high and this means not the end of the bull market but the start of the next and final bullish wave.
These targets on the chart are the most accurate of all numbers because they are based on almost 5 years of data.
Next target and minimum price for Bitcoin in the coming months is $155,601 but we know there is likely to be more, much more. With the institutional wave now in full force, banks opening to crypto because they have no other choice and the world evolving faster than anything we thought possible, we are aiming for $200,000 or more.
The next relevant level after $155,600 is $209,125. Which one is your target for this new 2025 all-time high?
Do you think Bitcoin will peak in late 2025 or early 2026?
Do you think you will manage to be successful in this round or are you bound to make the same mistakes? Over-trading, over-leverage, no being patient enough; not waiting for the right time to enter and not selling when the market is trading very high, greed; What will it be?
Do you think you have what it takes to succeed? You do!
Even if you made mistakes in the past or even if you are already doing good, you have what it takes.
If you are doing bad, this experience can be used to improve your game. If you are doing great, great, let's do better. There is never enough growth; we are happy, we are grateful but we accept abundance because we receive abundance thanks to hard work.
It is still very early but the market is starting to heat up. Once the bullish action starts, there is nothing that can stop us. The world will change for us. We will adapt to all market and geopolitical conditions, we will continue to improve and evolve.
The best one is not the one that makes no mistakes but the one that can extract learning from all experiences. Success is not being right all the time, success is never giving up.
Will you give up? Or, will you continue to trade long-term?
» Bitcoin is going up!
Namaste.

VaderAI by Virtuals Explodes, 1,379% Profits Since Its 7-AprilBoom! Crazy growth it seems is not only ultra bullish but truly bullish confirmed. VADERUSDT already grew an astonishing 1,379% in a little over two months and the chart shows potential for additional growth.
This is what I am talking about but of course this pair exceeded all expectations, this is only the start, many altcoins will be doing the same in the coming months. This type of growth will be normal mark my words.
Some pairs always move ahead. On the left side of the chart we have the bear market. March marks the end of the bearish trend. April marks the start of the bullish phase.
The bullish phase will continue and can go for many months. There is no limit to how far up prices can go. Truly, there is no limit. Once the market enters the price discovery phase, the only choice we will have is to watch and be amazed. Many lives can change forever with what we are about to experience. Position yourself in the best possible way you can.
This is truly the opportunity of a decade, maybe a lifetime. Yes, there will be many bull markets in the future but the cryptocurrency market will be more mature, we don't know exactly how these opportunities will develop but we do know that now, what we are seeing now is the change of an era; money going from tightly controlled, to being free and accessible to all.
Money used to be owned by a few banks. Now money is owned by the people. With people owning the new money supply, the world will enter a period of abundance and growth. While money in the past was being suppressed and inflated on purpose, money will now be shared and made available on purpose.
While the previous system was designed to create scarcity for the majority, power and control for the few; the new system is intended to work for you. Whatever you want you can achieve, you can create your own money now. Nobody can stop you. That's what Cryptocurrency can do.
Bitcoin is the evolution of money.
Crypto is the evolution of finance.
It is already here and it is here to stay.
Trade Crypto, buy Crypto and hold Crypto long-term, you will be happy with the results.
Namaste.

Sushiswap 1,2 Breakout Sequence Can Lead To New ATH (3,000% PP)On this chart and after reaching a market bottom Sushiswap produced a clear 1,2 breakout sequence. This sequence has been shown to produce a bullish wave.
You know what they say, "Third time's a charm," and we are on the third breakout from a long-term support.
1) In early June 2023 we have the first 1,2 breakout sequence which leads to a bullish wave that ended in March 204.
2) In August 2024 the same sequence again, and a new bullish wave ends December 2024 with a higher high compared to March.
3) Fast forward and bring yourself to this present day, April 2025 the same sequence starts as a higher low. "Third time's a charm." Here we are getting not only a higher high but it is possible even a new all-time high.
» Growth potential can reach 1,500%, 2,500% or even beyond 3,000%, it is still too early to say.
It is not early to know though that the market already hit bottom and is preparing to grow.
This is a good chart and a great project; an awesome opportunity. Buy and hold.
Namaste.

Nillion To Meet Final Resistance To Reach 273% —Trading BasicsNillion hit bottom 13-June but the bottom is only confirmed today with the current bullish breakout.
As the action turns bullish Nillion will grow to face its "final resistance" around $0.55. The good news is that this resistance level will break followed by additional growth.
Within the next 2 months, we have an easy target of 195% profits potential, followed by 273%. These are easy, and this means that NILUSDT will produce even more growth in the ensuing months. We will see an uptrend develop leading to a price discovery phase.
How far up this pair goes is a question mark because it is new, but total growth potential for this bullish cycle is huge. The fact that it is moving early is also good news.
Trading cryptocurrencies can be complex or it can be simplified, I like the simplified version; turn it into a waiting game, truly.
With a chart setup like this one, buy and hold, the market takes care of the rest. That's the waiting game but that's not all... You are waiting but once prices start to grow, you can enjoy the profits as they come. The next step will be to sell to secure a win. You only sell when prices are high, big green. Never sell when prices are low/red. Sell high. Buy low, sell high. Prices are low now.
Thank you for reading.
Namaste.

BTC is Bullish!Hello TradingView Family / Fellow Traders. This is Richard, also known as theSignalyst.
📈BTC has been overall bullish trading within the rising channel marked in blue.
Moreover, the red zone is a strong structure!
🏹 Thus, the highlighted blue circle is a strong area to look for buy setups as it is the intersection of structure and lower blue trendline acting as a non-horizontal support.
📚 As per my trading style:
As #BTC approaches the blue circle zone, I will be looking for bullish reversal setups (like a double bottom pattern, trendline break , and so on...)
📚 Always follow your trading plan regarding entry, risk management, and trade management.
Good luck!
All Strategies Are Good; If Managed Properly!
~Rich

Magic: Higher Low, Falling Wedge & Bullish Continuation (1,046%)It seems like forever, but it is worth it because of the huge potential for growth.
The falling wedge pattern is a classic, we haven't been seeing that many recently and here we have one.
The initial breakout in April only lasted two weeks. MAGICUSDT peaked 21-April and started a long retrace, this retrace as always happens ends in a higher low. The candles formed a falling wedge pattern which can be used as a bullish reversal signal.
As the breakout from the pattern happens today, we can see trading volume going up. The highest volume since April. This high volume confirms this move being real and we can expect additional growth.
The following targets can be hit within 1-3 months. So these are huge numbers watch:
» $1.14 Gives 626%.
» $1.80 Gives 1,046%.
» $0.4759 Gives 203%.
These are great numbers, nice potential for growth. The last target can be hit short-term, within thirty days. It can be less.
Thank you for reading.
Your support is truly appreciated.
I hope we can continue to exchange for the long-term.
You give me attention, and I give you knowledge and great trading opportunities.
Namaste.

Altcoins Market Bull Market Confirmed, AltLayerThis is just one, another one, but this theme will continue to repeat over and over, again and again.
Here AltLayer is producing a three digits strong bullish breakout; the highest volume ever today and this confirms the start of the 2025 altcoins market bull market.
Total growth amounts to more than 115% in the past few hours. This is similar to what we saw with Ravencoin and Axelar, these projects produced three digits green in a single day and the market is producing a bullish continuation on those, here it will do so as well.
This is only the start, prepare for maximum growth.
If you enjoy the content, consider hitting follow. I will be sharing new altcoins daily for year to come.
Namaste.

Bitcoin, Good News & Good News —Bullish Confirmed (Retrace Over)First, the good news is that we have a higher low and a strong recovery in place. The current candle has a long lower wick and is already trading green, at the top of the session.
The second good news is how far down the retrace went. Last time Bitcoin bottomed around $100,300, this time the bottom happened at $102,660. This is an early signal of course because the week is not yet over. It can happen that prices move higher today and tomorrow they move back down, crash on Sunday and we get a bearish close. But, looking at short-term price action and other altcoins, also the volume—notice the volume—we can say that the retrace is over and we are set to experience immediately additional growth.
The volume is the most revealing signal right now.
The drop had no volume compared to today. Today's session has more volume than the last three red-days combined.
Another signal to consider is the amount of over-leveraged gamblers that were liquidated, a total of 1 billion dollars. When this much greed is removed from the market, there is no need for lower prices.
I will call it early, the retrace is over. Time to go bullish again.
Thanks a lot for your continued support.
I will show you several more altcoins that are also looking ready to grow.
Namaste.
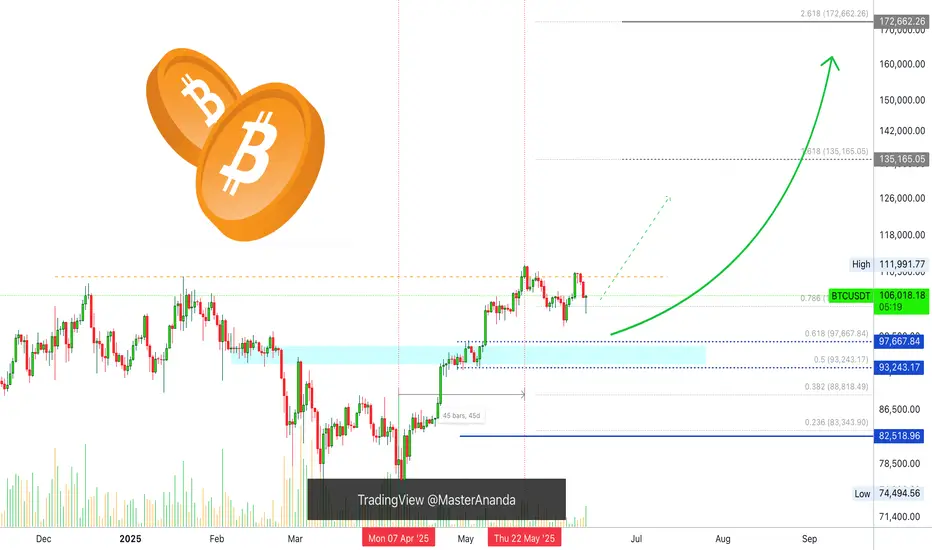
$BTC Breakout Targets $125KCRYPTOCAP:BTC has broken out of a falling wedge and is holding strong above the $103K support zone.
Price is pushing upward toward the key resistance at $110K– $112K.
A breakout above this zone could trigger a move toward $125K.
DYRO, NFA
