Moonriver 331% Profits Potential Target Mapped (Volume Breakout)Moonriver today produced the highest volume daily since December 2024. The big difference between now and then lies in the fact that in December MOVRUSDT was trading near a peak while today it is coming out of a higher low. Increasing volume in this situation means the start of something positive for the bulls.
For example, last year after some bearish action the first high volume candle came in October. After some choppy action, we experienced a strong bullish wave.
So now we have high volume today and this is only the start. We will see grow and more volume and bullish momentum building up... It will all accumulate and culminate in a massive bull run.
Thanks a lot for your continued support.
Namaste.
Altcoins

Avalanche Recovers & Then Some... (Targets: $40-$46 & $81)I will keep it short, sweet and simple. Avalanche is recovering nicely with five consecutive days closing green; higher low; trading back above the 3-Feb. low (orange line) and marketwide bullish action.
The action is happening in the green zone, the bullish zone and a local higher low will lead to a higher high with a target of $40 first. This is the next target and it is an easy one. It will definitely move higher but consider $40-$46 the first strong barrier.
The main target sits at $81. I think the time horizon for this one is 1-3 months. Within 3 months, all these targets will be hit and then we will be blessed with additional growth.
Thanks a lot for your continued support.
If you enjoy the content, feel free to follow. I share new charts every single day.
It is my pleasure to write for you.
Namaste.

Worldcoin, How Long Will It Take For A $30 (2,544%) Target?Do you think a $30 target is possible for Worldcoin in under 6 months? What about a target of $19?
$19 gives 1,552% while $30 would yield a total of 2,544%. That's potential profits for this newly developing bullish wave.
The low was hit more than two months ago already, 7-April. This is important. Normally the build-up process takes some three months, and we are already two months in. This means that next month the market can become extremely green. Or by the start of next month everything will be 3 to 5 levels up. For Worldcoin this would be a minimum target of $9. That's 729% potential profits.
Two months just to recover from the market bottom. Three months for bullish momentum to be fully present and a new high established. Then a retrace or correction and then the final jump, makes sense? This is just a map, it can help us navigate the market, plan ahead.
We adapt to market conditions though as things can always change but this is the picture. This is how it always goes. The surprise can be prices moving beyond our calculations and that is always a nice surprise and welcomed.
Six months from now will put us in December 2025.
The next top can happen between October and December this year. These are good dates.
Since this project peaked in March 2024, no strong high in late 2024 or early 2025, this can be one of the pairs that continue growing into 2026.
Remember, some will end their bull market this year for sure and enter a bear market, others will continue growing into 2026. This is the most important part to keep in mind, it will make all the difference when taking profits.
We will continue with this thought process in one of the next charts.
I think of you when reading.
(I mean, "Thank you for reading.")
Namaste.

Ethereum Is About to Start Making Its Move to $4100Trading Fam,
Lot's of good patterns occurring on the crypto charts recently, Ethereum is no exception. Here you can see a valid inverse head and shoulders pattern has formed. 85% of the time, these patterns play out.
If we do break that neckline to the upside, I would suggest that $4100 will come fairly quickly. We do have a few resistance areas ahead of us where I expect some pause. But this will only give the market enough time to recognize they may be missing the rocket ride and hop in.
If we don't break that neckline this week, we could pull back for another week. But I think by the end of June our neckline will break and we'll be on our way.
Best,
Stew

Ethereum's Price Action Reveals A Bullish Bitcoin, $8,513 Next!The strongest possible bullish signal has been confirmed. Ethereum just moved daily above MA200. This is the first time this happens coming from a low point since November 2024, this is massive.
This signal reveals two things: (1) Bitcoin is bullish and set to continue growing. You've never seen Bitcoin and Ethereum going in different directions. If Ethereum is set to continue up, Bitcoin will also do the same. The market is one. (2) Ethereum is now ready to grow for 6 months straight, minimum, and this opens the doors for $5,790 followed by $8,513 in this bullish wave. There can be more of course.
This is one of the strongest signals (MA200) but also one of the easiest to spot. It works with high accuracy, never fails. The market is bullish when the action happens above this indicator long-term.
So now you know, for sure—for certain, what will happen next. Knowing that Ethereum will be trading above $5,000 soon, how are you going to maximize profits from this knowledge? Do what it takes to increase your profits and trading success. This is the opportunity of a lifetime, it can be life changing.
Thank you for reading.
I am wishing you tons of profits, great luck and amazing success.
Namaste.

Lido DAO Awakens While Aiming At 900%+, EasyLido DAO has been sideways for three long years and is currently trading at bottom prices. The best possible ever for buyers, traders, long-term holders or simply all those looking to make good profits with Cryptocurrencies, the time is now.
Here we can see how price action matches perfectly the support zone that was tested in August-November 2024, Nov-December 2022 and June 2023. True bottom prices.
It is also easy to notice a huge increase in trading volume after mid-2024. This means that after this date LDOUSDT traders became active which tends to happen before strong market action.
Now, there has been some bearish action but also bullish, "long-term sideways consolidation," and this is coming to an end. The next move is a bullish move and signals the start of the 2025 bull market for this pair.
Some pairs are already growing while others are still moving lower. Since it will take 6-12 months for the full bull market to unravel, it is normal to see some down while others are up.
This project will be a big one. This pair will produce massive growth.
Here we have a great price and great entry timing.
I am wishing for you the best.
Thanks a lot for your continued support.
Namaste.

Smooth Love Potion Classic Bullish Signals & Patterns —Easy 540%Smooth Love Potion (SLP) is now showing a classic set of chart signals, price action and patterns, all these have bullish connotations. An easy target of 182% can be hit next with 540% being possible mid-term.
Good morning my fellow Cryptocurrency trader, the altcoins market continues to heat up and this time for real. Some pairs are not only growing and recovering, but actually producing very strong bullish momentum, just imagine, this is only day one.
Here SLPUSDT has a repeating pattern across many of the altcoins that are moving first. Some pairs will move ahead of others and those with this pattern are the ones in line.
The major crash and low leads to a recovery, this recovery produces a retrace ending in a higher low. The higher low is in and we are all ready and prepared, from this point on we will see massive growth.
We have two targets mainly on the chart, there are more but not highlighted. These are easy targets, which means they have a high level of certainty to hit.
Aim high.
You deserve the best.
Whatever the market throws at you never give up, we win through consistency and perseverance.
Thank you for reading.
Namaste.

Compound 4X Lev. Full PREMIUM Trade-Numbers (PP: 2428%)This is a very, very easy set of targets that I am setting up here for Compound (COMPUSDT). And this trade setup with 4X leverage is low risk, very low risk. High potential for reward (more than 2,000%).
After June 2023, the dynamics changed from lower highs and lower lows, to higher highs and higher lows.
Late March produced the highest (buy)volume ever for this pair on this exchange. Someone in the background knows what is about to happen. Someone big. Now you know too thanks to this chart and trade-numbers.
The stop-loss is not meant for your liquidation nor for any trading, it is meant to indicate when the chart setup goes bad. Leveraged trading is for advanced traders.
If the stop-loss conditions are met, maybe monthly rather than weekly, the chart setup and market conditions are lost. Obviously, the stop-loss conditions can be activated and yet, growth still happens within weeks or months. Stop-losses should be ignored. Only advanced traders should use those.
This is a high probability trade setup. High risk vs a high potential for reward.
The numbers are meant for illustration only. Some people can use them to make predictions, others to decide where to buy as simply Cryptocurrency investors, while still others can use them to trade.
How you use these numbers is to you. I am not responsible for any loses, for how the market behaves nor any of your mistakes. Trading is a game for adults. A game, truly. This game can produce money as well as losses.
Trade at your own risk. I am wishing you success and great profits. You can do this. Just keep trying, work hard, study... Focus.
Full trade-numbers below:
_____
LONG COMPUSDT
Leverage: 4X
Entry levels:
1) $46
2) $43
3) $41
4) $36
Targets:
1) $50
2) $55
3) $60
4) $75
5) $88
6) $100
7) $122
8) $140
9) $165
10) $180
11) $205
12) $245
13) $274
14) $311
Stop-loss:
Close weekly below $35
Potential profits: 2428%
Capital allocation: 3%
_____
Don't mind my disclaimer on these trades. Some people can't face the fact of a losing trade. It is for those.
Responsible people like you and me know how the game works. We are happy to accept our winnings as well as any loss. We do not blame others for our mistakes. Life is full of challenges, we use these challenges as learning experiences. Trying circumstances are what made us into who we are today.
When you are going through something hard, it can be tough to face this reality with a smile in your face. When you look back to the past, in retrospect after all is great, you might even laugh and wear a badge of honor for the hard times you were able to overcome.
Think about it, a challenge that was once a nightmare, is now only a story that you can share and enjoy while you continue to grow.
Trading can help you improve your life, if you are honest with yourself and accept the fact that the market cannot be controlled. Yes, there is some manipulation, but nothing can control how nature works.
Nature works in cycles... After going down, everything grows.
Cryptocurrency is going up. Get used to it, because we are about to be showered with tons of profits, lots of money for all those who take the risk to buy and hold. Buy and hold now that prices are low.
Namaste.

UNISWAP - Long Term Buy Opportunity 🚨MartyBoots here , I have been trading for 17 years and sharing my thoughts on UNI here.🚨
UNI vs ETH | Why Uniswap Deserves a New All-Time High
In this video, we dive deep into the fundamentals of Uniswap (UNI) and explore its close relationship with Ethereum (ETH)—the blockchain it’s built on. While ETH has regained massive attention with its expanding ecosystem and institutional adoption, UNI is still massively undervalued in comparison, despite powering one of the largest DeFi protocols in the world.
⸻
Fundamentals Breakdown:
• Uniswap is the backbone of decentralized trading, facilitating billions in volume without intermediaries.
• Fee switch mechanics and upcoming v4 upgrades have the potential to drive real yield to UNI holders.
• Unlike ETH, which serves as a Layer 1 gas token, UNI represents governance and future revenue potential over a growing protocol.
⸻
Why UNI Has Upside:
• UNI still trades far below its all-time highs—even as Ethereum ecosystem activity rebounds.
• ETH has already made major recovery moves, but UNI hasn’t caught up yet—creating a bullish divergence.
• With the rise of on-chain liquidity, tokenized real-world assets, and institutional DeFi, Uniswap is positioned to be a key infrastructure layer.
⸻
My Thesis:
• ETH = Base Layer | UNI = DeFi Rail
• As ETH grows, Uniswap scales alongside it—capturing more swap volume, TVL, and governance power.
• If Uniswap activates protocol revenue, UNI transitions from a governance token to a yield-bearing asset, giving it real valuation metrics and long-term investor interest.
⸻
Watch to see my full breakdown, including:
• UNI vs ETH price chart comparison
• On-chain stats, dominance shifts, and upcoming catalysts
• Why I believe UNI is set for a breakout back toward new all-time highs
⸻
Like, comment, and follow for more deep-dive crypto breakdowns and technical setups.
#Uniswap #UNI #Ethereum #ETH #CryptoAnalysis #DeFi #TradingView #AltcoinSeason #PineScript #FundamentalAnalysis

WalletConnect Hits Support, Recovery Wave Turns into Bullish-Wav"What goes up, must come down; What comes down must recover." It is a new saying.
Here we have WalletConnect trading at support. Once support is found, specially after a strong correction, we can expect the market to turn and produce growth.
Consolidation preceding the ath happened between late April and early May. This same zone is the one that was activated as a higher low. A clear support.
We sell at resistance and buy at support. Keeping it simple.
This pair is now a buy. Buy and hold.
Remember to do your own research and planning because market conditions can always change. While we expect a bullish breakout to happen within weeks or days, sometimes it can take months. It can take months but the end result is always growth. We are now in the 2025 altcoins market bull market so buckle up, it will be a wild ride, it will be profitable and it will be fun.
Namaste.

Altcoins Market Bull Market Confirmed, AxelarThis is the same chart as Ravencoin; These are the same price dynamics and awesomely, the same results.
Good morning my fellow Cryptocurrency trader, this is a wonderful day because the altcoins market bull market is already confirmed, let me show you some more proof.
I used first Ravencoin as an early signal showing that the 2025 bull market is here, strong long-term growth; a bullish continuation, a new advance, higher prices next. The biggest bullish wave and bullish action since 2021 for the entire Cryptocurrency market.
Here is the pattern again explained:
1) There is a rise in late 2024, it lasted only one month from November through December. This coming off the August 2024 market bottom, when Bitcoin produced a flush.
2) The December 2024 high leads to a strong correction. This correction has three stop points. 3-Feb. mid-March and 7-April. 7-April marks the bottom for most pairs with the usual variations.
3) An initial recovery from the 7-April 2025 low leads to some growth. Some pairs grew 100-300% while others grew 30-60%.
4) This recovery gets corrected and ends in a higher low.
5) This higher low signal the start of the next advance, very strong bullish action. This is what you see on the chart.
Axelar (AXLUSDT) produced a very strong bullish breakout, we have more than 90% green on a single day. This is only the beginning, and many altcoins will be doing the same. Literally hundreds of altcoins will perform like this in the coming days.
The bull market is here and already confirmed.
It is still early, choose wisely.
Some will move now while others will continue lower.
Some will move but it will take months before they turn green.
Take your time looking at the charts and making your choice, choosing correctly means everything. It means the difference of winning daily and big vs staying holding something doesn't that doesn't grow.
If you agree make sure to follow.
If you have any questions, your comments are welcomed below.
Thanks a lot for your continued support.
Namaste.

Correction? Show Me the Correction —Bitcoin Is Going Up!There is no correction and this "double-top" is nothing similar to 2021.
First, the wave that led to the April 2021 ath was a major hyper bullish wave starting March 2020. A total of 392 days of bullish action non-stop with 1,615% total growth. From a low of $3,782 to a high of $64,854, Boom!
The wave that led to the January 2025 all-time high was not a mega hyper, hyper-bullish bullish wave, instead it came after a long period of consolidation and a flash crash, which means the establishment of a long-term support. It started August 2024 and lasted 168 days total growth 124%. Completely different, so don't tell me that market conditions are the same because they aren't, we are not stupid, actually, we are very smart, right my friends? Long-term followers, readers and supporters!
The first high in 2021 happened in April the second in November, 210 days apart.
In 2025, we have a top in January and another one in May, 119 days. Very, very different.
In 2021 the altcoins rallied, everything rallied and everything was trading at new all-time highs before the bear market.
In 2025, nothing has rallied and most of the market was trading at the bottom. So we had an early peak in 2021, we get a late peak in 2025.
Since we had a long-term double top in 2021, we get a blow-off top in 2025, late 2025. Do you understand?
I am the Master of the charts!
Bitcoin is not done; it isn't over. We have an entire bullish wave before the bull market is over. This bullish wave is the fifth wave which is the speculative wave, in this wave anything goes. The market will go crazy. There will be euphoria, passion, craziness, money, growth!
The altcoins will be hitting new all-time highs and everybody will go crazy. NFTs, DeFi, DePin, RWA, Memes, POW, Gaming, AI, new, big, small and old, all welcomed, everything will grow. When the pixelated rocks start selling for millions of dollars, that's when the bull market ends.
When people start saying "Bitcoin will go to $1,000,000 in this cycle." That's when the top is in.
When Bitcoin starts trading at $219,999 and starts to slow down and Ark Invest comes up and says, "Bitcoin is going to $5,000,000 next"; when Michael Saylor starts saying, "I will be buying the top forever..." Get ready because that's the end. It isn't happening, now people are still talking about corrections and doubt, that's not the end of a bull market, that's the transition period between an advance a correction and the next leg up.
Just wait and watch. Just watch my friend... Just watch!
I assure you, Bitcoin is going up!
Namaste.

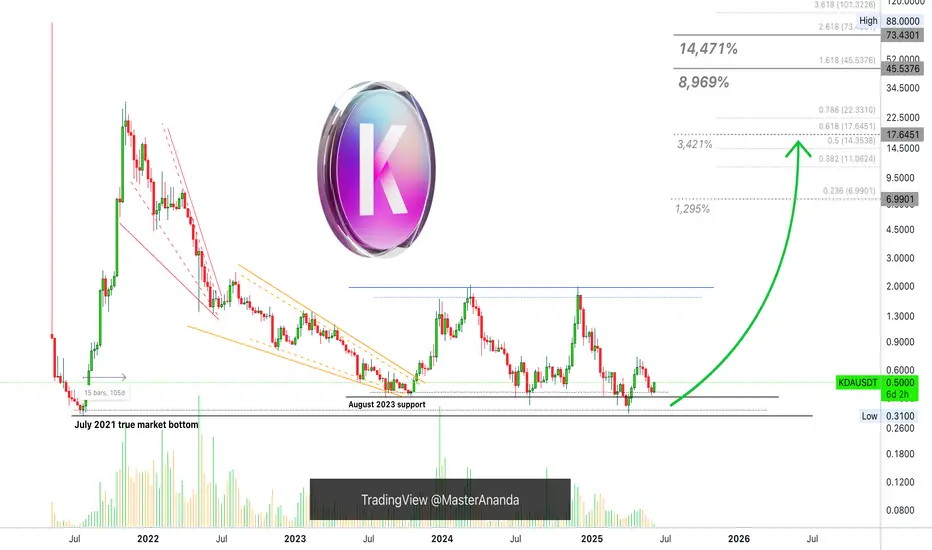
Kadena, Is 14,471% Truly Possible In 2025? Read The Chart!I love Kadena's previous bull-market. From July 2021 through November 2021, it was pure joy, straight up; huge profits of course.
It lasted 105 days... Total growth almost 9,000% and then the market went bearish, and then the market went sideways, for years... I think this time we will experience something awesome like the last time. It only happens every four years do you agree?
Cryptocurrency goes wild every four years, it is what it is.
So 2021 leads to 2025. It is already mid-2025 and we are ready... So ready, yes ready, truly ready... Yes!
We are ready and the price, and the chart and the markets, the candles, the signals it all looks great. Ready for new growth and new high-profits Cryptocurrency millionaire, let's trade!
KDAUSDT. The August 2023 support was also the July 2024 support, August 2024, February 2025 and now June 2025 as a higher low. The April 2025 low pierced through this level and that's the reason why the chart now looks great, because KDAUSDT is trading back-above it, the August 2023 low. Being above this level means ultra-bullish.
Anyway, we have huge potential for growth on this pair. Kadena has an easy target of 1,295%, that being $6.99. A strong target for 3,421% at $47.65.
There is an ATH at $45 for 8,969% and another one at $73 for 14,471%.
Thank you for reading.
Namaste.
Altcoin Cycle - Cycle bottoms spottedAs I demonstrated on this picture. I believe I identified the cycle bottoms and marking a new cycle low. With the BITSTAMP:BTCUSD price rising now and CRYPTOCAP:BTC.D about to meet hard resistance levels, I believe this will increase the propability of a start of the altcoin cycle. Also known as the Altcoin season.
CRYPTOCAP:OTHERS
CRYPTOCAP:OTHERS.D
COINBASE:ETHUSD
BINANCE:SOLUSD
INDEX:BTCUSD
BINANCE:BTCUSD

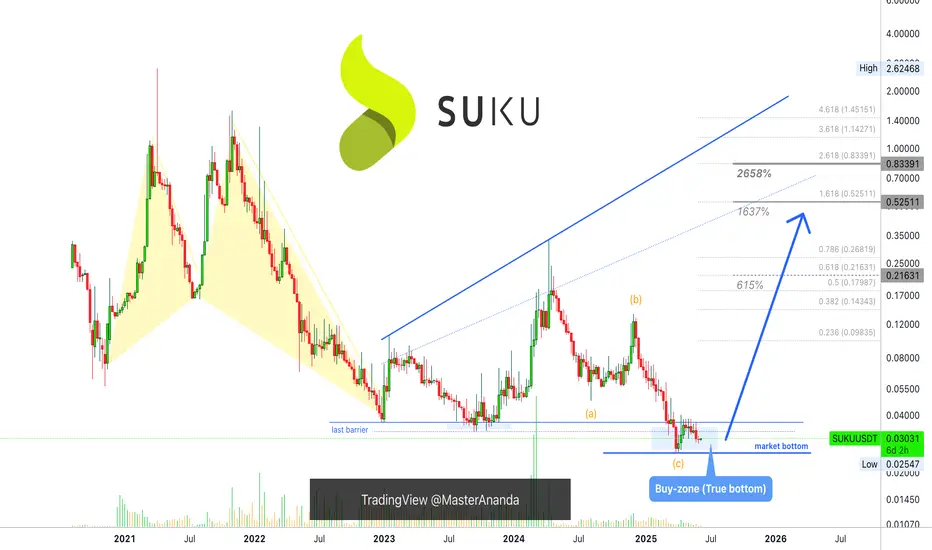
Suku, High Targets Only (615% - 2,658% Profits Potential)Between late 2023 through mid-2024, SUKUUSDT produced a 900%+ bullish wave. The action in late 2024 was a non-event.
Here we can clearly see how a pair that grew strongly in 2023 performed poorly in 2024. Those that performed poorly in 2023 did great in late 2024. But still, this isn't bull market type of action.
SUKU can grow more than 900% in a transition year, this is awesome. How much can it grow in a bull market year when everything goes wild? Great question. Growth potential is huge.
I am showing some targets here, strong targets but the possibilities exist for this pair to grow even more than what is shown on the chart. This is a small cap. and small cap. projects can do awesome when the bull market is in full force. Right now, we are not there yet.
SUKUUSDT is trading at the bottom, true bottom; the lowest prices ever in its entire history. This is simply great. You can't go wrong buying when prices are low. No planning needed, just buy and hold.
Risk becomes very limited, it can be counted in time, nothing more. While the reward potential can be extraordinary, off the chart.
A spot trader can simply buy and accumulate. If you are reading this now, you have great timing. The only time better than now was in early April, but the retrace pushed prices back near the same level, so everything is good.
Three months from now you will be dealing with a completely different market, you will be surprised to see how fast things change. Now everything is low and depressed, in a several months, you won't even be able to imagine that such a situation as now is even possible. Everybody who missed the train will be thinking, "why didn't I buy back then?"
Take action now.
Thanks a lot for your continued support.
Namaste.
Secret Network Enters Buy Zone! Best Possible Prices (1,730% PP)Some people will look at this chart and runaway. They can see a brutal bear-market followed by weak bullish action. I understand, but, when I look at this chart I see an opportunity, the best possible prices to buy before the 2025 bull market wave.
Good afternoon my fellow Cryptocurrency trader, I hope you are having a wonderful day.
Secret Network grew 400% in late 2024, in a single month. Between November and December. How much growth would be possible in 6 months, or an entire year? Good thinking.
The bullish wave from 2024 was corrected by more than 100%. All gains removed and then some more. Now, the action is back above long-term support.
The same price range that produced the 2024 bullish wave is active again. And, certainly, this same zone will produce a new bullish wave. The difference of course is the size, the last wave was just a minor jump, a price bump, what we are about to experience is a bull market cycle. A completely different scenario.
The best time to buy is when prices are low. Prices are low now, the lowest possible and Secret Network just produced a shy higher low.
After five red weeks and this higher low, you can say this pair is ready to grow, long-term growth. Feel free to follow for more.
Namaste.

FARTCOIN is primed for a 3X move!🚀 CRYPTO:FARTCOINUSD April rally cooled off, buyers stepped in at the $1 - $0.75 extreme zone, and now wave (3) is gearing up for liftoff.
🎯Targeting $2.3 - $3.2—momentum is building fast!
Are you strapped in for the ride, or still watching from the sidelines?

KAITO is setting up for its next 2x move!📈 BINANCE:KAITOUSDT Found strong buying interest in the #BlueBox zone and now it's gearing up for a potential 100% rally.
🚀 Targeting $3.3 - $4.3 as momentum builds.
Did you catch the dip, or are you waiting for confirmation?

others - altcoins It looks like the altcoin season is about to begin and we will witness an alt party or alt season.

Altcoins in Focus: Aptos, KAIA, and Ravencoin (RVN)Amid Bitcoin’s rapid growth and renewed interest in Ethereum, investors are increasingly turning their attention to altcoins—alternative cryptocurrencies showing strong potential for sharp gains. As of early June 2025, Aptos (APT), KAIA, and Ravencoin (RVN) stand out for their price surges and growing interest from major exchanges and analysts.
Aptos, a next-generation blockchain platform developed by former Meta (ex-Diem) engineers, has secured its place among the top 50 by market cap. In recent days, the token broke through a resistance level at $9.20, signaling a possible continuation of the uptrend. Its appeal lies in its scalability and its unique MoveVM architecture, which makes it attractive for developers in DeFi and NFT applications.
KAIA, a new token in the AI and metaverse ecosystem, gained over 15% this week following a Binance listing and integration with several major Web3 projects. Investors see KAIA as a potential “new Render,” focusing on neural computation and digital identity infrastructure.
Ravencoin (RVN), a long-time presence in the crypto space, is regaining popularity. With its focus on asset tokenization and copyright protection on the blockchain, RVN surged 14% after announcing partnerships with several independent music platforms.
The rise of these altcoins demonstrates that there is room in the crypto world not just for the giants, but also for innovative, purpose-driven projects capable of capturing market and user interest.

GRT | Altcoins | MASSIVE UPSIDE Potential on The GraphAnother altcoin that has great upside potential is the Graph BINANCE:GRTUSDT
The Graph from a weekly perspective may seem like there's not much action, but if you zoon in to the daily timeframe we see a different picture.
WEEKLY:
VS DAILY:
We can see anything from a +40% increase to a -30% dip in just a few days; a picture that is lost when we look at the weekly. This is IDEAL for swing trading.
Once you've established the general direction from the MACRO, swing trades become very viable (spot). If your patient enough to wait for a few days, a +30% could easily be achieved within a two week timespan.
______________________
BINANCE:GRTUSDT

ALTCOINS made a 1D Golden Cross. First since U.S. elections.Crypto Total Market Cap just formed the first 1D Golden Cross ince November 6th 2024, which was right after the U.S. elections. The rally that followed made new highs. Since the Bear Cycle bottom, that is the 4th 1D Golden Cross and the minimum the market surged around such formation was +73.10%. This means that we can expected a 4.03T market cap at least.
## If you like our free content follow our profile to get more daily ideas. ##
## Comments and likes are greatly appreciated. ##

LINK Bulls Building Toward a Chain ReactionIf you find this information inspiring/helpful, please consider a boost and follow! Any questions or comments, please leave a comment!
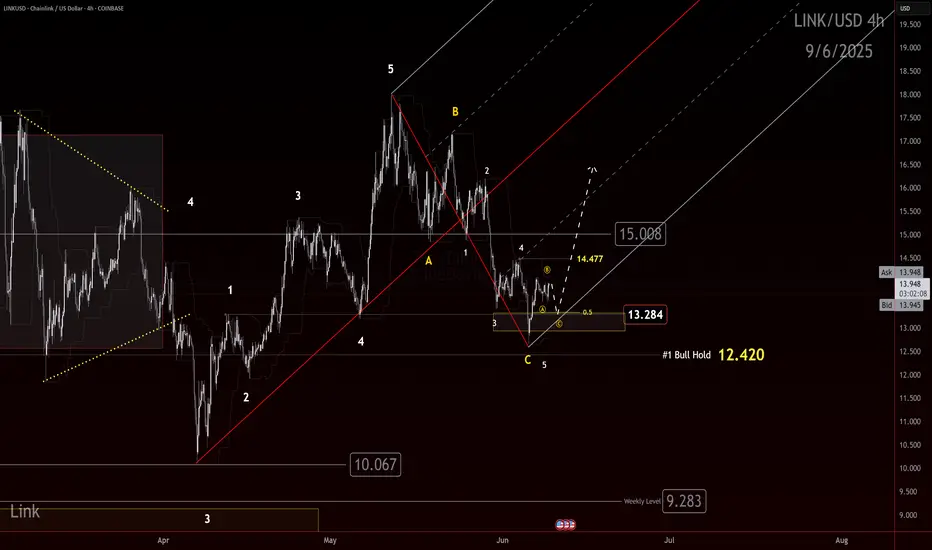
LINK just gave us a clean reaction out of an identified box. Bulls may finally be gaining control and a trend shift up is on the table.
We had eyes on this box for a potential reaction. The market delivered. Now bulls need to prove they can build on it. The first key is to defend 13.284. As long as this level holds, the case for a higher trend remains alive.
Next, bulls need to clear 14.47. That is the first smaller degree LH that must be taken out to confirm that buyers are pushing through the structure.
The big step remains 15.00. This has acted as a major flipping level. A true test for the bulls will be whether they can reclaim and hold above it. If they do, the door opens for stronger upside follow through.
The path is clear:
💥 Hold 13.284
💥 Break 14.47
💥 Reclaim 15.00
We will continue to track this closely with the Elliott Scanner mindset. If momentum picks up through these levels, this could become an attractive higher-degree setup.
Watch these levels carefully. Bulls have work to do, but the ingredients for a shift are building.
Trade Safe!
Trade Clarity!