Tesla Still Slightly Bearish Until FED Cuts RatesOne of my followers asked, "how about now?"
The question comes because he is bullish and I am sharing bearish charts.
Here is the thing, the chart is still bearish of course because of the red candles and the double-top. This can't change unless the last high is broken with significant rising volume.
I'll make it easy. This stock is likely to continue bearish until after the Federal Reserve cuts interest rates. When they lower the stuff, they do their magic their numbers then the market will turn bullish. So bearish before, bullish after. And this is a classic dynamic.
The market goes through a retrace or correction preceding a major bullish development. Since the bullish development will definitely push prices up, the market must express its bearish tendencies before the event shows up.
So bearish now. When the Fed announces that they are reducing interest rates later this month, then 100% bullish I agree of course.
Thanks a lot for your continued support.
This same analysis applies to Bitcoin and all related markets.
The altcoins though are a different thing because these are smaller and already trading at bottom prices. They will recover sooner and will start moving ahead of the pack revealing what is coming to the bigger ones.
All is good.
Thank you for reading.
Namaste.
Altcoins

TOP10 Altcoins Ready To Move, Strong Growth Potential —CommentWe already went through part 1, session 1, of the TOP10 altcoins that were yet to move and this time we are going to go deeper. We will go deeper and we will do it better. We are going to be looking at altcoins that are ready to move but it all depends on you.
Are you in?
If you are then leave a comment now!
That's all you need to do.
Bitcoin is ready and bullish and ready to grow.
Bitcoin is hyper-bullish, as bullish as it gets because our strongest support ever wasn't even tested in the recent retrace which was a weak retrace because it only lasted a few days.
The altcoins are super good right now with a higher low and ready to grow, but, with tens of thousands of options, which ones will you go for?
In the first wave trading pairs in the cryptocurrency market grew between 100 and 300%. Check. Perfect prediction, but things are about to get better.
The next wave instead of being capped at 300% can go much higher, the lower end will also be higher and pairs will grow some 200-500%. Some will grow more of course and others will grow less but this is the average.
I will look at the pairs from the TOP65 altcoins by marketcap, and do some bonuses as well. Are you interested?
»»» If you are interested, leave a comment with "Share the TOP10 Altcoins READY Move" and if there is enough interactions I will do this post for you.
So, which one is your favorite altcoin right now, the one that you think is ready to grow?
I'll see you in the comments section...
Thanks a lot for your continued support.
The altcoins market is starting to heat up.
Namaste.

Toncoin Major Advance Now! New All-Time High Incoming (PP: 200%)Toncoin entered its current price range in February, four months ago. After some shaking, this project has been sideways and four months sideways is a very long time when it comes to Crypto, there is good news of course.
When the drop happened in March a bottom pattern was confirmed. A bottom means the bearish trend ends and the market prepares to change.
Just a few days ago, TONUSDT produced really high volume, signaling the start of a new uptrend, higher highs and higher lows.
This post is a friendly reminder just to let you know that Toncoin is about to go up and it will de so really strong.
The signals are in. Consolidation has been strong. The action is happening above support.
An advance now will be strong first, then fast, then slow followed by additional growth. I mean, the bullish action won't stop at $5.51 nor $10 ($9.92), it will continue growing, growth long-term. We are set to experience a new all-time high, the strongest bullish action in the history of Toncoin, it is starting now.
Thank you for reading.
Namaste.

ALTseason May Show Up In 2025We found an interesting chart, which is showing us the ratio of TOTAL3(ALTcoins) market cap against Bitcoin with ticker TOTAL3ESBTC. Well, even this chart is showing that ALTcoins may start outperforming BTC soon. It can be finishing final subwave C of (Y) of a correction in blue wave B that can cause a new strong rally into wave C, which can bring the ALTseason similar as in the beginning 2021.

PEPE at Key Reversal Zone — Support Test Coming Soon?Today I want to look at the PEPE token ( BINANCE:PEPEUSDT ), which is part of the memecoin category, and provide you with a short-term analysis on the 1-hour timeframe .
PEPE token is trading in Potential Reversal Zone(PRZ) .
In terms of Elliott wave theory , the PEPE token appears to be completing the microwave 5 of the main wave C . The structure is a Zigzag Correction(ABC/5-3-5) .
Also, we can see the Regular Divergence(RD-) between Consecutive Peaks .
I expect the PEPE token to attack the Support zone($0.0000120-$0.0000108) after completing the main wave C .
Note: Stop Loss = $0.0000362
Please respect each other's ideas and express them politely if you agree or disagree.
Pepe Analyze (PEPEUSDT), 1-hour time frame.
Be sure to follow the updated ideas.
Do not forget to put a Stop loss for your positions (For every position you want to open).
Please follow your strategy and updates; this is just my Idea, and I will gladly see your ideas in this post.
Please do not forget the ✅' like '✅ button 🙏😊 & Share it with your friends; thanks, and Trade safe.

Magic Eden’s ME Token Eyes Bounce After Trump Wallet VolatilityOn June 3, , Magic Eden ( BINANCE:MEUSDT ) announced a collaboration with a project called to launch a new" Trump Wallet "
This announcement triggered a + 35% price increase , pushing the price of ME Token to approximately $1.17 .
However, shortly afterward, members of the Trump family, including Donald Trump Jr. , denied any involvement with the wallet or the project.
This resulted in a -20% price drop due to shaken investor confidence .
-----------------------------
Let’s see how ME Token is doing on the 1-hour timeframe .
ME Token is trading in the Support zone($1.03-$0.96) near the 50_SMA(Daily) .
From the Elliott Wave theory perspective, ME Token seems to have completed the main wave 3 and is currently completing the main wave 4 .
I expect ME Token to rise to at least $1.146(+15%) .
Second Target: $1.237
Note: Stop Loss = $0.95
Please respect each other's ideas and express them politely if you agree or disagree.
Magic Eden Analyze (MEUSDT), 1-hour time frame.
Be sure to follow the updated ideas.
Do not forget to put a Stop loss for your positions (For every position you want to open).
Please follow your strategy and updates; this is just my Idea, and I will gladly see your ideas in this post.
Please do not forget the ✅' like '✅ button 🙏😊 & Share it with your friends; thanks, and Trade safe.

NEAR Protocol Can Hit $35 or $52 in 2025 (PP: 2,000%+)Back to what I was doing... NEAR Protocol (NEARUSDT) closed red three weeks and this week is the fourth week with the action being bearish, why am I bullish?
Four weeks of bearish action and there isn't much, well, bearish action. Total drop is less than 30%. If you look back to January, or say May 2022, four weeks red would be something completely different; market conditions are not the same.
The market now is not bearish nor crashing so we are only seeing a retrace, a retrace is a small correction that ends in a higher low. Wait, let me make a long story short, NEAR Protocol is set to grow.
The market bottom in October 2023 is much, much lower compared to the low hit April 2025, much lower. So we have a very, very strong higher low. This only reveals something we already know, NEAR is bullish and bullish means up. Prepare for growth. The 2025 targets can be seen on the chart.
» How likely is a new all-time high in 2025?
Probabilities are really, really high. NEAR Protocol has a very strong chart that points to a long-term higher high next. The ath being $20, it can easily go higher thanks to the strong higher low mentioned above.
» How long will it take for this new ath to be hit?
Can be anywhere between 4-8 months. I know it is a wide range but with thousands of altcoins, some will move first while others will take longer to reach their bull market top. But late 2025 is the main date and some altcoins will continue bullish through early 2026.
Yes, this pair can be approached with leverage.
Low leverage is better. Low risk is better. Spot is best.
Thanks a lot for your continued support.
Namaste.

Major Enters Bullish Zone, 800%+ Profits Potential MappedSo this is a game on the TON network. It is good you called this to my attention because I love games. I don't play them but I love them, I think these are good for the Cryptocurrency market.
We are looking at MAJORUSDT, thank you for taking the time to read.
It is my pleasure to write for you and I am always grateful for your continued support... Let's read the chart.
There is high volume on the chart, twice. After 3-February and after mid-March. In both instances the high volume happened on green candles. It is an early reversal signal.
MAJORUSDT was moving down, a downtrend; this is when the candles were producing lower highs and lower lows. 11-March 2025 comes the bottom and the downtrend ends. The end of the downtrend is good news, this market is no longer bearish, it goes from bearish to sideways.
The initial recovery, small, peaks 20-March after 165% growth. Then comes the first retrace and the pair is bullish and strong because it ends in a higher low. 7-April of course, when the entire altcoins market bottomed. This higher low is a technical double-bottom. From this point on, instead of the initial breakout and sideways, we have the start of a bullish wave.
MAJORUSDT starts to grow and now it is up. Current action is happening 153% higher compared to March low, the market bottom.
After some higher highs and higher lows, MAJORUSDT is now sideways again, consolidating but this time bullish, building strength before the next bullish jump. So we can expect some more sideways, with some swings followed by additional growth. You can find two nice targets on the chart.
» The first target sits at $0.9347 for 275% profits potential, the second goes beyond 800%.
I love you.
Thanks a lot.
Your support is appreciated.
Namaste.

Bitcoin & The FED June 2025 (Beyond $200,000 New All-Time High)Before a major bullish event, the market tends to go sideways or into a retrace. Since the event is bullish, prices grow. Preceding the event the market gives out everything that isn't what will happen after the event, like a detox.
Now, Bitcoin is a very strange monster, kind of like a virus but in the good sense of the word. It changes, mutates, evolves, upgrades outdated decaying systems. So it isn't likely to crash just because the market is about to turn ultra-bullish. It is the other way around, since everybody already knows, nobody is willing to sell. In reality, everybody is buying like there is no tomorrow.
So Bitcoin can go sideways or into retrace until the Fed announces that it is cutting whatever interest, you know these things. So when they do their thing, the market will be ultra-bullish and that's when Bitcoin will produce its bullish continuation. Right now there is a period of consolidation which is being used by the whales as accumulation.
Remember when I was saying you will look like a genius for buying below 80K?
It is the same situation all over again. When Bitcoin is trading at $150,000 or $200,000, you will look like a genius for buying below $110,000. That's the way it is.
So, slightly bearish before the event. There can be a market flush but these are going to be limited because Bitcoins can be lost forever. It is a fight between whales. So if some whales decide to manipulate the market trying to cause some panic, other whales will be happy to buy everything at the lows and prices recover.
This means that Bitcoin will be consolidating until the announcement, after the announcement; "We will cut rates certain numbers of points..." Then all heaven will break loose. It will be money-up good news.
Do what you do, just be good, know that Bitcoin and Crypto will grow there is no way to stop this wave we are all going up. Those that were hating are going to be hated by their own selves because nobody will know who they are. We are going to be party-rocking like a rockstar because not only Bitcoin but we are going on a global bull market. You can bet on it. And if you do, you will be glad you did and you will be extremely happy with the result.
There is no way to stop Bitcoin.
There is no way to stop this wave.
The entire Cryptocurrency market will do awesome in late 2025. Are you prepared?
Thank you for reading.
Namaste.

Minswap looks like a good entry here.Trading Fam,
I'm seeing great potential on this Minswap entry.
First, we're oversold on all lower indicators.
Secondly, we're back inside of a green liquidity block.
Third, we're on excellent support (aqua trendline).
This trade is a no brainer. I'm setting my target for an easy 25% profit target at which point I'll take half off and let the rest ride a bit longer, trailing my stops as I go.
Stew

Binance Coin Consolidation Bearish or Bullish? $975 TargetThat's the question I am about to answer.
The action is happening above the March 2024 high. Binance Coin's current consolidation is considered bullish because it is happening above this level. There is also a series of higher lows since 2-Feb. 2025. There has been a strong recovery in the last four months.
The fact that the recovery is slow and extended gives it strength.
The action is sandwiched between 0.5 and 0.618 Fib. extension levels. These two levels work as immediate resistance and support.
Bullish patterns and signals are present all across this chart.
» BNBUSDT is bullish. Next strong target and new all-time high will be $975.
Thank you for reading.
Namaste.

Nano Will Trade At $28 in 2025, A New All-Time HighIt will be a surprise for many. It will not be a surprise for me as you can see I am sharing the chart, but many people will be surprised to see Nano trading at $28 even if it last there only a few weeks.
$28 is the standard 2025 all-time high projection for this bull market. Notice that I mention bull market all the time but there isn't really any, this is just a prediction and it will become true very soon.
XNOUSDT is now out of the long-term accumulation zone. A zone (price range) that was active in 2019-2020, before the previous bull market and also in 2022, 2023, 2024 and briefly in 2025. So Nano gave us years to buy and accumulate at amazing prices. This is about to end.
Not all is bad news—this is actually good news. Low/good prices are over but growth/high profits will enter the picture.
In short, prices will go up. Growth is starting now. Long-term growth.
Expect a long stretch of higher highs and higher lows. Can be 4-6 months of bullish action. Can be a bit less or can be more. Err on the positive side.
Namaste.

Sol, setting!? or will it rise!
In our last Solana ( CRYPTOCAP:SOL ) update, we discussed the potential for a bounce and posed the critical question: would it be a retest or a reclaim? That distinction is now front and center as price action unfolds.
The 141 area remains the level bulls must defend. A clean reaction here, ideally with a supportive pattern, would create favorable conditions for upside continuation. However, if price returns above 169 , the current impulsive structure downward would be invalidated and a recount would be warranted, that could also be the end of the correction.
Zooming out, the bigger question is whether we are in the C wave of a flat correction. If that’s the case, then this impulse Should be the final move before a change in trend. Conversely, an impulse shouldn't be taken for granted nor lightly, I could set the stage for further down side. If a C wave, this pattern could set the stage for a powerful move after it completes.
In simpler terms:
If bulls hold 141 and reclaim momentum, the structure could shift bullish quickly.
If this is a flat, the C wave down is still unfolding, and we may need to endure one more leg lower before a true trend reversal.
Either way, patience is key. Let the chart print clarity.

FET Correction Bottom Confirmed —Buy OpportunityThe next All-Time High for FETUSDT in late 2025 or early 2026 can reach between $5.42 or $8.56, giving us more than 1,600% profits potential from the current price. This is taking $8.56 as the next All-Time High. Let's get that part out of the way because I want to show you the end of the current correction. I am using the linear scale so it won't let me show you higher targets on the chart.
There was a resistance level in April 2022 as the bear market developed. This resistance was confirmed again in February 2023. It took 270 days, or 9 months, before this resistance level was conquered (broken). As soon as it broke, it was tested as support (Feb. 2024) and then a major rise. This major rise completed a long-term bullish cycle and after a bullish cycle a correction always develops.
How far down can the correction reach?
How low can prices go?
The correction started in March 2024 and is active until this present day. Obviously, the strongest resistance price range in the history of FETUSDT will need to be tested again but as support.
Now, FETUSDT bottomed last week and this bottom happened at the same level where the April 2022 and February 2023 resistance was found. As the action approached this level, volume started to go up. The next week, this week, we have a bullish candle and this is very likely the end of the correction; the bottom is in.
I just wanted to let you know that this level will hold because it was a strong resistance in the past. A resistance level once conquered turns into support.
As prices are now, it is the best possible time to enter; buy, go LONG.
This is a friendly reminder. I am wishing you tons of success and huge profits in this bull market that is just about to develop. It will be a bull market that will change the world. The world is already changing, but this bull market will close the deal. By the time it is over, Cryptocurrency will have taken over the world.
New money. The rich nouveau.
Namaste.

Chainlink Next Move Now Imminent, Strong Setup (8X)I still think that Chainlink has a strong chart setup that can start moving any time without warning.
The rise from 7-April lasted only six weeks and later the retrace lasted 3 weeks. That's 50% of the time. The sixth week that produced the peak was also a red week. When a pair is about to start moving, this is already a strong enough retrace. Three weeks out of a total of eight would be a perfect retrace, both are fibonacci numbers.
The retrace pierced the 0.5 Fib. retracement level and started to recover right above 0.618. The last candle close happened above 0.5. In short, this is perfect bullish price dynamics.
What's more, the short-term 0.618 Fib. retracement level here also marks the breakdown and recovery from July-November 2024. Back then we had a long bottom pattern and this time a short-term one. Another perfect pattern and classic; Elliotts law of alternation.
We have a good one here. I think Chainlink can be a win for us but only time will tell of course.
I thank you for reading.
First leave a comment and then follow.
Thanks a lot for your continued support.
Namaste.

Technical Analysis – HBAR/USDT + TRADE PLANTechnical Analysis – HBAR/USDT (Daily Chart as of June 4, 2025)
Chart Pattern: Falling Wedge (Bullish)
The chart indicates a classic falling wedge pattern, often interpreted as a bullish reversal signal.
This pattern is marked by descending converging trendlines, suggesting declining volatility and potential breakout.
Breakout point is illustrated just above the wedge’s resistance line, with a bullish breakout expected.
Key Support & Resistance Levels
Immediate Support Zone: $0.1625 – $0.1723 (blue zone)
Primary Resistance Targets:
Short-term: $0.1849 (top of Bollinger Band)
Mid-term: $0.2070 – $0.2200
Long-term: $0.3400 (strong historical resistance)
Indicators Summary
Bollinger Bands: Price near the lower band, indicating potential upside volatility.
Volume Profile: Slightly increasing near wedge apex, often a precursor to a breakout.
VMC Cipher_B: Multiple green dots signal bullish divergence; momentum may be reversing upward.
RSI (14): Currently recovering from oversold territory (~39.5), suggesting bullish momentum building.
Money Flow Index (ArTy): Moving back into the green, indicating capital inflow and potential accumulation.
Stochastic RSI: Crossed upward from oversold zone (currently ~23), a common signal for trend reversal.
Trading Plan
Long Position Setup (Swing Trade)
Entry Zone:
$0.1650 – $0.1725 (upon retest of breakout from wedge or candle close above wedge resistance)
Stop-Loss:
$0.1580 (below wedge support and key structure low)
Take-Profit Targets:
TP1: $0.1850 (Bollinger Band and resistance zone)
TP2: $0.2070 (resistance from March 2025)
TP3: $0.2200 – $0.2400 (target zone for full wedge breakout)
TP4: $0.3400 (macro-level resistance, if rally continues)
Risk-to-Reward:
Minimum R:R of 1:2.5 to 1:5 depending on TP level.
⚠️ Risk Management & Strategy Notes
Wait for confirmation breakout candle with strong volume above wedge resistance before entering.
Scale in gradually between $0.1650–$0.1725 if confirmed.
Trail stop-loss after reaching TP1 to lock in profits.
Monitor Bitcoin price trend and overall market sentiment—HBAR tends to follow macro market structure.
The combination of the falling wedge, bullish divergence, and oversold momentum indicators supports a strong potential for bullish continuation. However, conservative confirmation is essential before committing capital.
Outlook: Bullish bias, pending confirmation breakout above the wedge resistance.

Injective Easy 584% Bullish Wave Now PossibleInjective is now ready after a very long period of correction. The peak for this pair happened in March 2024 and in December 2024 there was no higher high, instead, a classic lower high and now a complete ABC correction. This ABC correction comes after a perfect, long-term, 1,2,3,4,5 bullish impulse.
After this correction ends will be the start of a new bullish impulse which will lead to a new All-Time High. The 584% target on the chart is an easy one. The 209% is super easy and can be approached by all types of market participants. This is a strong project.
There is really high volume as prices move to "baseline level." This is a support zone that was created after a long consolidation in 2023. Almost 7 months of consolidation. Sideways, and now this same range that worked as resistance is working as support. Support is confirmed because volume is rising, a very strong rise. INJUSDT is about to grow.
The entire Injective bullish wave, with a bottom in 2022 and a peak in 2024 amounted to 4,631% total growth. This is perfect and the market is ready now for a new round of growth.
Feel free to accumulate; buy and hold.
Namaste.

Compound 3 Years Consolidation = Ultra-Bull Market (PP: 3,164%)Compound has been consolidating for three years now, similar to DigiByte in time but the chart situation is different, the price here is much better because it is trading lower near support.
I cannot stress it enough. You cannot fail with a pair like this one. Trading at bottom prices after years of consolidation. Once it starts going/growing you will be sitting on a very strong position. Long-term growth. Huge potential for profits vs a minimum risk potential.
Ok. I say "no leverage" but I share leveraged trades. Remember, many people so there is a little bit for everybody.
The trick is to go below 5X. If you do 3X, you are always safe basically, very little risk and you can maximize profits. 5X is also do-able. If you go beyond 5X, it is possible of course and we do it all the time but you run the risk of getting liquidated. So there are some trade-offs.
But of course, you need to do your own thing I am only sharing the charts.
Spot trading, 100% success guaranteed. Worst case scenario, a long wait.
To achieve these two you cannot use a stop-loss. If you do use a stop-loss then you can be shaken out of your position through a market flush. If you buy and hold, set it and forget it, you can win for sure long-term.
Compound has been consolidating for three years and is getting ready to move. Once it starts moving there is no going back. The longer the consolidation phase the stronger the bull market that follows.
Namaste.

Solana Still Bearish, Moving LowerI will alert you here when the bearish potential is completely nullified. Right now, Solana is still bearish. This applies to all other major projects that I shared recently but I will also update those.
The maker produced a rejection yesterday, 3-June, as a lower high. This implies a bearish continuation. The two levels mapped on the chart are the main support zone.
Since the first level is already being challenged, we can aim for the second one.
Once the correction is over, we will go bullish again.
Some of the smaller altcoins can grow while the rest of the market crashes down. Choose wisely. It will be hard right now.
Namaste.

INJ at Key Compression Zone – Breakout Loading?Hello Traders,
CRYPTOCAP:INJ is currently trading between two key zones — a strong upper resistance and a solid lower support.
The price is getting squeezed between a descending resistance line and a rising support trendline, creating a high-confluence area.
So far, bulls are holding the support well. If price breaks above the upper zone, it could trigger a strong move upward.
However, if the support fails, a deeper correction may follow.
🔍 Watch closely — a breakout is brewing, and volatility is on the horizon.
DYOR, NFA

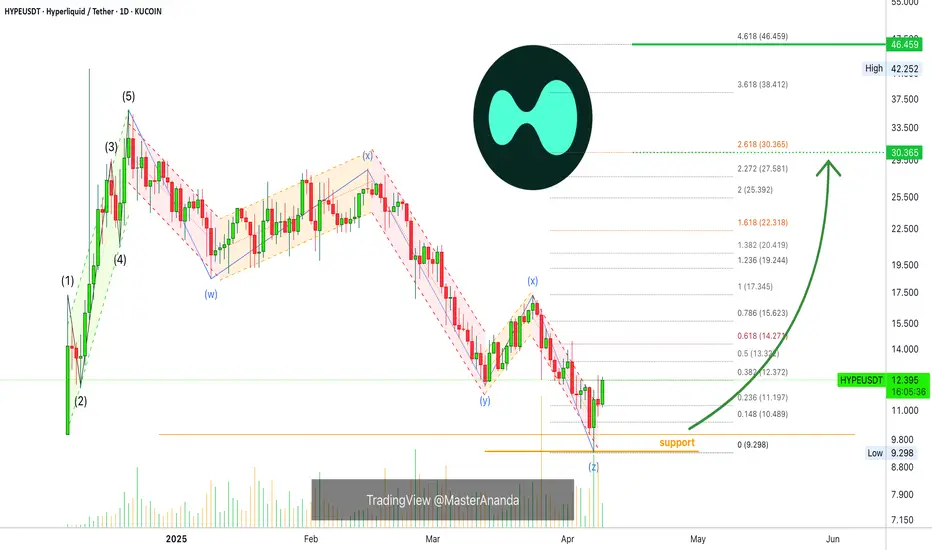
Hyperliquid: Your Altcoin ChoiceLow volume lower low and high volume reversal candle.
Here we do not have six months of data but the chart looks pretty clear. It is simple to read.
I can spot two perfect 5-waves pattern, one going down and another one going up.
Going down is the second one, the correction, and the session that hit a new bottom ended up as a higher low based on the close. That is, the low in December 2024 is $10. The low 7-April is $9.3 but the close happened at $11.5. ($11.5 higher than $10 ).
This can be a bullish signal.
Today's candle trades higher than the 13-March low. A full green candle.
After going down, the market tends to reverse and go up. The action is bullish on the short-term and this is a short-term chart.
Hyperliquid is good as long as it trades above support.
"Support" is clearly depicted orange on the chart.
I used this chart setup to open a short-term based trade.
The main targets are 145% & 270% as shown on the chart.
Thank you for reading and for your continued support.
You are appreciated.
Namaste.
Solayer 144% —The Fed Will Lower Interest Rates June 2025Endless opportunities this market has to offer. Even the same opportunity turns up over and over, again and again. If you missed it once, you can comeback and the market will opens its door for you to trade.
Easy win, easy buy, easy profits, easy hold, easy trade.
Solayer went even lower and matched the early March 2025 low prices. It can continue even lower before reversing so watch-out. It can also start moving right away. The trick is to buy and hold, not worrying about the short-term.
If the market wants to move lower, that's ok, we wait. If it moves higher, we have a win (green), this is also good, we wait for our target to hit to sell. You can use the target on the chart or you can aim higher is up to you.
If prices move lower, you can use a stop-loss or quit at a loss. No bueno.
If the market moves lower, it will recover because we are bullish now-long-term.
If the market was bearish, the overall market and cycle, then we wouldn't be talking about holding and long-term growth, we would be talking about taking profits and going home.
The Fed will lower interest rates later this month. This will create a major boom; Crypto is going up. You can more than double your capital with this pair. Endless opportunities the Cryptocurrency market has to offer.
Thank you for reading.
Namaste.

Critical Support Test for Bitcoin: 100K Holding or Breaking? Dear Traders,
Bitcoin's previous support level of 106,000.00 has now been broken, turning it into a resistance point.
At this moment, Bitcoin is at a critical stage, and the most important support level is 100,000.00.
In this zone, rather than opening a position, it is wiser to observe carefully.
If the 100,000.00 support level breaks, I will provide you with a downward target.
If Bitcoin holds at this level and finds support, I will share an upward target.
Right now, Bitcoin is choosing its direction. Will the whales push the price up with their purchases, or drive it down with their sales? We have to watch patiently, like a hunter, to see how this unfolds.👀
Each and every one of you is incredibly valuable to me! I am always working hard to bring you the most accurate and insightful analysis.
A huge thank you to everyone who supports my work by leaving likes.🙏
