Dogecoin Bullish · $0.70 & 240% Profits PotentialThis is a great chart setup and I can even say it looks better than Cardano, but why? Because prices are lower, therefore there is more room available for growth. So it really depends on how you look at it.
Seeing Dogecoin producing a rising channel is good, but knowing that prices are still really low compared to the last high (December 2024) and also compared to the all-time high tells us that there is still plenty of room available for growth and it is early. The rising channel after the correction ended reveals that the market—traders, holders, investors, etc.—are buying and accumulating for what comes next. Can be anything, but everybody is already buying...
The current higher low support was found right in-between 0.618 and 0.786 Fib. retracement levels. Here marked with blue dotted and purple dotted lines.
We could say that it is possible to see two to three days green followed by another low, a lower low, and this is definitely possible but there is no bearish momentum, no sell side force. And thus we can conclude on an early end for this retrace. Another reason is the fact that the rise is more steep now compared to April, so the retrace should also be more steep and have a shorter lifespan. Agree, agree, agreed.
Dogecoin produced a perfect channel with higher highs and higher lows, the next move is a major jump with resistance at $0.70 and total growth potential reaching 240%. We can continue with this pattern and track the market long-term. It is what I do; it is what we have been doing for countless years now... And we are only getting started.
The best is yet to come.
Thank you for reading.
Namaste.
Altcoins

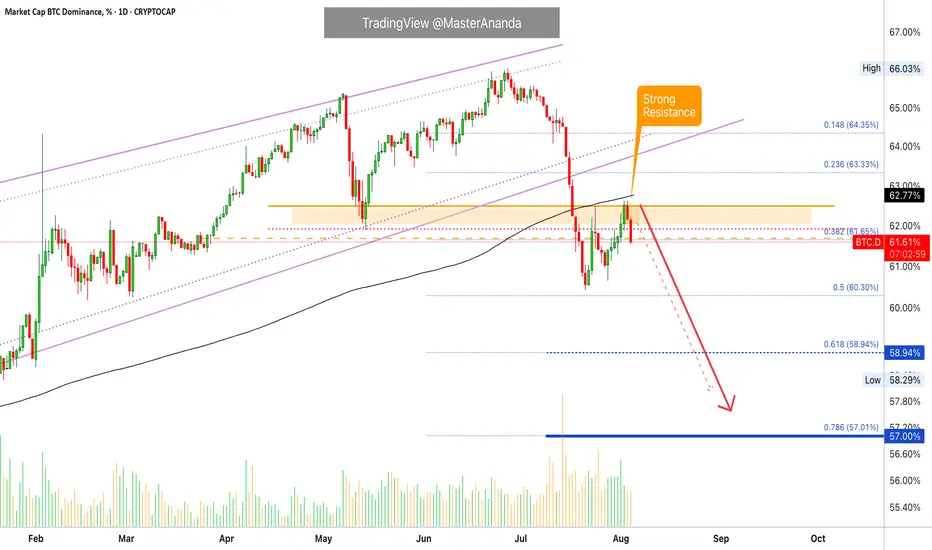
Bitcoin Dominance Update · Daily TimeframeThe rejection is happening right at "strong resistance." Notice that this is the same drawing from my previous update so it was drawn before the fact. Since resistance has been confirmed and the action is happening just as we expected, we can continue to follow our map as it is working.
The next logical move is a drop on Bitcoin Dominance Index (BTC.D), which translates into the resumption of the bullish wave for the altcoins, specially Ethereum and the big projects. It can also signal that Bitcoin will stop dropping and will either consolidate or move higher. This index reveals more than anything else the expected directions of the altcoins.
The retrace is over
The altcoins produced a retrace mainly between 21-July and the 2nd of August. In this period we saw many of the altcoins we are buying and holding move lower but only to produce a strong higher low. This higher low now will resolve into a very strong bullish wave, a bullish resumption.
Moving averages
Here MA200 daily has also been confirmed as resistance and trading below this indicator with a bearish bias, coming from a high point, gives out a very strong bearish signal. It means that long-term bearish action is now in place, the direction/trend. If the action was happening below MA200 but coming from a low point, this signal can have bullish connotations, right now it is bearish.
Bearish Bitcoin Dominance = Bullish Altcoins
The altcoins market will continue to grow, this is only the start. We are set to see growth long-term including now, next week, next month and until late 2025; maybe even for some portion of 2026, maybe even beyond.
Thank you for reading.
Namaste.
Will MEXC hit $12 in this bull run?🚨 NYSE:MX (MEXC) Looks Ready to Explode 🚨
Since 2018, MX has been forming clean HH & HL on the HTF.
Now it's approaching another potential Higher High — and if this plays out…
👉 $12 is on the table.
Structure is king. Bullish momentum is real.
⚠️ Only invalidation? Below $0.77 (CHoCH zone).
So here’s the real question:
Will NYSE:MX hit $12 next… or break the entire bullish structure?
Drop your thoughts 👇
NFA & DYOR

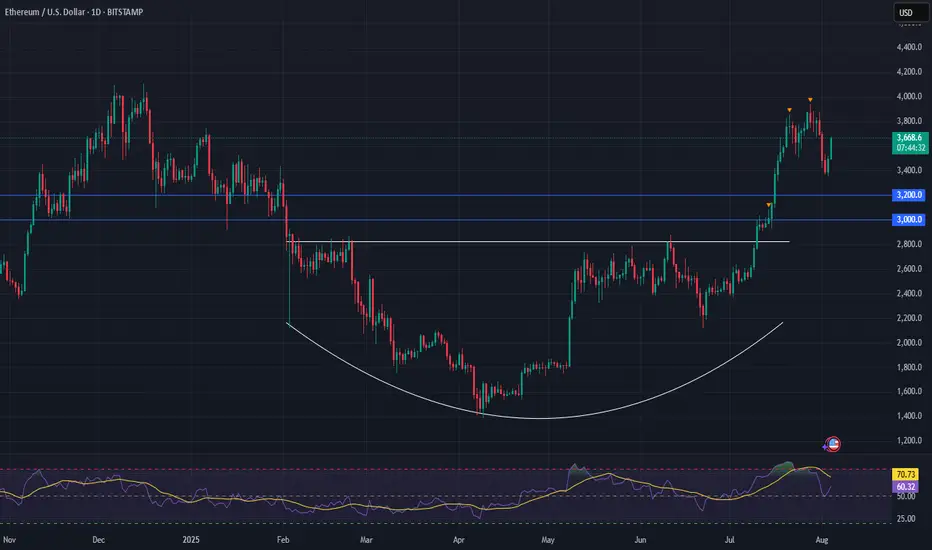
Ethereum (ETH) is setting up for a powerful moveFollowing a strong breakout, ETH has entered a healthy consolidation phase—setting the stage for its next leg higher.
Momentum remains firmly on the bulls’ side, with the breakout from a long-term saucer pattern fueling continued upside pressure.
📈 Technical Highlights:
✅ Short-term target: $4,000+ (breakout continuation)
✅ Long-term potential: $7,000+
🛡️ Key support: $3,000–$3,200 (bullish as long as this holds)
📣 Takeaway:
Ethereum is showing classic bullish structure. With higher-lows forming and strong support below, pullbacks are likely to offer high-probability entries for both traders and long-term holders.
#Ethereum #ETHUSD #Crypto #Trading #TechnicalAnalysis #CryptoTrading #EthereumPrice #Altcoins #Bullish #Breakout
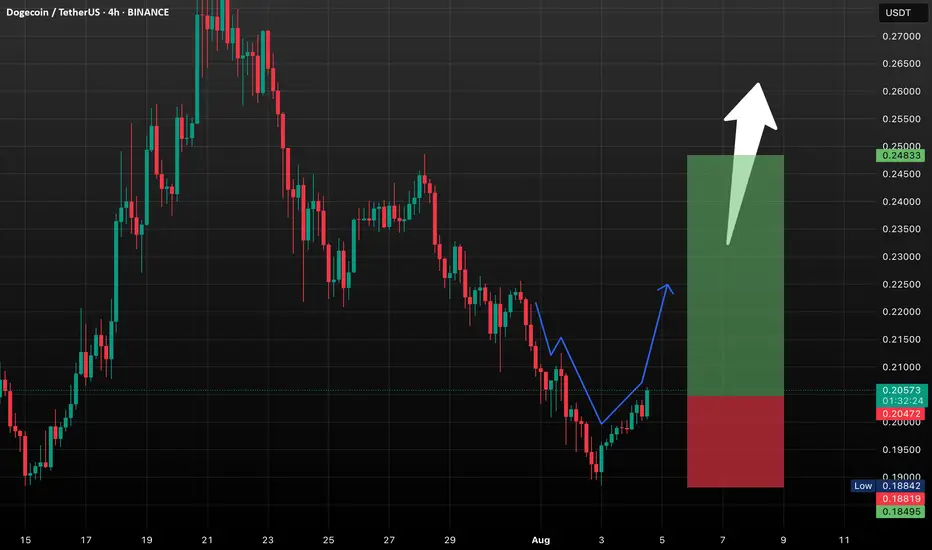
DOGE Setup Heating Up: These Levels Could Define the Next Move!Prediction for the Period Ahead (Next 1–2 Weeks):
*Base case: Holding support at $0.198–$0.200 → test $0.215.
*Bull trigger: Break above $0.215 with volume → possible move to $0.232 and higher.
*Downside risk: Falling below $0.182 could drag the price to $0.175 before any recovery.
DOGE is currently consolidating in a tight range with a neutral to slightly bearish technical bias. However, a breakout above $0.215, particularly supported by volume, could set the stage for further gains targeting $0.232–$0.287 zone. Conversely, a downturn past $0.182 opens the risk of a deeper test toward $0.175. In either scenario, the upcoming weeks seem pivotal...
Bitcoin Range for August?Historically August has been a tough month for crypto in the past with mostly flat to negative returns. For that reason, although not a perfect science, I would not be surprised if we see a rangebound environment continuation for BTC.
So what would that look like? Structurally there are three thirds to the range, currently price is looking to break through into the upper third after bouncing off the bottom third bullish orderblock.
Trade setups will naturally present themselves as rotational plays both bullish and bearish at the extremes of each of the thirds but much larger trades from the range top and bottom.
Altcoins are lagging behind BTC structurally so where BTC has been choppy for a few weeks, most large cap alts have hit their highs and are now looking to settle into a range before the next leg up.

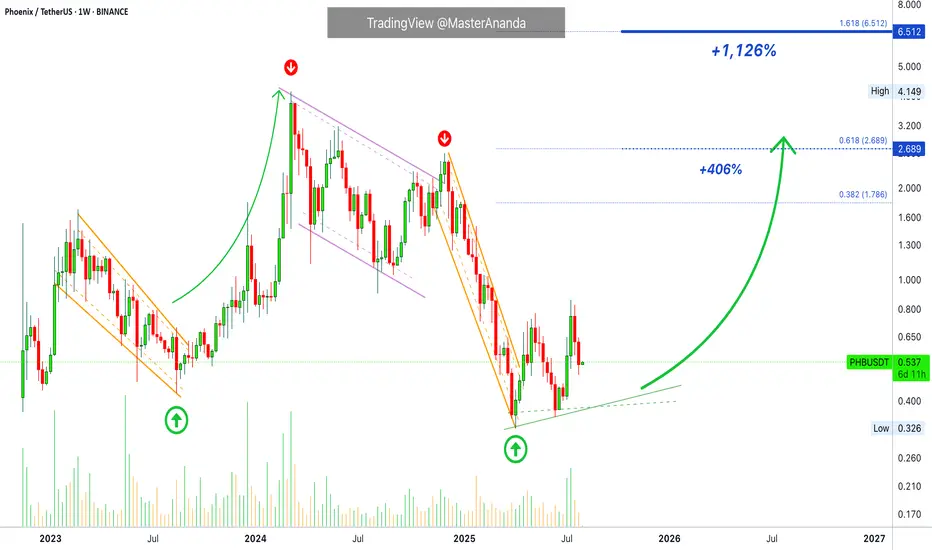
Phoenix Recovers · Easy 1,126% Target @ $6.5 Phoenix is just coming out of a major downtrend. After the main low there was a higher low and rising buy volume. Whenever there is a down wave that ends in strong buying, we know the market is about to turn, we have proof here.
PHBUSDT produced a down move in February 2023. Prices moved lower and a major low happened in August 2023, trading volume started to rise. The rise in volume predicted a change of trend. Then prices also started to rise and we ended up with a bullish wave.
PHBUSDT produced a down move in March 2024, this was a long drawn out correction. The market was moving lower with lower highs, the main one showing up December 2024 and then a major crash. A major low showed up April 2025 and now we are seeing rising volume, the signal that predicted an advance last time. With rising volume and a higher low, we can expect prices to rise next.
And this is it. Phoenix is trading at bottom prices but is slowly starting to recover. Strong bullish action is the next logical step. The market will grow. Crypto will grow. The altcoins are bullish now.
Namaste.
others \ btcOthers bitcoin pair has found support from the rising trend line since 2016 2017 and continues to recover

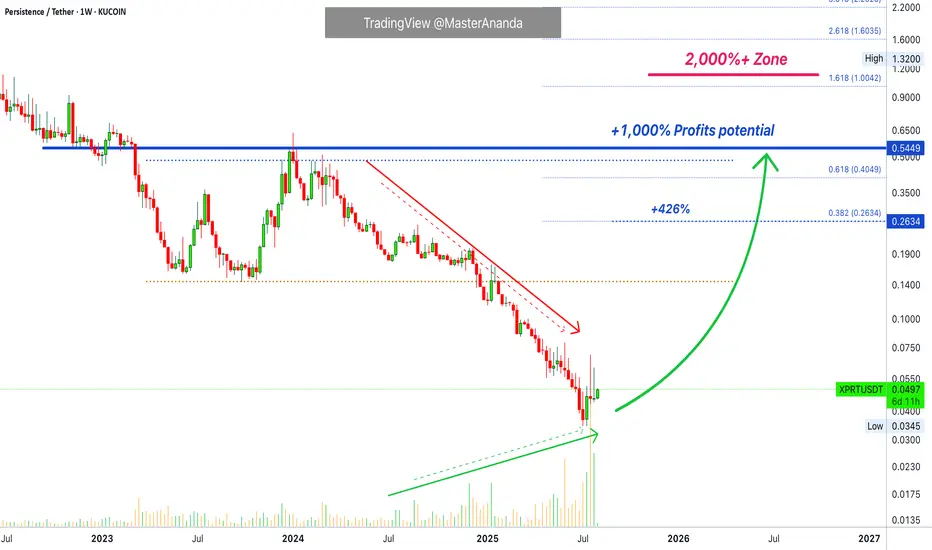
Persistence · Bottom Prices & 2,000% Strong PotentialPersistence. Here we have an interesting chart and trading pair and we start with a volume divergence. What is the divergence? Prices are dropping while volume is rising. XPRTUSDT starts to crash down and as it crashes down volume starts to rise up. And now we have a strong bottom with strong reversal candles. We just witnessed the last market flush. A strong, long and prolonged downtrend will lead to a change of trend.
I like this chart because it has huge potential for growth. Back to baseline prices, which is normally an easy target, in this case strong, give us 1,000% profits potential. As usual, there are low targets for those trading short-term and mid-term and higher targets for those trading long long-term.
The bottom is early but there is still a strong reversal signal because we have a v shaped bottom. A close this week at current prices or higher and we have full technical confirmation. Since we can preempt these movements, we buy before full confirmation because we are bullish on the market and while confirmation is not yet present here other pairs are moving ahead. We know that what one does, the rest follows; When one Crypto recovers, the rest of the market is about to do the same.
We focus on the long-term. We are going up. Short-term, anything goes. Mid- to long-term, watch how prices grow. We are still trading at the bottom, or very close to the bottom and long-term support. This is exactly when the market turns. When everything is down and out for a long while, when long-term holders start to give up, when you are ready to quit, that's when everything changes for the better. Never give up.
Namaste.
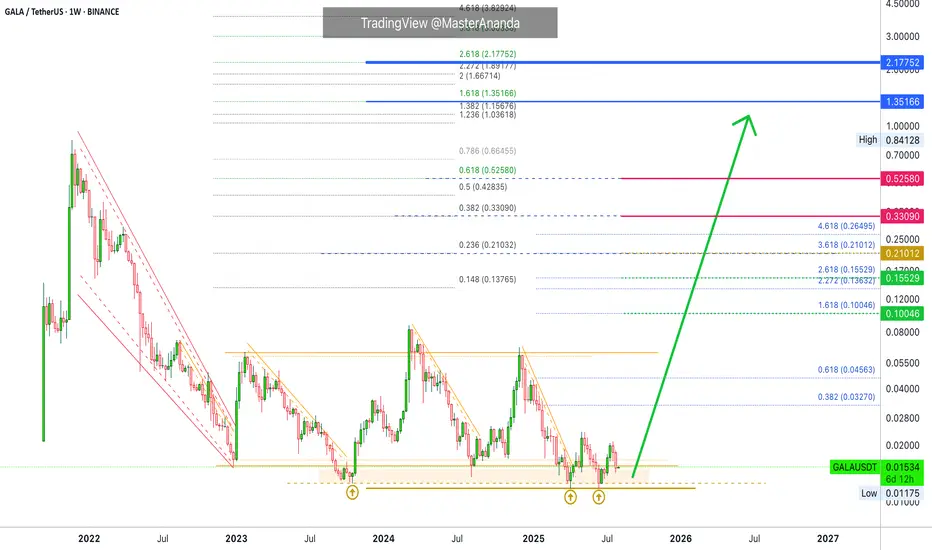
Gala Games Update · Let's Talk Waiting, Patience & TimingThe month is now August 2025. Gala Games closed two weeks red and is now trading back within the "opportunity buy zone." What to expect?
Market conditions have not change. Gala Games (GALAUSDT) is trading at bottom prices. The lowest ever and the lowest possible literally, the opportunity buy zone.
Just a few weeks back, we would look at this zone as a missed opportunity. Now we look at it with disinterest but this is actually the best time possible to buy and hold. This is the best price zone to accumulate in anticipation of what happens next.
The month is now August and we still have five months left in this year. August, September, October, November and December, late 2025. Our predictions, analyses and predictions are all still valid and on-track for a strong bull market in late 2025. There is plenty of time for a bullish cycle to start and develop here. Remember that it can happen that bullish action goes into 2026 and beyond.
Market conditions are great and we are still looking at bottom prices. From the bottom we grow.
Patience is key. This is the best time to accumulate.
Namaste.
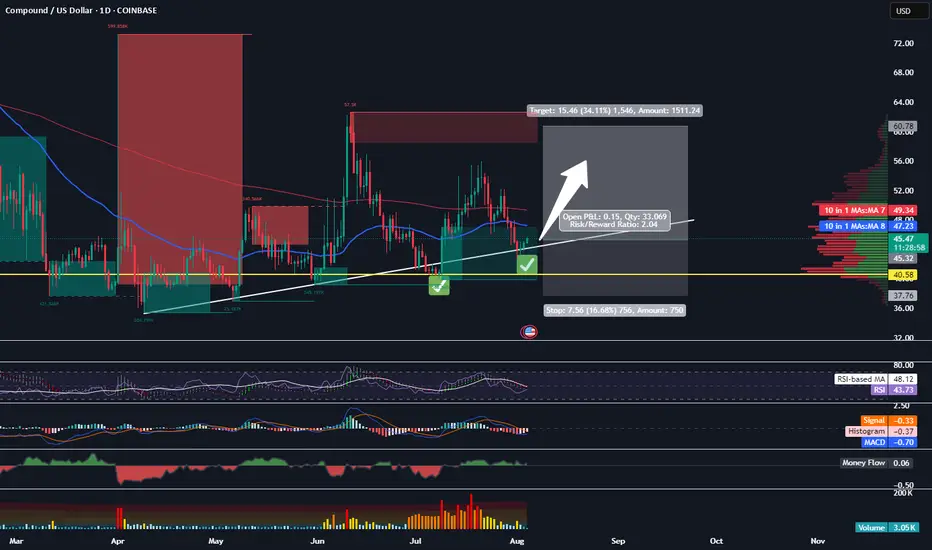
Buying COMP HereMorning Trading Fam,
After a several-week pause, my indicator is starting to light up with BUY signals again on a few alts. You may have noticed the update I gave on my TOTAL chart post. Price has come down to touch that 50-day EMA as expected. There was one more drop possibility (see post), however, I am taking my chance here, being a little more aggressive, and admittedly entering earlier than the crowd. I don't want to miss the run that I expect to come soon.
I received a BUY on FARTCOIN earlier and doubled up once again. Shortly thereafter, I received a signal on COMP here. We look to arrive on good support and are inside a beautiful block of liquidity. That is exactly where I received the signal to BUY, which I was hoping for. I'm jumping on this. Target will be around $60 with my SL set for $37.75 for a 1:2 rrr.
✌️Stew
04/08/25 Weekly OutlookLast weeks high: $119,809.82
Last weeks low: $111,917.76
Midpoint: $115,863.79
First net outflow for BTC in seven weeks (-$643m) following the FOMC data release and also month end. Yet again no change by the FED but the chances of Septembers FOMC giving us a rate cut has drastically increased, currently at a 78.5% chance of a 25Bps cut.
Month end usually gives us a pullback/sell-off as larger institutions window dress which often includes de-risking somewhat. We saw this last Thursday combined with the weekends typical lower volume has resulted in quite a significant correction for BTC. Altcoins have down the same as many assets reject from HTF resistance areas, the correction has been on the cards and isn't too worrying on the face of it.
What I would say is August seasonality is generally not a bullish month and so expecting price to rebound and extend the rally would go against historical trends. I could see more of a ranging environment taking place for several weeks before any next leg up is possible.
This week I would like to see where altcoins find support and establish a trading range where some rotational setups tend to present themselves.

SUI | Sui Network - Swing Long Idea - Altcoin
📊 Market Sentiment
Market sentiment remains bullish, supported by expectations of a 0.25% rate cut at the upcoming FOMC meeting. The weakening USD and rising risk appetite across global markets are favoring crypto assets in particular.
📈 Technical Analysis
SUI recently gained bullish momentum, largely following Bitcoin's strength.
We’re now seeing a healthy retracement, which is expected after a strong move.
The break of the LTF bullish trendline suggests potential for a deeper pullback toward HTF confluence zones.
📌 Game Plan
I'm eyeing the HTF demand zone around $3.06, which aligns with the 0.5 Fibonacci retracement—a key discount zone.
Just below this, we also have a higher time frame bullish trendline, which could offer dynamic support.
These overlapping levels provide a strong confluence for a swing long idea.
🎯 Setup Trigger
I’ll wait for a 4H bullish break of structure and the formation of an LTF demand zone before entering.
📋 Trade Management
Stoploss: Below 4H demand swing low
Target: Up to $4.44
I’ll trail my stop to lock in profits aggressively along the way.
💬 Like, follow, and comment if this breakdown supports your trading!
More setups and market insights coming soon — stay connected!

Bitcoin to $116K in a Week? Here's the Case Everyone's IgnoringI know it sounds wild — but hear me out.
BTC is primed for something massive, and the ingredients are all on the table:
✅ ETF inflows are quietly stacking
✅ Supply shock post-halving is still underestimated
✅ DXY weakening = flight to hard assets
✅ Global uncertainty = Bitcoin safety bid
✅ Technicals pointing to a breakout above ATH with no resistance until $100K+
We're seeing the early signs of parabolic structure forming — and if volume confirms, this could move fast. Everyone thinks a 2x in a week is impossible... until it isn't.
Not saying it’s guaranteed — but if you've been around long enough, you know BTC doesn’t move linearly.
👀 Watch the $72K breakout zone closely. If it flips with conviction and volume, $116K is not out of the question.
Drop your charts. Agree or disagree?
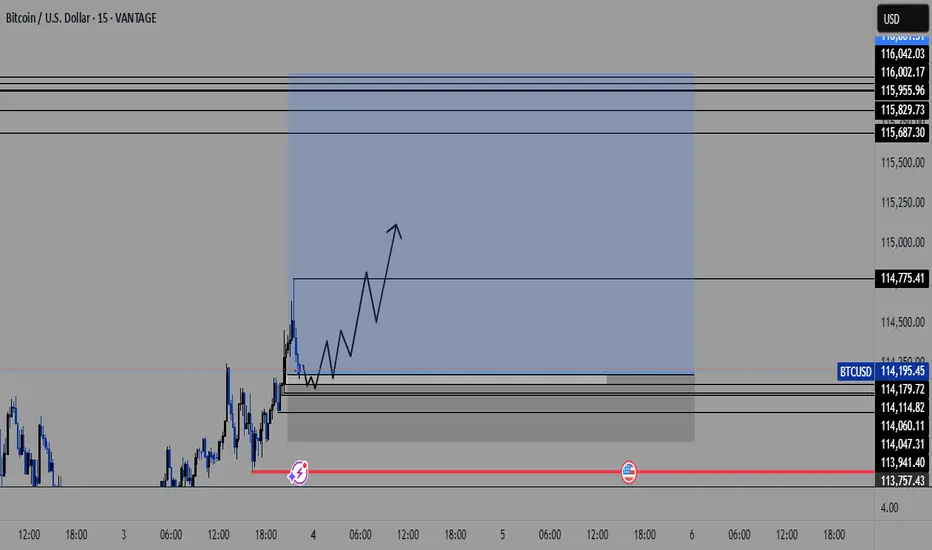
Bitcoin Hits $40,000, It Will Recover —Name Your AltcoinSorry, there is a typo there on the title, I meant to say: Bitcoin hits $114,000, soon to recover.
As you can see from our trading range, Bitcoin just went beyond the lower boundary and hit a new low, the lowest since 10-July but there is good news. There isn't room for prices to move much lower, this is part of the consolidation phase.
The first low happened 25-July and notice the high (bear) volume. The second low happens today and we have lower volume compared to 25-July, but Bitcoin hit a lower low. This reveals that the bearish move is already weak and losing force. It also reveals the fact that Bitcoin is about to recover.
Also notice the RSI, 2H. It hit oversold recently and went the lowest in a long while. Reversals tend to happen when the RSI becomes oversold.
Bitcoin is testing the lower boundary of the trading range, when this happens, the action reverses and moves back up. Prepare to see Bitcoin back above $120,000. It is normal and it will happen... But it is wise to give the market a few days. 5-August was bad last year. It gets bad but it also marks the bottom. Once the bottom is hit, growth long-term.
— Name Your Altcoin
Leave a comment with the altcoins you are holding now and I will do an analysis for you. The altcoins will also recover and we are witnessing just a small retrace. Hold strong as this is the most important part. We will have a very strong new bullish wave develop within days.
As Bitcoin moves to test support, it will reverse to test resistance next. Which one is your top altcoins choice?
Thank you for reading.
Namaste.

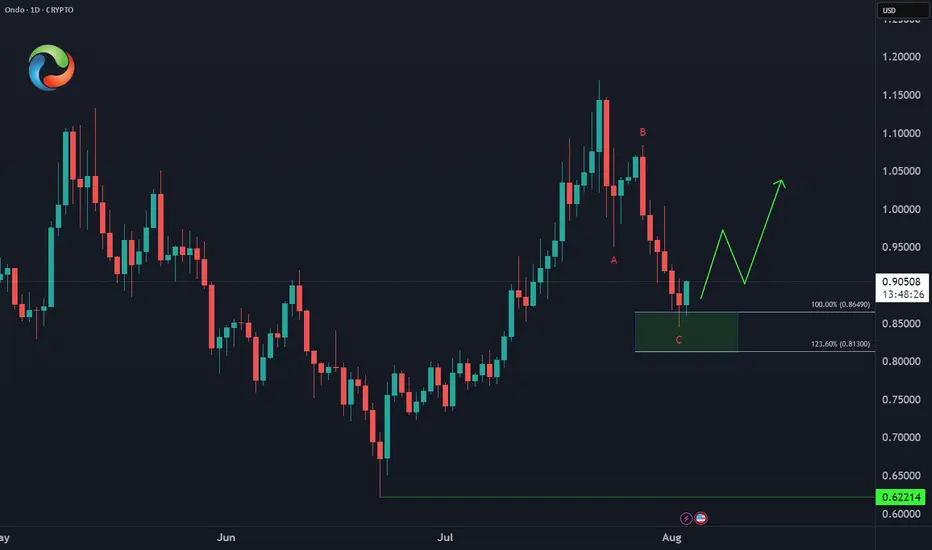
ONDO Ending Correction – What’s Next?🚀 CRYPTO:ONDOUSD completed a 3-wave pullback into the equal legs zone at $0.86–$0.81, signaling a potential bottom. A reaction higher is expected next week, and a break above the July peak would confirm bullish continuation toward $1.39 - $1.52.
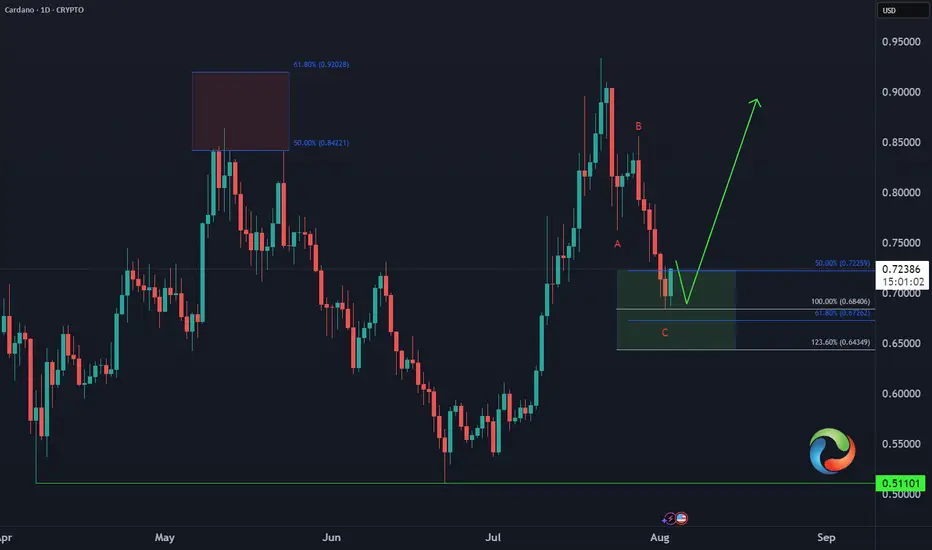
Cardano ADA Buying Opportunity📈 CRYPTO:ADAUSD has completed a 3-swing pullback against the June low and entered the extreme buy zone at $0.72–$0.64. While marginal new lows are still possible, this area aligns with Fibonacci confluence, making it a prime zone for a bullish reversal or at least a 3-wave bounce next week.
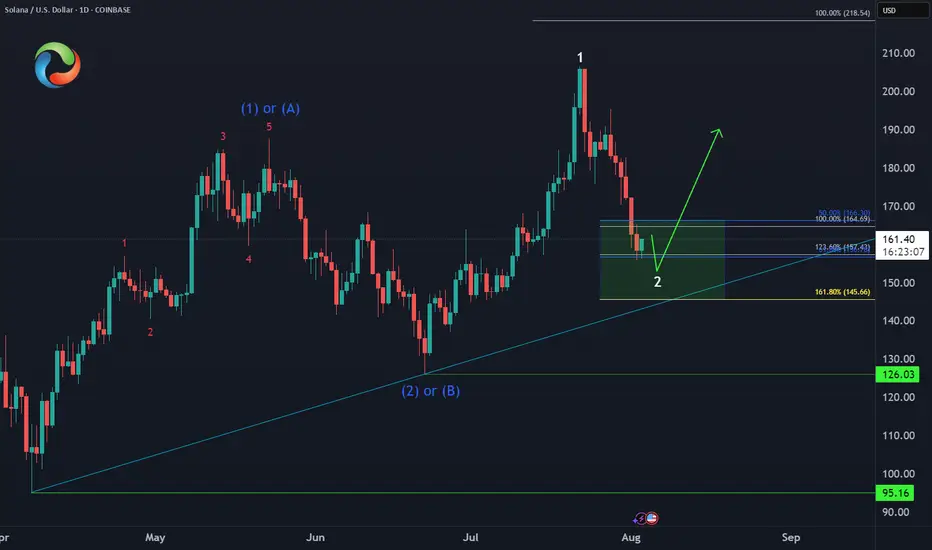
Solana SOL Extreme LevelsCRYPTO:SOLUSD Extreme Levels
50% - 61.8% Fib Ret ($166 - $156) ✅
Equal Legs area ( $164 - $145) ✅
Next Higher Target = $218 🎯
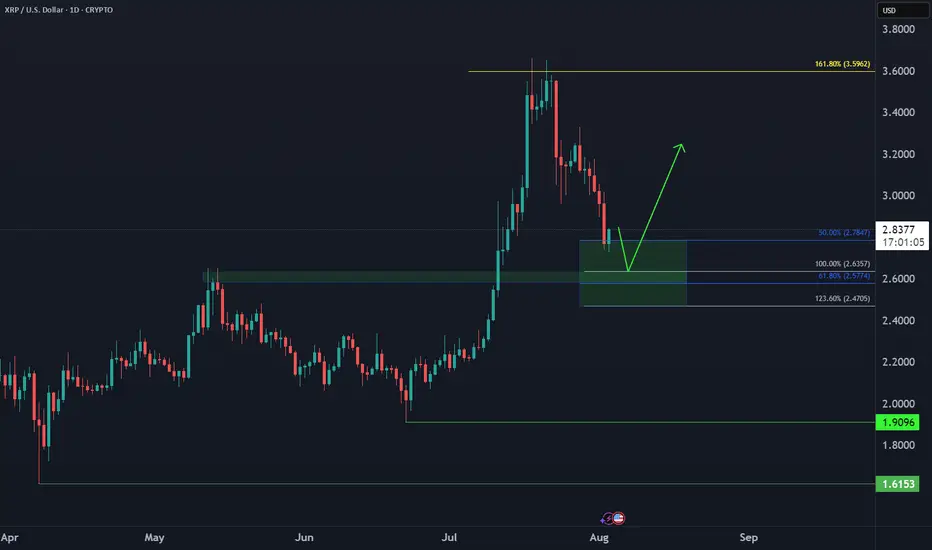
Ripple XRP Bullish Reversal📈 CRYPTO:XRPUSD dropped in 3 swings vs June low, now in buy zone $2.78–$2.47. Marginal lows still possible, but bounce expected next week from this extreme area.
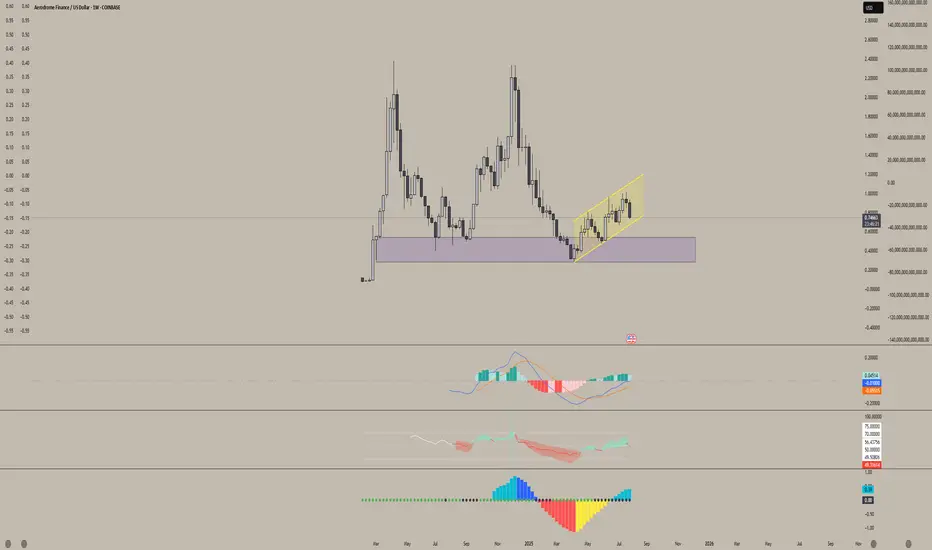
Aerodrome Finance (AERO)Aerodrome (AERO) is showing strong signs of accumulation.
We've been trading within this parallel channel for nearly three months, and it's repeatedly respected both the upper and lower bounds. As we approach the bottom of this range again, it looks like an ideal accumulation zone for long-term holders.
I'm very bullish on this project. Aerodrome is the leading DEX on Base — Coinbase’s Layer 2 network — and with no native Base token currently, AERO is in a prime position to claim that top spot. There's a vacant throne on Base, and AERO is well-positioned to sit on it.
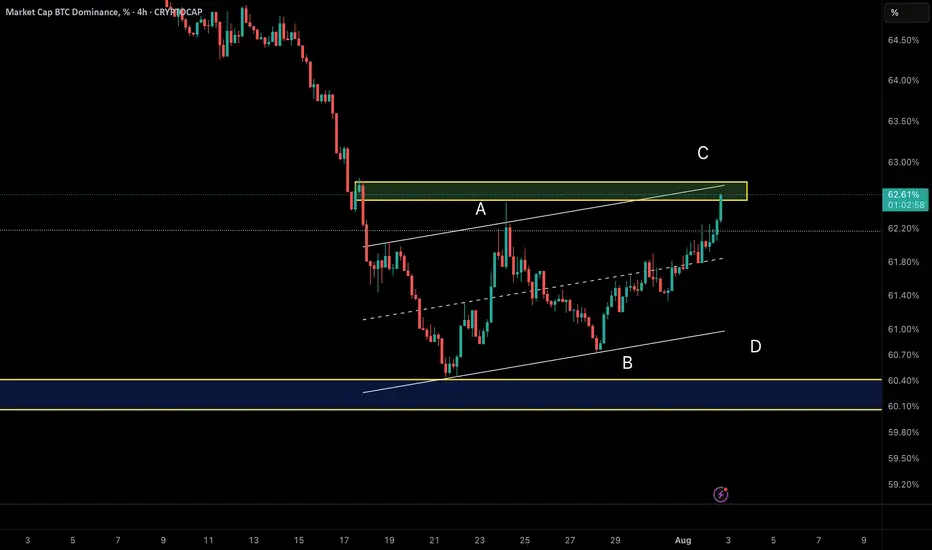
Smart Money Watching BTC Dominance – Rotation to Alts IncomingAfter a deep correction, BTC Dominance has entered a corrective upward phase inside an ascending channel.
Wave A rallied from 60.5% to 62.3%, followed by Wave B retracing to 60.74%.
Currently, Wave C is developing and has reached around 62.2%.
The key resistance sits near 62.7%, exactly at the upper trendline of the channel. This could act as a reversal point, potentially ending Wave C and triggering a bearish move.
💡 Implication:
If dominance drops from this zone, we could see capital rotation into altcoins, supporting a bounce across the broader altcoin market.
Bitcoin Enters Correction Mode?Bitcoin is already trading at support in the form of the previous all-time high and EMA55. Bitcoin is down more than 8% since its 14-July all-time high. We can see that a correction is already in, a retrace. This retrace we consider part of the normal workings of the market, price fluctuations which invariably always show up. The end result is a higher high, a rising wave, higher prices on the long haul.
Support is strong at current prices but even stronger is the support zone right above $100,000. As long as Bitcoin trades above $100,000, we will continue with a strong bullish outlook. If Bitcoin manages to move and close below $100,000 monthly or weekly, we will consider the short-term, the mid-term and update our map if necessary. For now, the bulls are still in control.
When Bitcoin peaked 22-May it went sideways for an entire month. From a peak of $112,000 it hit a low of $100,000. Now we have a peak around $123,000 and prices can easily swing around in this wide range.
After a few weeks, or several months, exactly as it happened last time, Bitcoin will go up. So you can expect retraces and corrections, but this is only short-term long-term we grow.
Namaste.

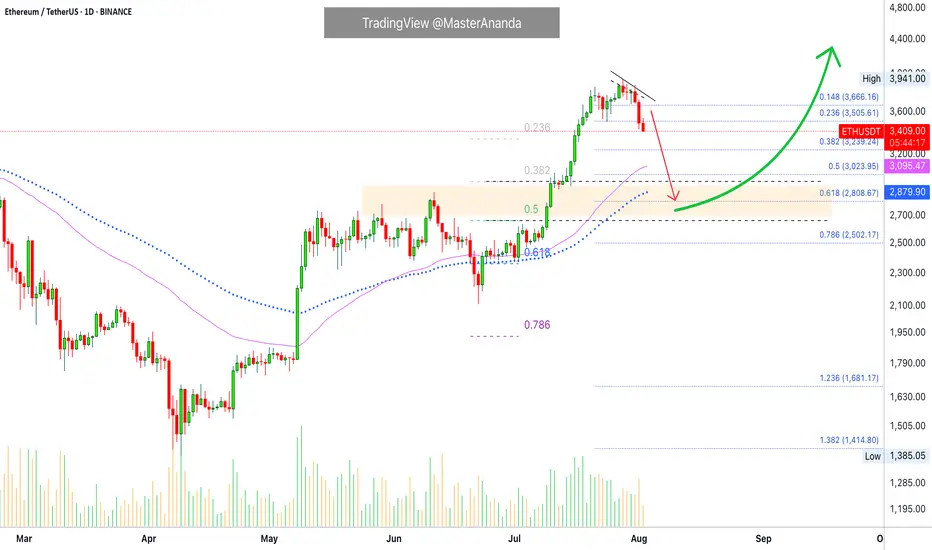
Ethereum Market Flush, Retrace & Support ZoneEthereum is now on its third consecutive red day and bearish action is fully confirmed. The market is preparing for a strong drop.
As I've been mentioning, this move looked up from a broader perspective is part of a small correction for the last major advance. Ethereum moved up from $2,500 to almost $4,000. Now we get a retrace that ends in a higher low followed by additional growth.
The retrace is now confirmed as Ether needs to test EMA55 and EMA89 as support. If these levels hold, you can count on a reversal right away. If these levels are compromised strongly, then prices can linger lower before a recovery shows up. It should be fast and strong. It should all happen within a few days, the crash and bottom, and the reversal a long-term process; sustained long-term growth, the market will be removing some of the weak hands.
We are going to be experiencing a bull run, are you sure you want to stay?
Protect your positions at all cost. We've seen nothing yet. $8,000 or more by the end of the bull run phase.
Namaste.