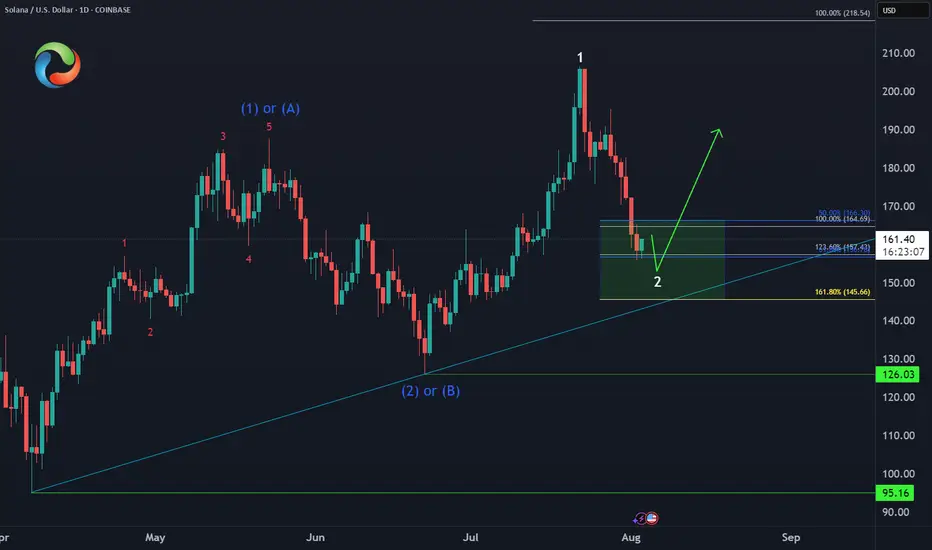
Solana SOL Extreme LevelsCRYPTO:SOLUSD Extreme Levels
50% - 61.8% Fib Ret ($166 - $156) ✅
Equal Legs area ( $164 - $145) ✅
Next Higher Target = $218 🎯
Altcoins
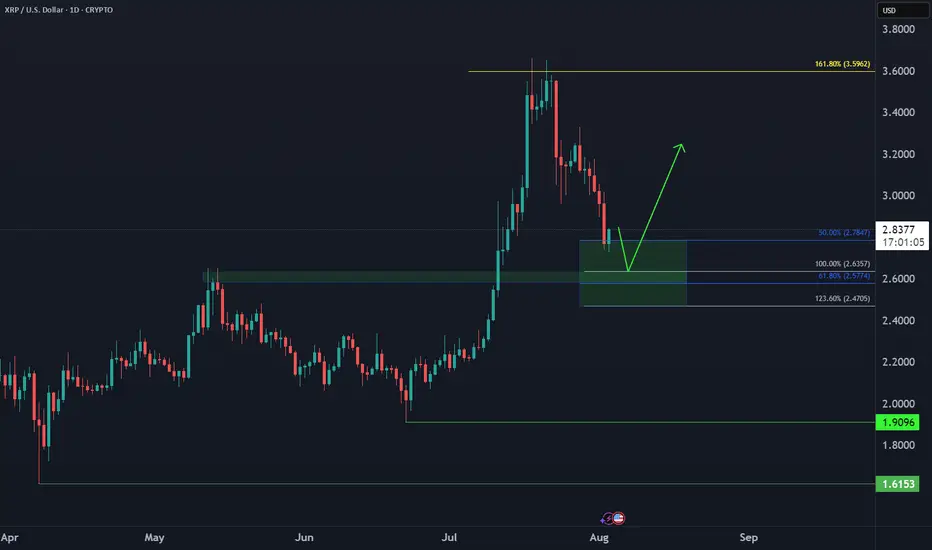
Ripple XRP Bullish Reversal📈 CRYPTO:XRPUSD dropped in 3 swings vs June low, now in buy zone $2.78–$2.47. Marginal lows still possible, but bounce expected next week from this extreme area.
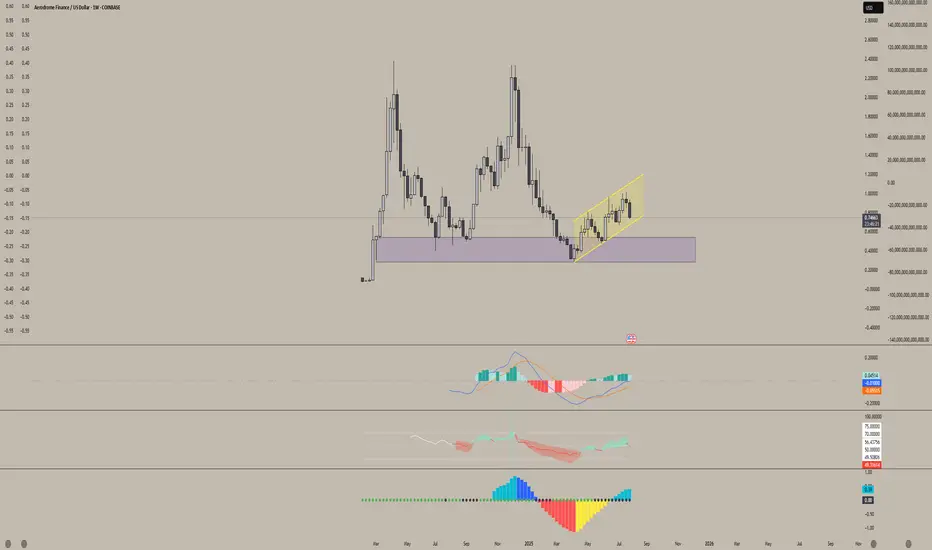
Aerodrome Finance (AERO)Aerodrome (AERO) is showing strong signs of accumulation.
We've been trading within this parallel channel for nearly three months, and it's repeatedly respected both the upper and lower bounds. As we approach the bottom of this range again, it looks like an ideal accumulation zone for long-term holders.
I'm very bullish on this project. Aerodrome is the leading DEX on Base — Coinbase’s Layer 2 network — and with no native Base token currently, AERO is in a prime position to claim that top spot. There's a vacant throne on Base, and AERO is well-positioned to sit on it.
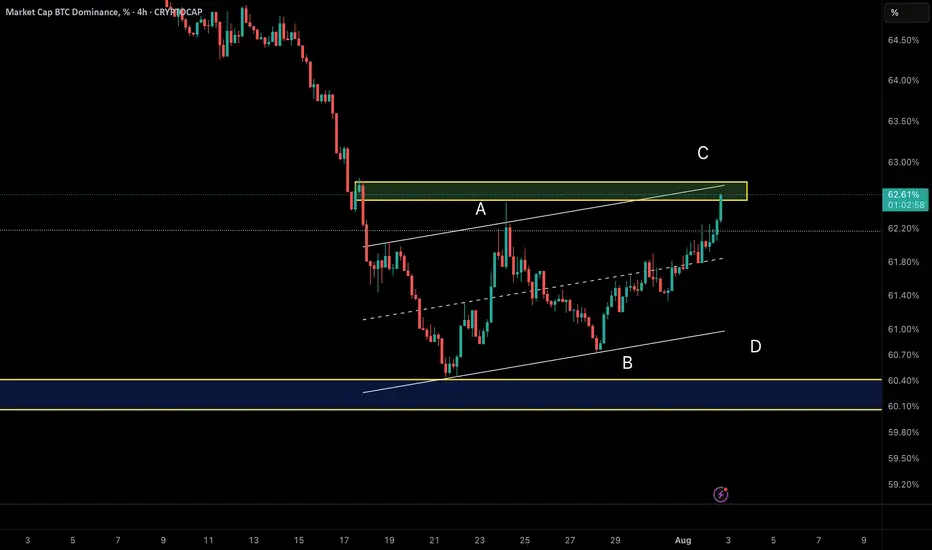
Smart Money Watching BTC Dominance – Rotation to Alts IncomingAfter a deep correction, BTC Dominance has entered a corrective upward phase inside an ascending channel.
Wave A rallied from 60.5% to 62.3%, followed by Wave B retracing to 60.74%.
Currently, Wave C is developing and has reached around 62.2%.
The key resistance sits near 62.7%, exactly at the upper trendline of the channel. This could act as a reversal point, potentially ending Wave C and triggering a bearish move.
💡 Implication:
If dominance drops from this zone, we could see capital rotation into altcoins, supporting a bounce across the broader altcoin market.
Bitcoin Enters Correction Mode?Bitcoin is already trading at support in the form of the previous all-time high and EMA55. Bitcoin is down more than 8% since its 14-July all-time high. We can see that a correction is already in, a retrace. This retrace we consider part of the normal workings of the market, price fluctuations which invariably always show up. The end result is a higher high, a rising wave, higher prices on the long haul.
Support is strong at current prices but even stronger is the support zone right above $100,000. As long as Bitcoin trades above $100,000, we will continue with a strong bullish outlook. If Bitcoin manages to move and close below $100,000 monthly or weekly, we will consider the short-term, the mid-term and update our map if necessary. For now, the bulls are still in control.
When Bitcoin peaked 22-May it went sideways for an entire month. From a peak of $112,000 it hit a low of $100,000. Now we have a peak around $123,000 and prices can easily swing around in this wide range.
After a few weeks, or several months, exactly as it happened last time, Bitcoin will go up. So you can expect retraces and corrections, but this is only short-term long-term we grow.
Namaste.

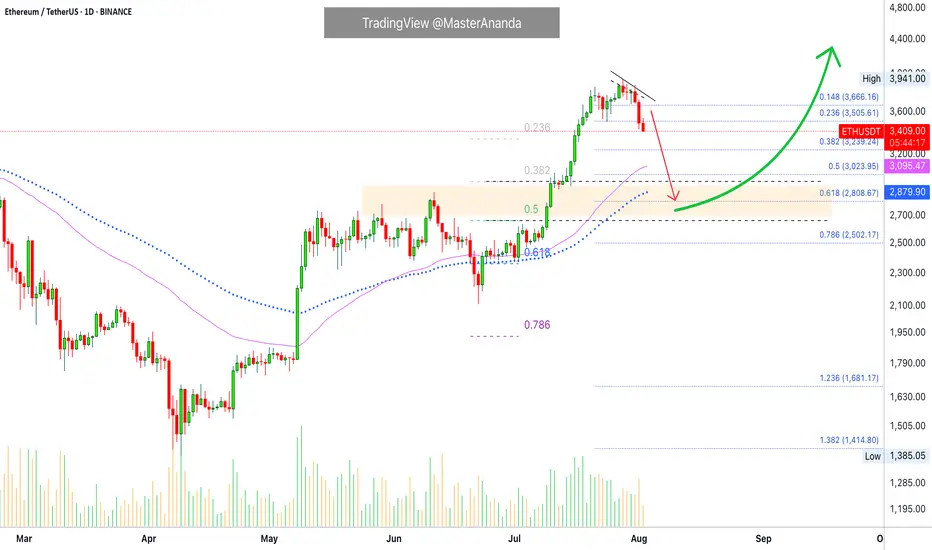
Ethereum Market Flush, Retrace & Support ZoneEthereum is now on its third consecutive red day and bearish action is fully confirmed. The market is preparing for a strong drop.
As I've been mentioning, this move looked up from a broader perspective is part of a small correction for the last major advance. Ethereum moved up from $2,500 to almost $4,000. Now we get a retrace that ends in a higher low followed by additional growth.
The retrace is now confirmed as Ether needs to test EMA55 and EMA89 as support. If these levels hold, you can count on a reversal right away. If these levels are compromised strongly, then prices can linger lower before a recovery shows up. It should be fast and strong. It should all happen within a few days, the crash and bottom, and the reversal a long-term process; sustained long-term growth, the market will be removing some of the weak hands.
We are going to be experiencing a bull run, are you sure you want to stay?
Protect your positions at all cost. We've seen nothing yet. $8,000 or more by the end of the bull run phase.
Namaste.
THORChain Prepares New Bullish Wave · Trades at Bottom PricesLook at the period between June 2022 and October 2023. This is literally what we call "bottom prices," and this is exactly what we have now.
In this case, RUNEUSDT, the period starts January 2025 until this present day. THORChain is trading at bottom prices. The best time to buy before a major bullish wave.
Look back to October 2023, after a very strong and prolonged sideways period, the market turned extremely bullish, this is the exact same pattern we will have again. After months and months of sideways, the market will recover and turn, producing a new trend, an uptrend.
In late 2020, also around October, there was another consolidation period at bottom prices before a major rise. So this happens all the time. THORChain goes up and then hits bottom. Once at the bottom it lingers there for a while finally to recover and become super bullish. Each bullish period lasts anywhere between 6-12 months. Can be more or less depending on when you start to come but the project has been proven to move wild and big when the bulls are in. Which is what comes next.
Do not be deceived by the low prices or the short-term, everything can change in an instant and you already saw the preview, you already saw what is possible and to this market phase we are getting close. We are getting close to the next bullish wave and this wave will produce marketwide growth. Many more pairs will move compared to previous cycles and the advance will last that much longer.
It is already happening. The low was hit in January, almost 8 months ago. We are about to move higher, the highest prices since 2021.
Namaste.

Cosmos 365 · Proof of Bullish · Bull Market Wave NextCosmos (ATOMUSDT) has been sideways for an entire year now. The current trading range is a long-term support, buy and accumulation zone. This zone is already proven to be a bullish launchpad based on late 2024. The same levels were active in August-October-November 2024 leading to a mild bullish wave. This is only the start.
The same support range is activated again in Febraury-March-April-May-June-July-August 2025 and this will lead to a major bullish wave. Notice that the first period of consolidation lasted only three months and thus we had a mild wave only. With now six full months of consolidation the next bullish wave will be at least twice as big. But the market and how participants act and react doesn't work linearly. A six months consolidation period can lead to a bullish wave that is 3-5 times stronger than the previous one.
What you are seeing right now is actually pretty good. ATOMUSDT is red, yes. Notice weeks of bearish action yet no new lows, no significant challenge of support. More sideways which is as bullish as it gets. We already saw many examples of a downtrend and how the market goes lower and lower always producing new lows. This scenario is far from being what is present on the chart.
ATOM has been dropping for weeks but its price isn't affected that much negatively because this is only a minor retrace. An intermediary pause. The positive side of this type of market behavior is how it tends to unravel. It goes from quiet and shy to fast, surprising and unexpected. The market can change any day.
You can start seeing bullish action tomorrow just as it can start next week or the week above. The retrace has been going long enough and it lacks volume and momentum, sellers are running dry; when momentum dies down, the market turns.
Look at Bitcoin, it isn't dropping anymore. It stopped at the previous high and so far this is a strong support. Even if it moves lower, we continue bullish above $100K long-term. It is normal for a small pause before additional growth. $15 is an easy target, ATOM can grow much more in the coming months. Late 2025-early 2026 are the best dates for higher prices. Buy now and hold.
Namaste.

PEPE Will Turn Bullish · Strong Chart StructureThe market is one. We are all one and the same.
Crypto is one, and all the pairs move in the same way. Not in the exact same manner but the broader direction always tend to be the same.
PEPE is great because it reveals that the market isn't likely to go much lower. Since they all move together, the fact that PEPE will recover reveals that the others will recover.
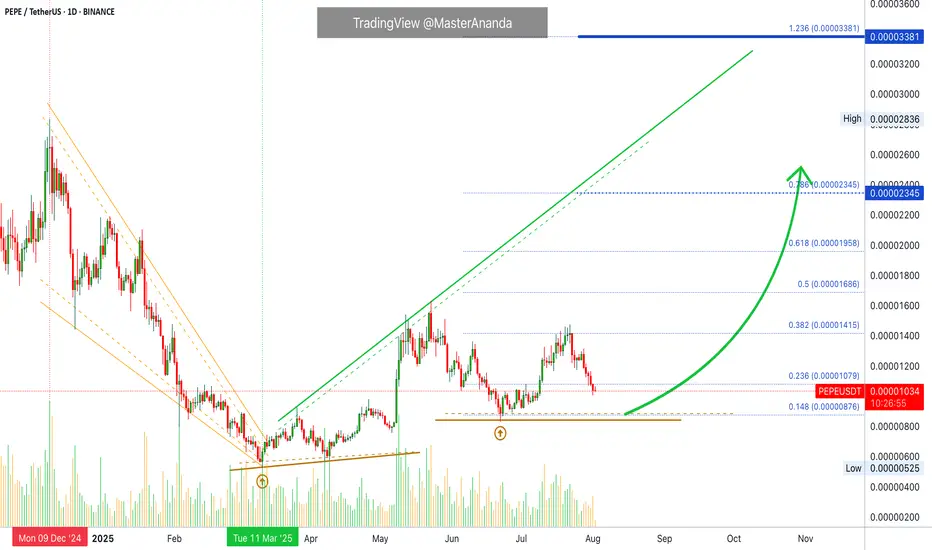
PEPE grew in late 2024 together with the rest of the market. The first part of 2025 was a correction and the lows started to come-in in March and April. The first high in May, exactly the same as the rest of the market. A higher low in June and another high in July. Now a new retrace.
PEPEUSDT is trading on a very strong structure. We have a higher low from June but also from March. This makes it very unlikely that PEPE will produce a new low in this correction, which means that even now the correction is reaching its end. Volume is very low. If it isn't over then one major flash crash and the next day full green. That's how close we are from change.
Technical analysis
The market downtrend ended in March this year. From a low point PEPEUSDT switched from bearish to bullish. The trading is now happening within a bullish chart.
The main move peaked in May and the market is consolidating before additional growth. The action stays kind of sideways, mid-range, which shows that we are seeing consolidation. Consolidation always precedes a wave of growth, specially when the action is happening across marketwide support.
Namaste.
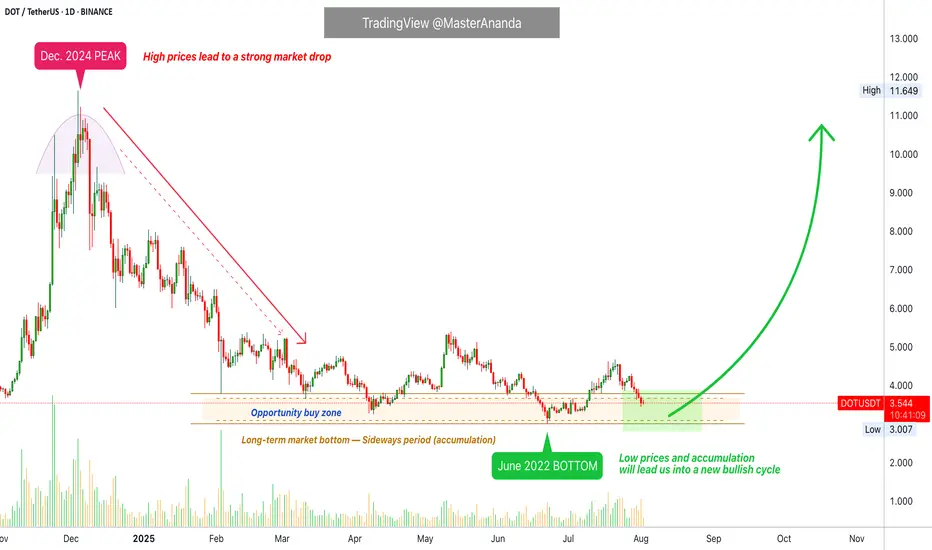
Polkadot · Trading at Bottom Prices · Bullish Scenario ExplainedThe same levels, the same prices, the same support zone. Polkadot is still trading at bottom prices. From the bottom the market tends to grow.
Good morning my fellow Cryptocurrency trader, I hope you are having a wonderful day. Notice the brown lines on the chart. We have the 7-April low, the June 22 low and also the low in March and yesterday, 1 August. This is a bottom range and this is the buy zone.
Polkadot (DOTUSDT) has been trading near this range since February 2025, six months ago. This is a very long—and strong—consolidation period. This much accumulation is surely the preparation for a major market change, a change of trend. A new uptrend. An event that has not happened since 2021.
I think the most important part is to truly understand that a bullish wave develops only from low prices. Notice the peak from December 2024. As soon as prices are high, the market seeks balance and starts to decline. But, when prices are low, an accumulation period develops and afterward a wave of growth. That is what I see happening right now across the market and with this chart. It already happened to hundreds of projects, literally. They all had the same chart.
These projects grew in late 2024, November-December. Then they went into correction in early 2025 until recently. The current low as witnessed on DOTUSDT led to massive growth. Some of these pairs are trading at new all-time highs while others have grown 500% or more. Those trading at the bottom are still early and next in line to move when the market does.
We will be bullish within days, as soon as Bitcoin ends its retrace. I shared in another publication why I believe Bitcoin will recover in the coming days.
Thank you for reading.
Namaste.
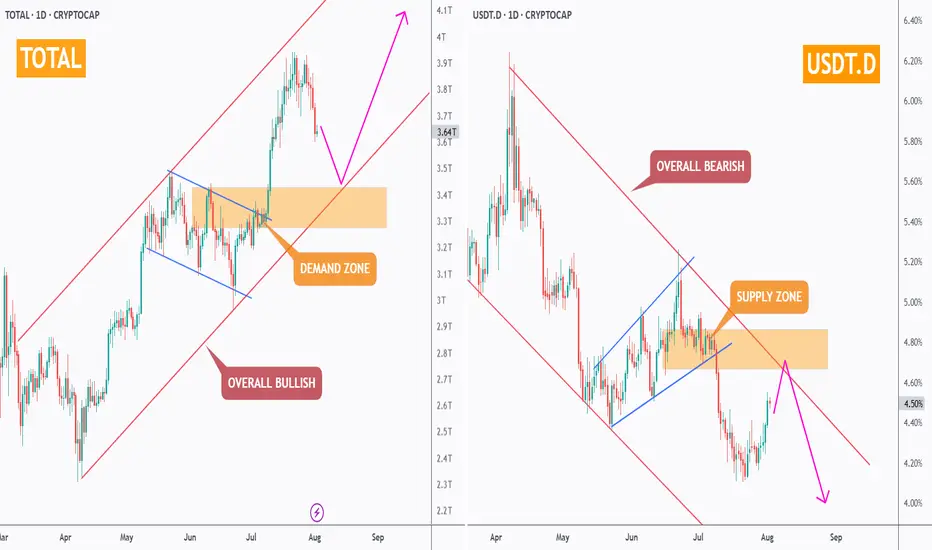
Don’t Panic — It’s Just a Healthy Crypto Correction!While the crypto market has seen some red this week, the bigger picture remains intact. Let’s zoom out and make sense of the current correction.
🔸 TOTAL Market Cap (left chart)
The structure remains overall bullish, trading inside the red rising channel.
After a solid rally, the market is currently pulling back toward a strong demand zone – perfectly aligned with the lower trendline. This area is likely to act as a major support, from which the next bullish impulse could kick off.
🔸 USDT Dominance (right chart)
USDT.D remains overall bearish, trading inside the red falling channel.
It’s currently pushing higher toward a well-defined supply zone, which also intersects with the upper red trendline. As long as this area holds, we expect sellers to take over again — giving altcoins the space they need to bounce back.
📌 In simple terms:
The market is in a healthy correction. Don’t let short-term dips shake your long-term view. The trend is still your friend.
➡️ As always, speak with your financial advisor and do your own research before making any investment decisions.
📚 Always follow your trading plan => including entry, risk management, and trade execution.
Good luck!
All strategies are good, if managed properly.
~ Richard Nasr
AAVE Daily Chart – Key Buy Zone & Two ScenariosAAVE is currently moving within a well-defined ascending channel on the daily timeframe. The last major bullish leg began from the $120 support and surged nearly +180% to a local high near $330.
Now, after a 25% pullback, price is consolidating around the midline of the channel near $250. More importantly, there’s a strong bullish order block sitting between $220–230, making this a low-risk buy zone with a stop below the order block.
🔸 Scenario 1 (bullish preferred):
Price dips into the $220 OB zone, completes a possible ABC correction, and launches a new bullish leg targeting the channel top above $500.
🔸 Scenario 2 (bearish alternate):
If the $220 order block fails, deeper correction could follow toward the channel bottom near $135.
⏳ This is a critical area to watch for reaction – Smart Money will likely show its hand soon.
🔗 Analysis by CryptoPilot

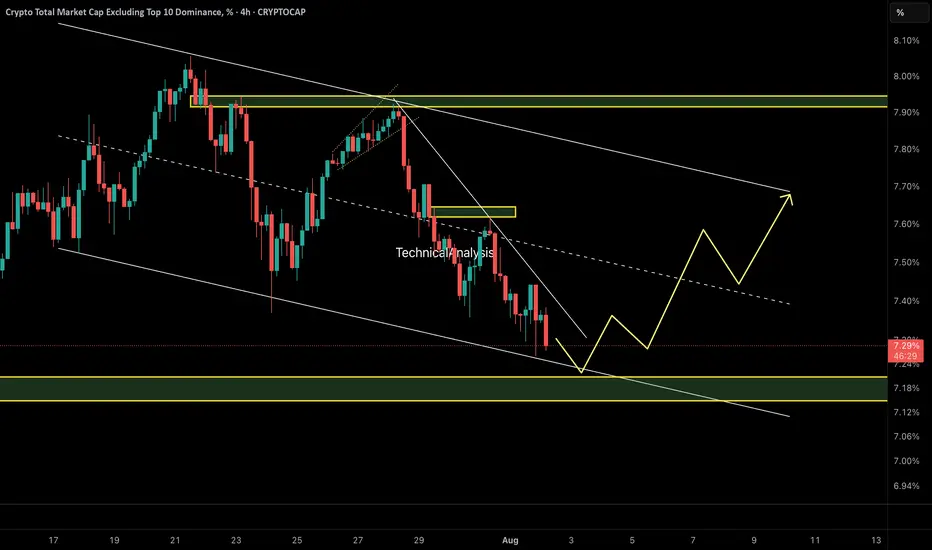
OTHERS.D – Perfect Reaction to Previous AnalysisAs predicted in the last update, OTHERS.D broke structure and dropped sharply toward the 7.20% demand zone — exactly as expected.
Now, we’re waiting for a potential bullish reaction from this key area. If demand holds, a move toward the upper channel boundary (~7.70%) could follow.
🧭 Technical Outlook:
• Price tapped into a key demand zone at 7.20%, which aligns with the lower boundary of a descending channel.
• A bullish reaction is forming, suggesting short-term strength in altcoins.
• A move toward the channel top near 7.70% is now on the table if demand holds.
⚠️ Important Note:
This move is likely to remain a corrective rally unless we see a proper breakout above 7.70% with volume and structure shift. Be selective with altcoin longs.
🔍 Watch for:
• Reaction at 7.50% midline
• Price behavior at 7.70% resistance
• Structure shift or failure pattern near channel top
⚠️ Caution: This remains a corrective rally unless price breaks 7.70% with structure shift.
🔗 Analysis by CryptoPilot
TON/USDT – Daily Price Action Analysis🔹 Price has broken a major descending trendline and entered an ascending channel.
🔹 Currently testing the mid-range resistance zone around $3.60 – $3.70.
🔹 If buyers hold above this area, the next targets could be $4.40 – $4.80.
🔹 If rejected, key supports are at $3.20 and $2.90.

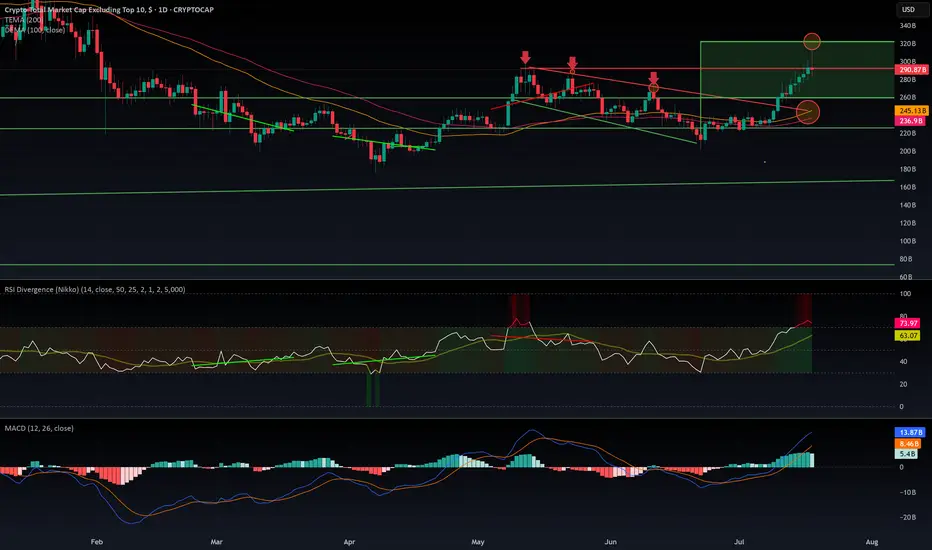
$OTHERS rejected from $320 B resistance. What is next?CRYPTOCAP:OTHERS Rejected at $320B: Is the Altseason on Pause?
CRYPTOCAP:OTHERS just got rejected at the $320B resistance after a decent pump — the kind that usually signals the start of an altseason. But if we dig into the indicators, warning signs are flashing:
- MACD is sitting in overbought territory.
- RSI is heavily extended, signaling potential exhaustion.
- EMA 100 & 200 are colliding with the top of a previous downtrend channel — a zone that historically acted as strong resistance.
The rejection was sharp. So what's next? Are we entering a range between $320B and $260B? It's quite possible. The aIf you wantltcoin market now sits at a decision point: either it keeps pushing higher or takes a breather — potentially pausing the rally until September.
Historically, August is a slow month in the West. People go on vacation, volumes drop, and markets tend to cool off. This seasonal pattern supports the idea of a consolidation phase before a stronger second leg of altseason kicks off in mid-September and carries into Q4.
I’m not posting too many ideas lately because the market landscape has changed. The new players aren’t just trading — they’re manipulating flows with massive capital to hunt retail liquidity.
They’re also using far more sophisticated tools than our classic MACD and RSI — including AI-powered indicators and multi-layered analytics that are beyond retail reach.
In this new environment, predictions are harder and risk is higher.
🧠 Do Your Own Research (DYOR), stay sharp, and don’t blindly trust social influencers.
ChainLink · Short-Term Correction (Retrace) · 2025 Bull MarketWe have evidence that ChainLink won't be moving much lower. There are mainly two reasons: 1) There aren't that many sellers and 2) we have strong support. We have an active support range between $14.5 and $15.95. This is the reversal point. Either current prices or this lower range which shows an intersection between two strong moving averages as well as Fib. retracement levels.
The rise between June and July has a stronger slope compared to the one before. The April-May rise was more spread out and so the correction lasts longer. The present one has a stronger slope, it is more steep, and thus a retrace will have a shorter duration because prices will continue growing.
Volume is extremely low on the drop and bearish momentum is not present. There can be one final flush reaching the levels mentioned above or lower on a wick and the market turns. The flush would make everything seen pretty bad and red but the truth is that this would be the end. When the major sell is in, the market turns around and moves the other way.
LINKUSDT is retracing within a bullish bias mid-term. Long-term growth is possible based on the bigger picture.
LINKUSDT is facing an intersection of multiple support zones, if these levels hold, we can see a resumption of the bullish move and prices grow. Each time a retrace is over, the bullish wave that follows will be many times stronger than the previous one until the bull market ends.
We are still looking at bottom prices. The best is yet to come.
Namaste.

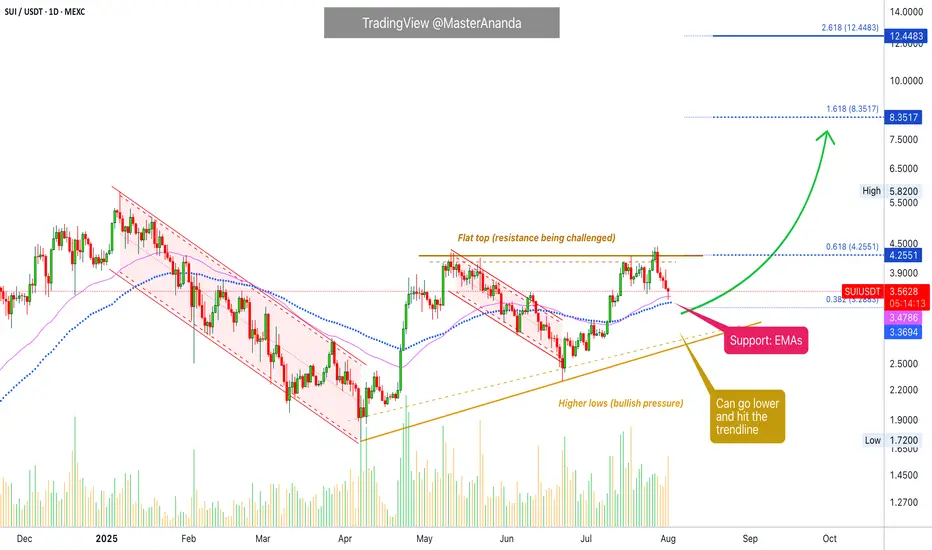
Sui Update · Support Found, Moving AveragesWe will focus solely on the chart. As a move happens, there are always fluctuations, down and up. What determines the trend is not the short-term but the broader market move. When a pair is producing higher highs and higher lows, we are growing and going up. If there is a drop short-term, this is nothing more than a retrace because prices (profits) are rising mid- and long-term. This is the current situation and has been true for many months.
Each time Sui retraces, it finds support and then continues to grow.
SUIUSDT peaked 28-July, now five days ago. A classic retrace because after this date all days are red. Facing resistance led to immediately to a test of support. A test of support tends to lead to a new challenge of resistance.
SUIUSDT is working support at EMA89 and EMA55 daily, the same levels we had active on the last update. These levels seen to be holding strong so far and if they hold, we can see growth right away. Normally, support tends to be pierced briefly and then the market turns. So anything goes.
We can see a reversal happen now, or it can take a few days at most. The action is already happening at support and within a higher low. It can move a bit lower, but we are getting ready for the next bullish jump. This one will be a surprise and it will bring the entire market up. No excuses, no reason, just up.
Namaste.
Solana Update · Retrace, Bears & The Bullish BiasSolana had a retrace in May. Notice the 19-May date on the chart. This retrace produced four weeks red. The bullish move that led to this retrace lasted 6 weeks. The last rise lasted five weeks and the current retrace might last only two weeks, can be less.
We are seeing Solana rising but this rise is not a one-time off event, this is a trend that is developing. An uptrend as a long-term phenomena is different to a short-term bullish moves. A short-term move tends to be really fast, one strong burst and that's it. A long-term move is different. Instead of seeing 2-3 candles and Solana trading at $1,000, we see dozens and dozens of candles with prices slowly rising. There are strong fluctuations but the end result is always up. And that's how you see the fluctuations on the chart.
Solana moved up and then immediately started to retrace. Then another rise and another retrace again. This retrace will end and prices will continue to grow long-term. The bulls are in. The bull market is on. Solana, Bitcoin, Crypto and the rest of the Altcoins market is going up.
Namaste.

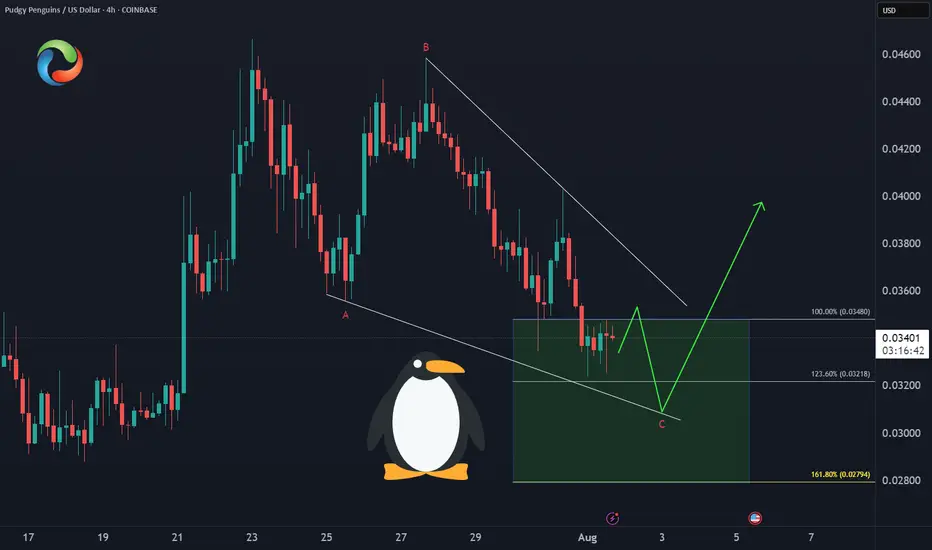
PENGU Enters Demand ZoneCOINBASE:PENGUUSD 🐧Price has developed a clean A-B-C correction into the equal legs support zone at $0.034-$0.028, offering:
✅ Optimal risk/reward entry
✅ Wave structure confirmation
✅ Higher low potential
This is the technical sweet spot for the next rally leg.
The next levels for Solana coinIn this video I recap the previous video and discuss what may be next after the current retracement .
I reveal some important levels that sit below as well as the relationship with the Eth/Btc chart.
Tools used vwap, Fibs and volume profile .

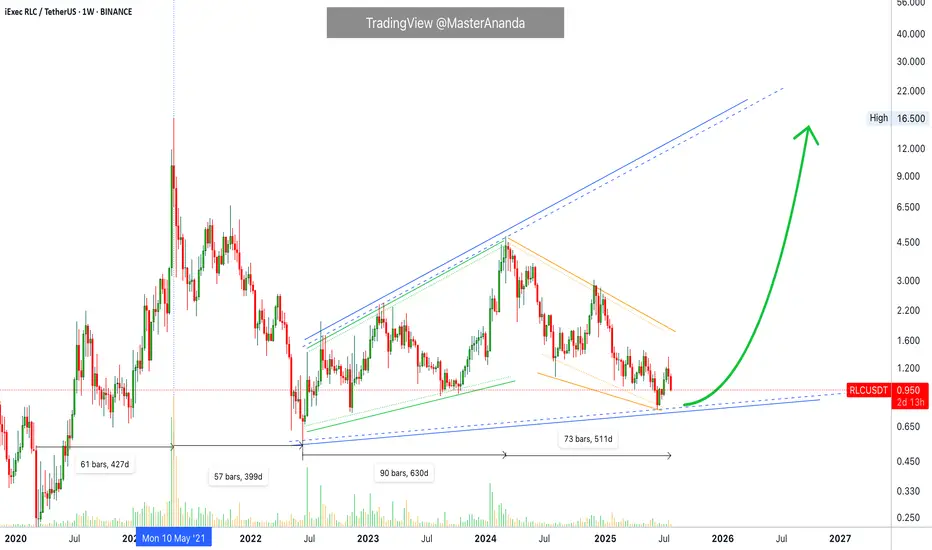
iExec RLC · Trading at Bottom with a Bullish BiasiExec RLC (RLCUSDT) is still trading at bottom prices but the overall market conditions are good. Good for the future because the market moves in waves alternating always between rising and falling.
RLCUSDT went bearish between May 2021 and June 2022, 399 days. Then it went bullish from June 2022 to March 2024, 630 days. Then it went bearish again between March 2024 and present day, August 2025. More than 510 days.
While RLCUSDT has been bearish more than a year, the action is still happening as a long-term higher low. That is, prices today and at the lowest—16-June 2025—are still higher compared to the low in June 2022.
Of course before being bearish in 2022 the market was bullish between March 2020 and May 2021, 427 days. Here we can clearly see the fluctuations between bear and bull, uptrends and downtrends.
The last uptrend came in 2021 and we are due a new one. Crypto grows every four years and market conditions are perfect for the next run. The market has been mixed, sideways and neutral for years on end, the long-term higher low is a single of strength. After the current retrace is over, you can prepare for a major bullish wave.
Namaste.
JUSDT Short-Term Retrace vs Long-Term UptrendJST is not trading at bottom prices because the low was hit November 2022, but the bigger picture still looks like a long-term consolidation pattern. Sideways for years, this precedes a major bull market.
Good morning my fellow Cryptocurrency trader, I hope you are having a wonderful day.
JSTUSDT is looking weak short-term but we know this to be part of the same process, the one that has been going on for years. Higher lows and higher highs but still no major bullish wave, it is getting closer though because the market can only consolidate for so long.
JST has been rising. The high December last year (2024) hit the highest prices since March 2022, the month when the previous bear market breakdown took place.
The red period is the bear market. Notice how it ends when the downtrend is no more and the market turns blue, sideways. After this period comes green and this is where we are now.
Within the bullish period we also have retraces and corrections. Right now we have a bearish move, short-term, within a wider bullish move, an uptrend long-term. This is the normal and classic market fluctuations; prices moving down and up, up and down, back and forth, every day.
The end of the short-term move will result in the continuation of the bigger move, the uptrend. We should expect a higher low followed by a strong higher high next. The next higher high comes in late 2025, now.
Thank you for reading.
Namaste.

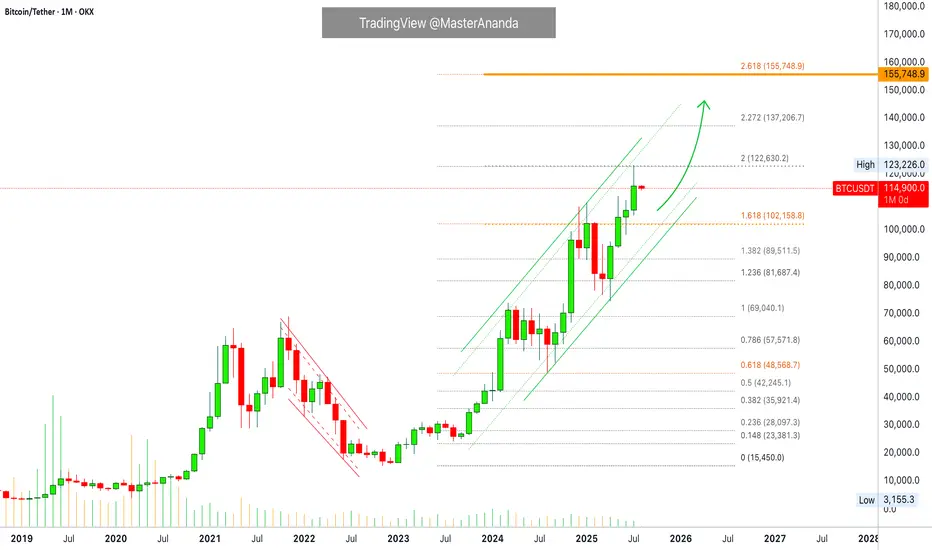
Bitcoin Monthly · Parabolic Rise ContinuesLast month Bitcoin produced its best numbers ever. The highest wick and close, a new all-time high at $123,226.
Bitcoin is not exhausted on the monthly timeframe but there is room for a retrace before the month ends. Think of the first part of the month being mixed, neutral or even bearish while the second half becomes full time bullish.
The levels that are relevant are $122,000 on the bullish side and $102,000 on the low. Right now the action is happening close to the middle so anything goes.
In 2020 Bitcoin produced 7 monthly candles growing and this was repeated again in 2023. In 2025 we have so far four green candles which means that Bitcoin can easily continue to grow. It has been known to produce more than four months green many times but there can be exhaustion at some point.
Bitcoin has been moving within a strong uptrend and is likely to continue rising. Bullish until the chart says otherwise. We are going up. Short-, mid- and long-term.
As Bitcoin consolidates near resistance, the altcoins will continue to build strength in order to grow. Remember, we are still looking at bottom prices across thousands of altcoins. Only a few moved ahead and are trading at all-time highs, the rest will catch up. The time is now, late 2025. The best is yet to come.
Namaste.