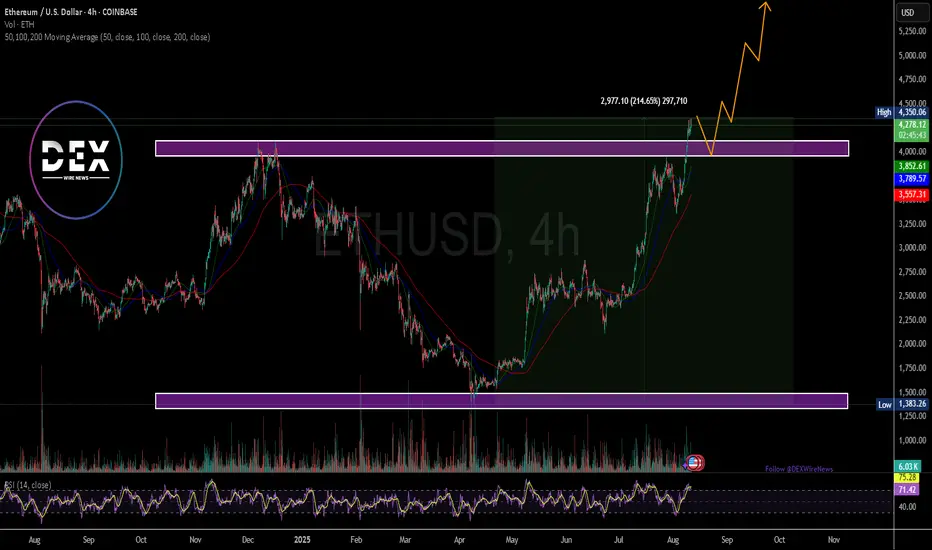
Breaking: Ethereum Is Set To Reclaim the $5k Price Pivot The price of the notable Altcoin- Ethereum ( CRYPTOCAP:ETH ) is set to reclaim the $5k resistance amidst growing interest and buying momentum.
For the past 3 months Ethereum ( CRYPTOCAP:ETH ) spiked 200+% breaking out from a cup and handle pattern amidst growing interest ikn the Ethereum chain.
Crypto Pundits on X, LinkedIn and Discord envisage the influx of memecoins on the Ethereum ( CRYPTOCAP:ETH ) chain- while most skeptics think the layer 1 blockchain is dead, Ethereum's sojourn to the $5k pivot is just days away as popular folks like Eric Trump the son of the present president of USA hints on investor's to buy Ethereum's dip.
As of the time of writing, CRYPTOCAP:ETH is up 0.58% already breaking the $4k resistance trading at $4276. With the Relative strength Index (RSI) at 71, CRYPTOCAP:ETH is on the verge of reaching overbought region. CRYPTOCAP:ETH might experience a respite before picking momentum up.
Altcoinseason
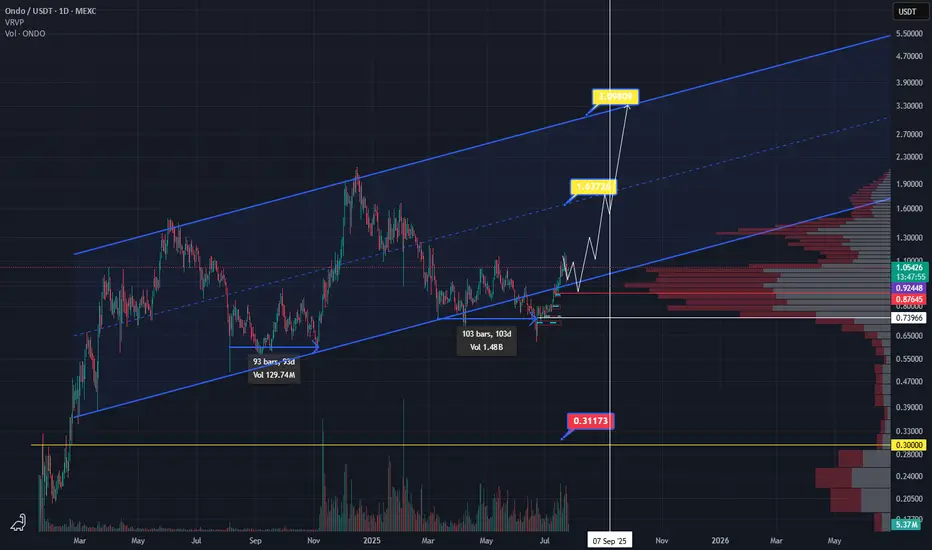
ONDO Bullish structureOndo is back to bullish scenario. We can see long accumulation more then 100 days. As you can see price 0.9 is back and then bullish coming. So 0.85 and 0.9 have to hold and we can buy the dip.
Keep in mind if Ethereum start to attack ATH, Eth ecosystem will grow much higher. So watch this level in next couple weeks and months.
When Altseason? Clues in other chart Ex) #1Hi guys.
So Its no secret bitcoin has been ripping.
We are at new all time highs, and in full on price discovery mode.
I recently posted an ongoing macro analysis on ADA (Cardano) supporting my theory that it is one of the better alts to be investing in for alt explosion.
I want to look elsewhere to see if i can find supporting evidence that its time to invest or trade altcoins.
One chart that can be used is the Total Market Cap of Crypto excluding Bitcoin.
This chart showcases total altcoin market capitalization and its movements.
I believe certain Technical developments can really help us gauge at whats to come.
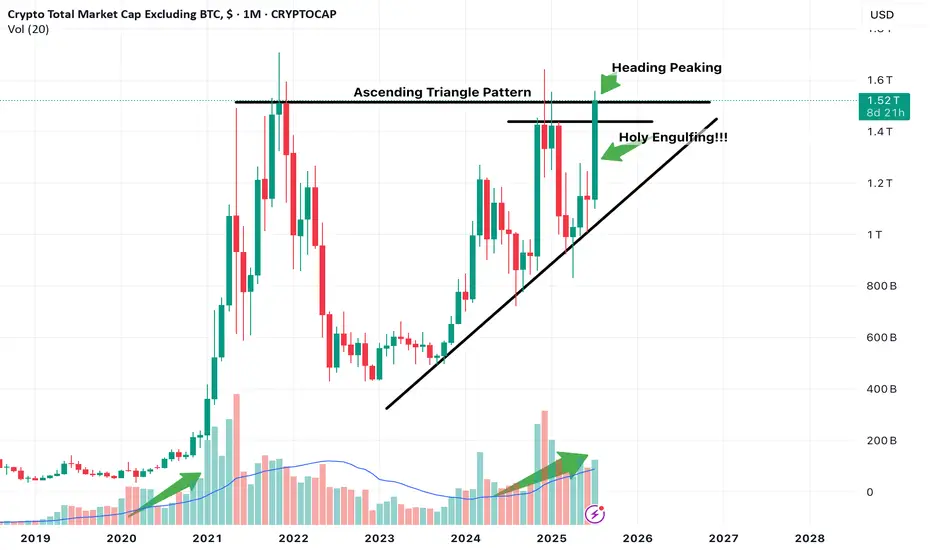
NOte this is on the 1 Month timeframe aka looking into Macro developments.
Just focusing on Candlestick action.
Notice we have been in this ascending channel trend, along with a potential Ascending triangle pattern development which if breakout occurs with confirmation can push Altcoin market cap higher indicating that liquidity is entering altcoins which indicates potential Uptrend.
The month of July so far is in position to print a massive engulfing Bullish candle, which is a great sign.
The upper part is also peaking its head above the Horizontal resistance line. Need to observe confirmation of this breakout. Look for it in smaller timeframes, ill look for it in the 3 day or 5 day.
We are also in position to print a higher high first time in a while.
Notice also Volume. We are seeing currently similar increasing volume as previous alt coin market cap expansion.
Keep an eye out on more posts to add to evidence that supports we are in the verge of potential altcoin season.
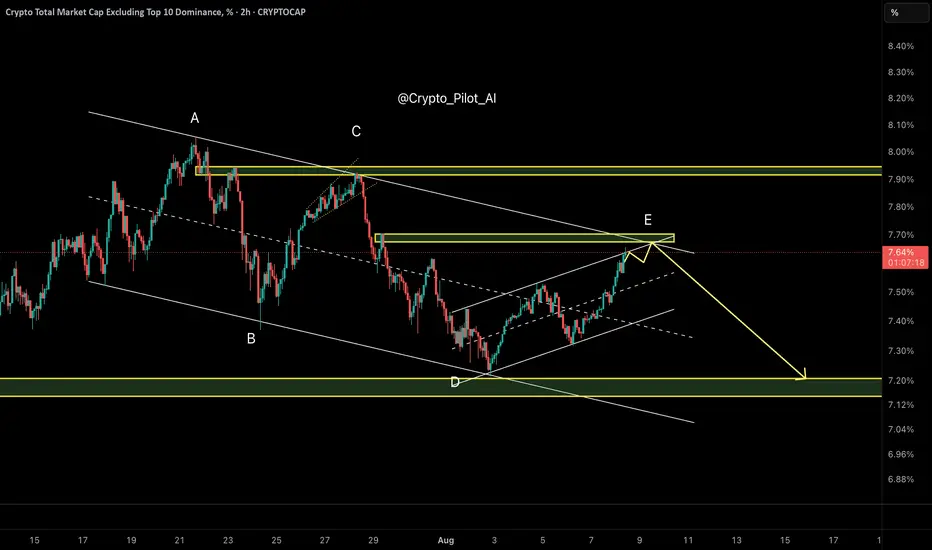
Is It Time for Altcoins to Dump? – OTHERS Dominance Final Wave As predicted in the last update, OTHERS.D reached the 7.20% demand zone precisely, showing a textbook reaction. The price has now rallied back toward the upper boundary of the descending channel and is testing the resistance area near 7.70%, where wave E likely completes within a Diametric structure (ABCDE).
This is a critical juncture: if rejected here, the next bearish wave could trigger an altcoin sell-off.
⸻
🔸 Market Structure:
• Diametric correction (ABCDE), with wave E likely terminating near 7.70%
• Price is testing the confluence of channel resistance and prior supply
🔸 Key Observations:
• Clear rejection signals are emerging around 7.70%
• No evidence of a sustained breakout yet
• Structure typically resolves with a deeper decline (wave F)
⸻
🔹 Scenario:
Base Case:
• Rejection from 7.70% supply
• Bearish continuation toward 7.20% demand
• Potential sweep down to 7.10–7.00% liquidity zone
Invalidation:
• Sustained breakout and acceptance above 7.80%
⸻
📌 Summary:
OTHERS.D is likely finalizing wave E. If this resistance holds, expect a bearish wave F and possible pressure on altcoins. Be cautious with heavy altcoin exposure until a confirmed breakout appears.
⸻
✅ Investment Strategy Selection:
Since declining OTHERS dominance = bearish for altcoins, you’d mark SHORT bias (expecting altcoin underperformance)
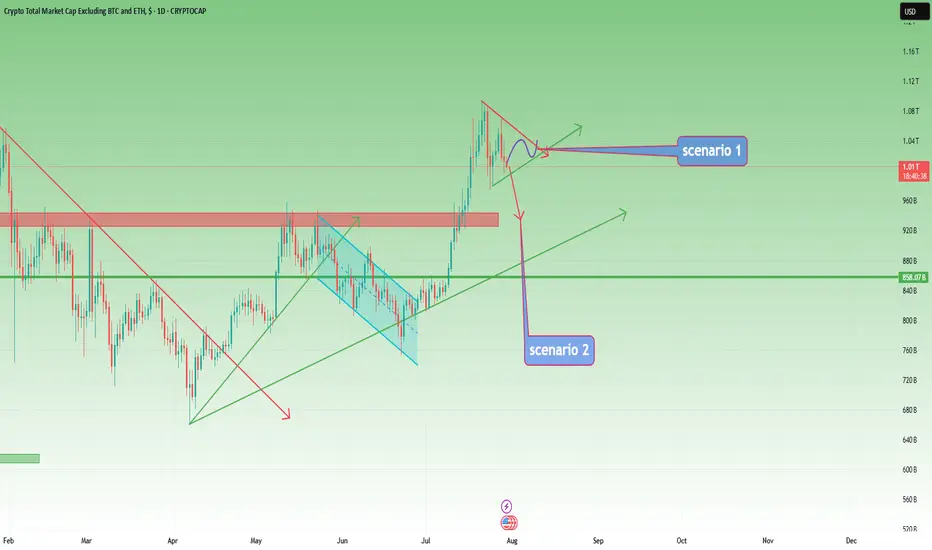
Altcoins Recovering: TOTAL3 Bounces from Key Support ZoneIn my previous analysis on TOTAL3, I mentioned that I'm working with two possible bullish scenarios for altcoins. It now seems we're firmly in Scenario #2.
📉 The price dropped exactly into the highlighted support zone, then yesterday we saw a clean recovery and reversal starting right from that area — a textbook technical reaction.
📈 At the time of writing, TOTAL3 sits at $986B, and a break above the $995B–$1T resistance could trigger a new leg up for altcoins.
🎯 Short- and mid-term targets remain:
• $1.08T (recent top)
• $1.15T
• Potential for new all-time highs if momentum builds
✅ As long as price holds above the $920–$930B support zone, bulls remain in control. This keeps the door open for selective altcoin entries — ideally, projects with real structure, strong tokenomics, and clear momentum.

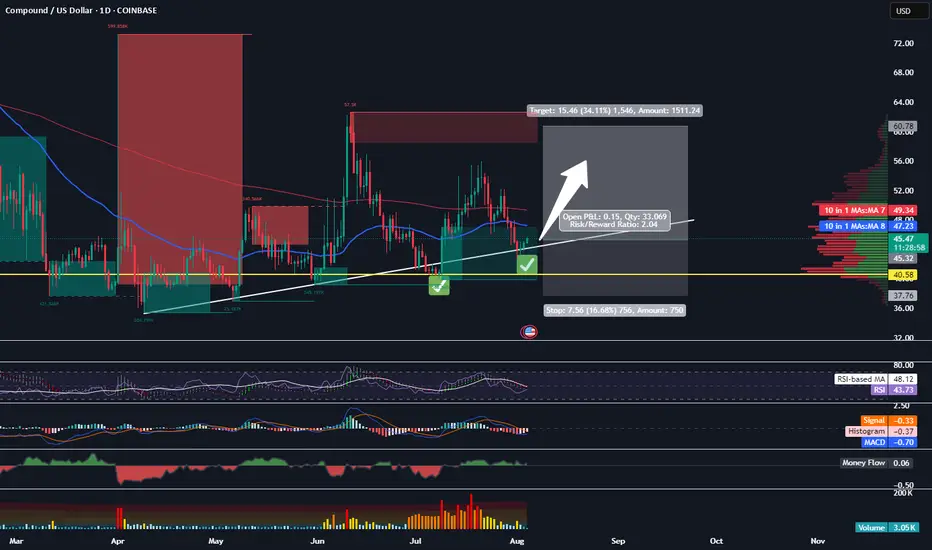
Buying COMP HereMorning Trading Fam,
After a several-week pause, my indicator is starting to light up with BUY signals again on a few alts. You may have noticed the update I gave on my TOTAL chart post. Price has come down to touch that 50-day EMA as expected. There was one more drop possibility (see post), however, I am taking my chance here, being a little more aggressive, and admittedly entering earlier than the crowd. I don't want to miss the run that I expect to come soon.
I received a BUY on FARTCOIN earlier and doubled up once again. Shortly thereafter, I received a signal on COMP here. We look to arrive on good support and are inside a beautiful block of liquidity. That is exactly where I received the signal to BUY, which I was hoping for. I'm jumping on this. Target will be around $60 with my SL set for $37.75 for a 1:2 rrr.
✌️Stew
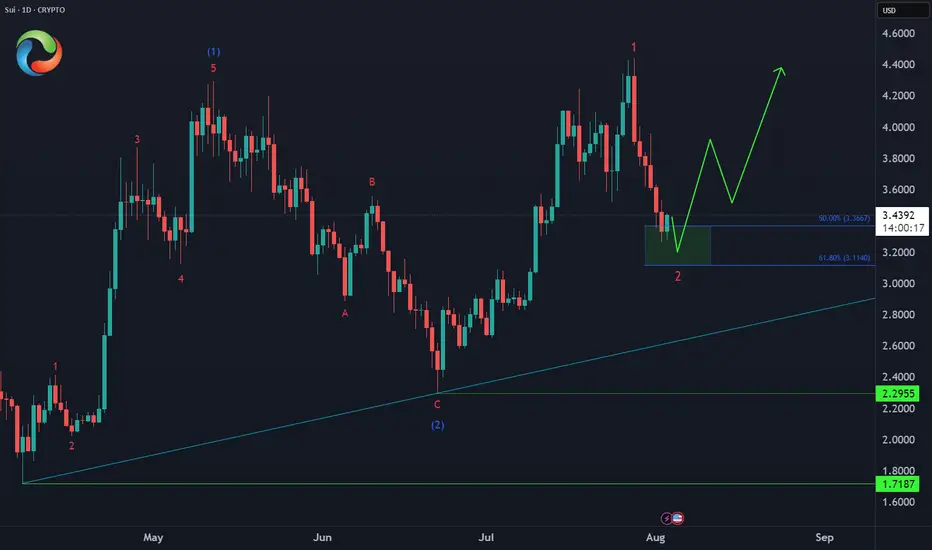
SUI Bullish Setup Ahead🚀 After breaking above its May peak, CRYPTO:SUIUSD has confirmed a higher high sequence, signaling bullish momentum. The current price action suggests it's now working on a higher low, likely forming around the 50%–61.8% Fibonacci retracement zone between $3.36 and $3.11 before resuming its rally.
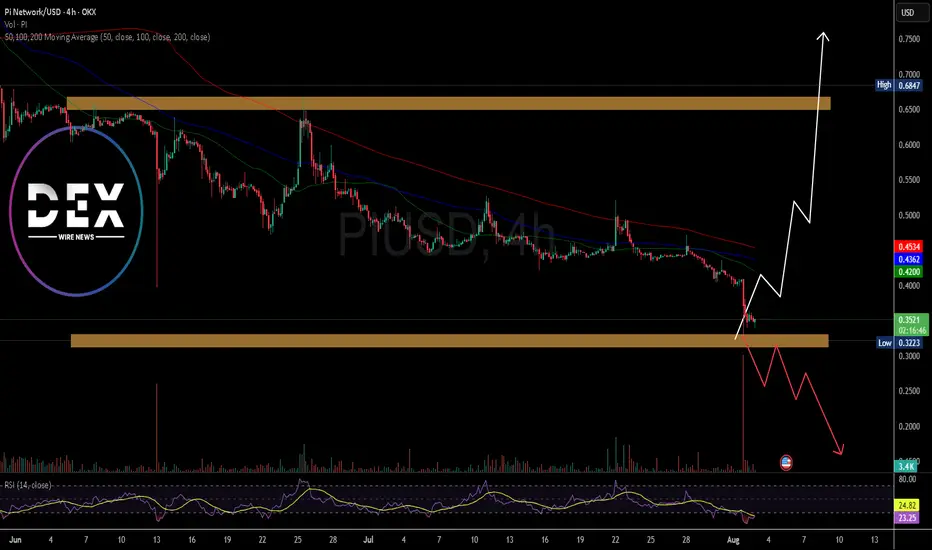
Is There Hope For PI Network? The Price of the notable altcoin NASDAQ:PI network has since seen a downtick of 80.86% since lunching and listing on major CEX like Kucoin, GateIo, OKX, etc. as per data from CMC.
The altcoin has lost the psychological $0.66 resistance zone forming a support or baseline at the $0.33 price range. with increasing selling pressure, NASDAQ:PI might experience further price dip to the $0.20 price point eventually leading to a deja vu to the $0.60 price point.
Possible factor to present price degradation is the dip in CRYPTOCAP:BTC 's price that most coins follow suit, and NASDAQ:PI wasn't an exception.
NASDAQ:PI is currently oversold as hinted by the data from Trading view. the altcoin has an RSI of 20 which entails weak momentum and possible chances of a market turnaround.
What Is Pi Network?
Pi Network is a social cryptocurrency, developer platform, and ecosystem designed for widespread accessibility and real-world utility. It enables users to mine and transact Pi using a mobile-friendly interface while supporting applications built within its blockchain ecosystem.
Pi Price Data
The Pi price today is $0.346618 USD with a 24-hour trading volume of $174,236,091 USD. Pi is down 14.58% in the last 24 hours. The current CoinMarketCap ranking is #38, with a market cap of $2,692,698,184 USD. It has a circulating supply of 7,768,487,700 PI coins and a max. supply of 100,000,000,000 PI coins.
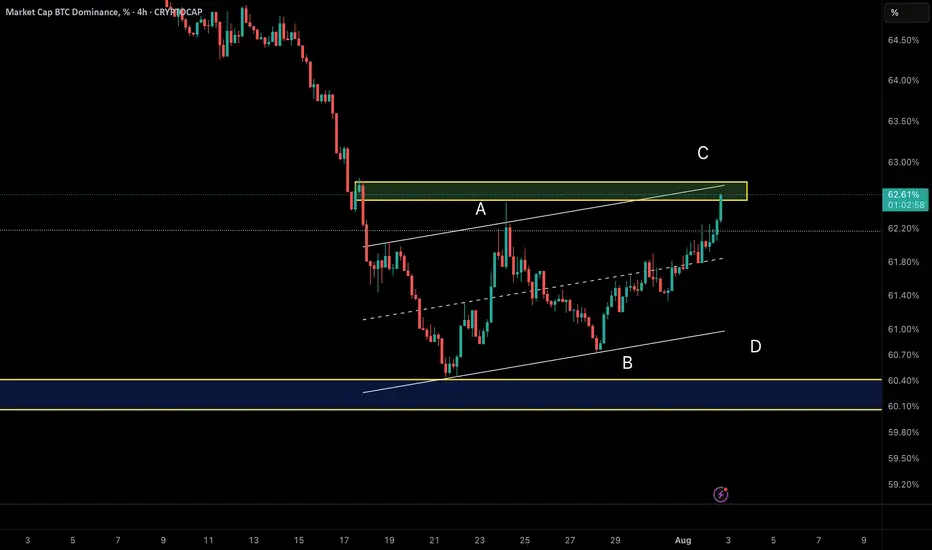
Smart Money Watching BTC Dominance – Rotation to Alts IncomingAfter a deep correction, BTC Dominance has entered a corrective upward phase inside an ascending channel.
Wave A rallied from 60.5% to 62.3%, followed by Wave B retracing to 60.74%.
Currently, Wave C is developing and has reached around 62.2%.
The key resistance sits near 62.7%, exactly at the upper trendline of the channel. This could act as a reversal point, potentially ending Wave C and triggering a bearish move.
💡 Implication:
If dominance drops from this zone, we could see capital rotation into altcoins, supporting a bounce across the broader altcoin market.
Sui chance for +60% on this zoneSui continue to grap liquidation but on the monthly and weekly timeframe we are still bullish.
I just saw good zone for trade. At 3.15 we have daily EMA + fibonacci 0.64 + Daily FVG.
I will suggest to add some leverage because invalidation is close to 2.9.
In this mid term bull market of altcoins we can see that SUI has good performance.
Ivan

APT - HUGE POTENTIAL (130+% SPOT) You probably forgot about this altcoin but it is justified. Downtrend since 2023 and lower highs, lower lows but....
If we look more close and use tool fixed price volume we can see that price is above VAL (Value area low), we had break through but price returns..Also good reaction of FVG (Fair value gap).
Now, we can try buy this coin and have some stop lose. Price is in range 172 days and all people forget abut this coin. Analysis is right only if we close daily candlestick about 6$.
Stop lose can be below 4.4$ which is 6-7% of losing.
Second entry is monthly level at 3.3 and stop lose should be below the lowest low 3$.
For me is great opportunity because risk reward is excellent.
Ivan

Opening A Small Position In FARTCOIN HereGood Morning Trading Family,
I may be a little early here, but at $1.00, I can't resist. I am picking up a small position in FARTCOIN here. I have three targets above. Each will eventually be hit IMO, but for now, I will only be shooting for TARGET #1. I may sell half at that point and let the rest ride.
Now, here are the technical reasons for making my entry here without waiting for my indicator to signal.
First of all, there are three trendlines, all significant, all converging at this one particular point, making this a powerful area of confluence!
Secondly, we broke to the topside of that descending trendline but never really came back to kiss mamma goodbye. Today we are doing that! This is a patent technical move that indicates healthy price fluctuation and is exactly what I have been waiting for.
Third, the VRVP indicates a ton of volume in this area (mostly buyer), which will be tough to break below without significant FUD, which, of course, is always a possibility.
Finally, all of my lower indicators show this thing is starting to get oversold: RSI, MACD, Chalkin MF, HA.
If we do dip lower, I will simply increase my position unless I hit my SL first. My SL is around .78 with my projected first target at 1.66 for a nice 1:3 rrr.
Good luck, all!
✌️Stew

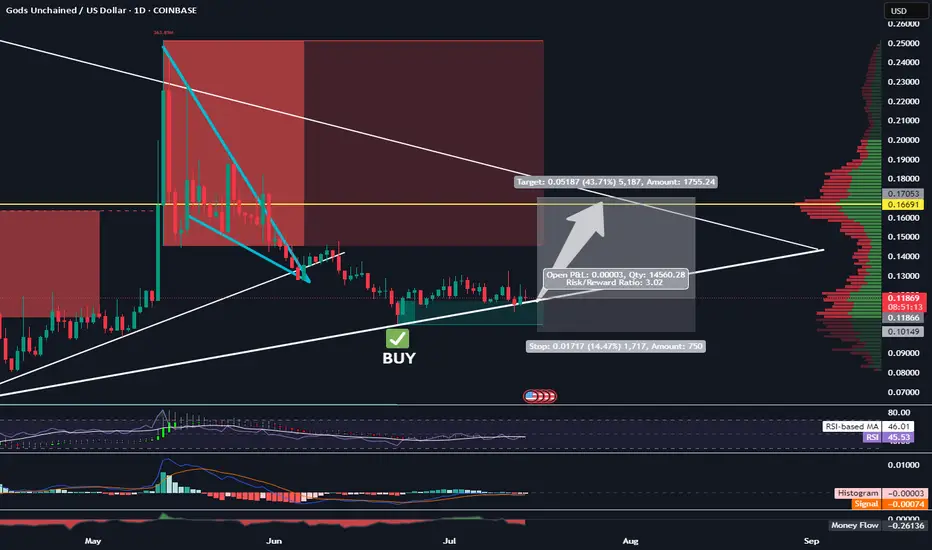
Long GODS - Target 17 Cents - 1:3 RRRTrading Fam,
As I continue to gain experience with my AI-created indicator, I am learning to remain patient and wait for the perfect setups. We have one here on GODS. You can see that we've returned to the bottom of a larger triangle and are using it as support. Additionally, we are within a favorable liquidity block where buyers tend to accelerate the volume. My indicator gave the BUY signal 2 weeks ago, and there has been plenty of sideways accumulation since the signal flashed. Probability suggest that GODS will pump soon.
I'll be targeting 17 cents with a SL at 10 for a 1:3 RRR.
Let's go!
Stew
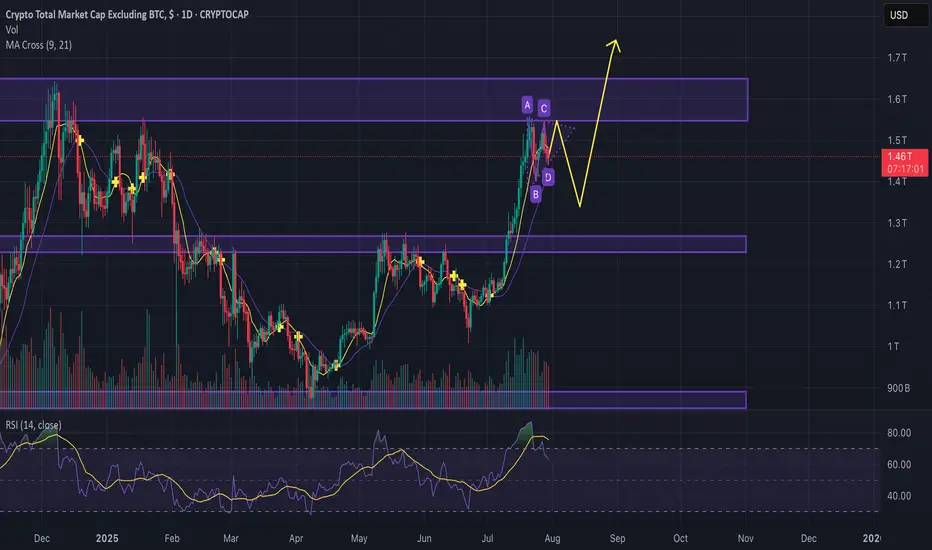
Is altcoin season over before it even started?Guys,
Gonna break down the situation on the chart to see where we can go next with the altcoins.
We see the key resistance levels and now we moving in kinda bullish pennant, but considering descending volumes we can easily test the support line and go back to the 1.25T. (maybe even lower)
After that, seems like we can try to go back and break the 1.64T resistance zone and previous ATH.
Anyway current market is going to be way more different from previous cycles, because huge institutions can feel nice only in hyper volatile, so divide your strategy between short, mid and long term investments to take profits.
Good trades and share your thoughts down to see what others think.
TOTAL3 – Still Bullish, But Waiting for Clarity
In my previous analysis on TOTAL3, I mentioned the high probability of a correction, but also noted that I didn’t expect the 925–940B zone to be reached.
And indeed, price reversed early — finding support around 975B before moving higher.
However, after a push up to 1.07T, the market has started to pull back again.
📊 Current Outlook – Two Scenarios I’m Watching:
Bullish Triangle:
Price may continue to consolidate into a symmetrical triangle, then resume the uptrend from there.
Deeper Pullback into Support:
The market could retest the 925–940B zone, a key support area, before bouncing back up.
⚠️ Bearish Reassessment?
Of course, if price breaks back below 925B and stays there, we’ll have to reconsider the bullish case.
But for now, the trend remains intact, and there’s no technical reason to panic.
📌 My Plan:
I already hold a bag of alts, and I’m not adding for now.
I’ll wait until the pattern becomes clearer — whether it’s a triangle breakout or a dip into support.
Until then, I’m sitting comfortably on what I already hold.
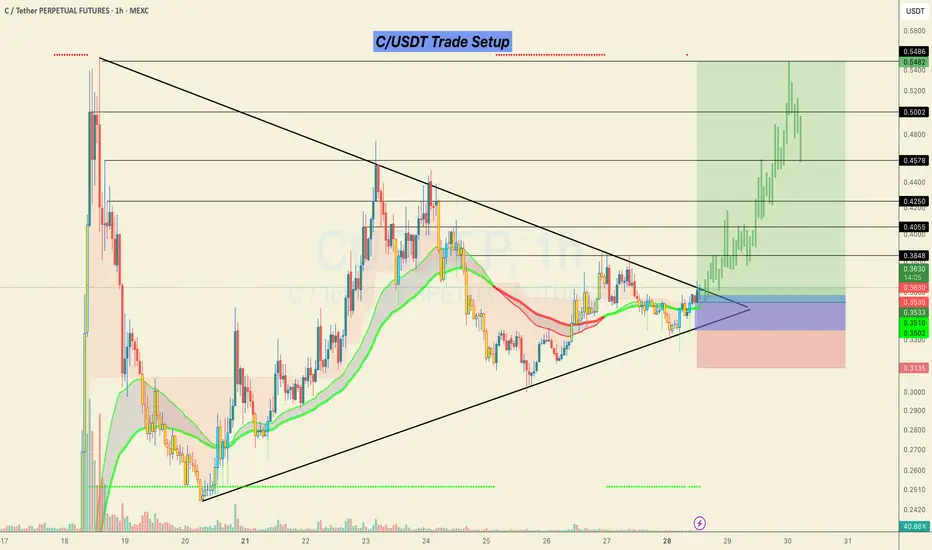
#C/USDT Looks ready for a 50% bullish move.C/USDT Trade Setup 📉
Currently forming a strong breakout structure after a long consolidation inside the triangle.
📌 Accumulation Zone:
0.3350 – 0.3580
🎯 Targets (Black Horizontal Levels):
0.4055
0.4250
0.4578
0.5002
0.5486
🛑 SL: Below 0.3135 (previous structural low)
Price broke out with solid momentum and retested the breakout zone. As long as we hold above the EMAs and the structure remains intact, continuation toward higher levels is likely.
This is a low-risk, high-reward setup as long as the risk is managed properly.
> Not financial advice. Trade at your own risk.
Do hit the like button if you want me to post more of these setups here.
Thank you
#PEACE
OP - Chance for +70%After weekly close we can see the volume coming in. On the chart we have resistance which if we break through then we can expect price 1.4 which is +70% from now.
If I have some advice for leverage trading I think its better to wait for daily close and then hunt retest if happens.
Rotations of money started already and I don't think is it a case for long run. We need to act, take profit and watch something else.
Like if you like analysis and idea.
Ivan

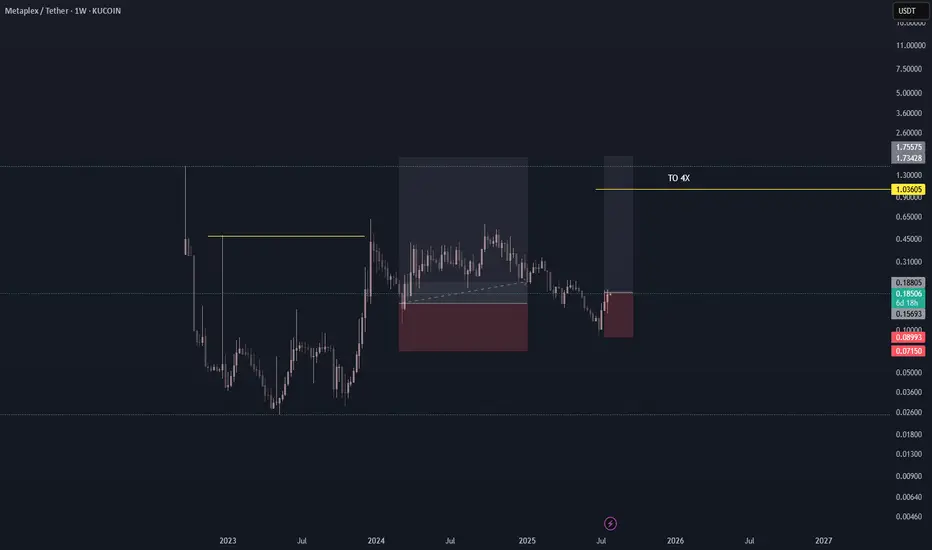
METAPLX/USDT BUY LONG FOR 4XCRYPTO - METAPLEX/USDT
EXPECTED RETURN TO 400-500%
** Crypto investing is highly volatile, you may lose all invested money, please keep it in mind and invest what you can lose and be ok.**
Cetus long setup, RR 4 There is big chance for leverage 3-4 if you want to try this coin. Invalidation is bellow if we looking based on Elliot wave theory.
Be aware if Bitcoin try to corrective more we will have deeper retracement.
We have one more zone bellow so if you want to try second zone, invalidation is the same but you can take much higher leverage
Ivan

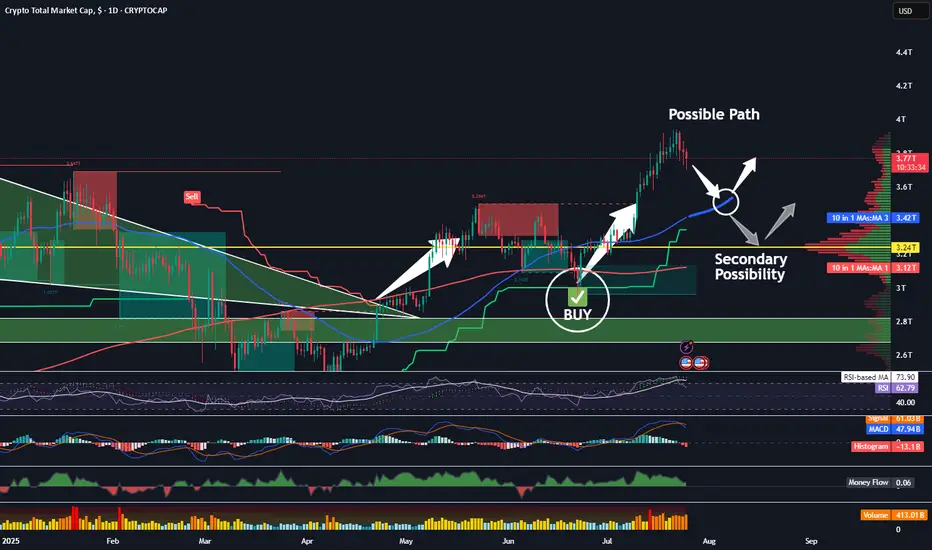
Now We WaitTrading Fam,
In my last video, I mentioned how I had been learning to trade more patiently, giving myself those high-quality, high-probability winning trades. This is a perfect time to illustrate that strategy.
With our altcoin market overheated, I am expecting more rest, accumulation, and pullback in many of our alts. The selection of even decent entries is very slim. It's time for us to sit back, wait, and let the trades come to us again.
The TOTAL chart shows us more clearly what may occur. Let's discuss a few important indicators on this chart.
First of all, we see my indicator popped a BUY signal right around 3T. We had a safe bet at that point; we were going to see quite a bit of buying action in the altcoin space. Indeed, we did. The altcoin market increased by about 25 percent and went all the way to 4T, at which point the sellers came back in. Now, we are in the middle of a little bit of a pullback, and I think there could be more to come. I am expecting at least a touch of that rising 50-day SMA, currently at 3.4T.
Supporting my thesis here are the crossover of the RSI to the downside of its 14-day MA, the MACD cross, the Chalkin money flow decrease, and the HMV indicating high volume during these sell-offs. Leverage is being liquidated. This is healthy!
It is possible that the total market cap could drop even further, all the way down to that 3.24T PoC on the VRVP. That is where we see most of our volume in alts has occurred. Keep these two targets in mind. Once hit, I will begin looking for more trade entries once again.
✌️Stew
ARUSDT: Crypto Summer Game PlanBINANCE:ARUSDT
RWA + AI coin, two narratives that will be hot
Not inflationary, 99% supply circulating
People really use it for permanent storage
Main CEX liquidity is very thin in AR -> possible God candles like in previous history
Possible supply shock at late stage
Main risk is community governance and hacks. Otherwise in case of altseason this should meet the marked targets. Preferable accumulation zone is <5 USD, most probably not available anymore.

HYPE Swing Long Opportunity - Altcoin Season📌 Fundamental Sentiment:
The crypto market — alongside broader risk assets — continues to gain traction. This momentum is largely fueled by rising expectations of policy shifts in the U.S., with Trump intensifying pressure on Jerome Powell and advocating for aggressive rate cuts from the Fed.
📌 Technical Analysis:
HYPE is approaching a key HTF bullish trendline, and confluences are stacking up in the same region:
✅ HTF Demand Zone
✅ Equilibrium (EQ) of the HTF bullish trend
✅ Bullish Trendline Support
These three HTF confluences overlapping at the same price zone indicate a high-probability setup for a significant bounce and a possible swing long opportunity.
📌 Gameplan:
Price hits HTF bullish trendline
HTF demand zone gets tested
EQ level tapped → discount offered to buyers
📌 LTF Confirmation Criteria:
I’ll wait for:
A 1H swing break
A strong 4H rejection candle
These will confirm momentum shift. If confirmed, I’ll enter a swing long.
🎯 Target: $60
💰 Potential gain: ~+50%
❗ Stop-loss: Below the swing low that triggers the LTF confirmation
—
🔔 Follow for daily setups and weekly macro recaps
💬 Drop your chart or questions below!

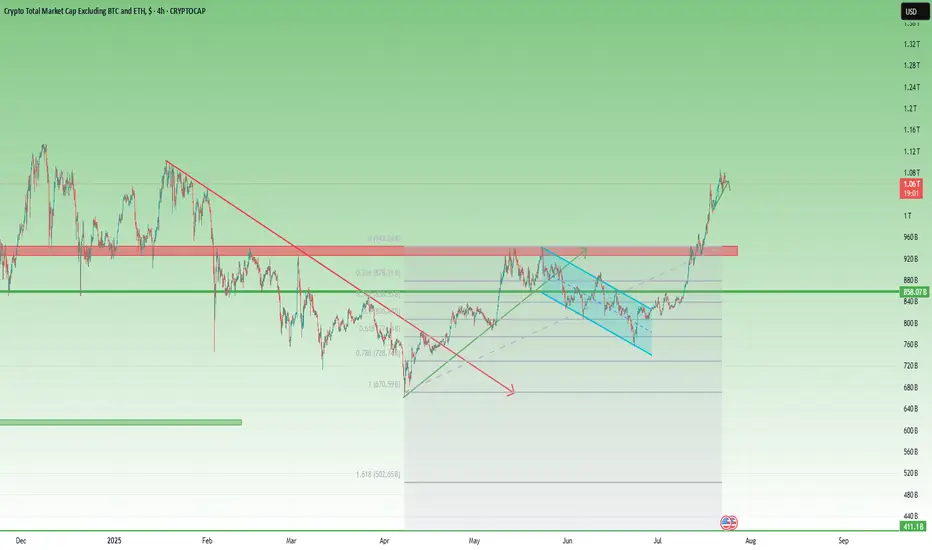
Total3 – Back Above 1T, but Will It Offer a Second Chance?📈 What happened since April?
After the sharp low in early April, Total3 began to recover steadily.
Toward the end of the month, it broke above the falling trendline that had been holding since January — a key technical shift.
This triggered a strong recovery rally, pushing total altcoin capitalization (excluding BTC & ETH) to the 930–940B resistance zone.
📉 Then came the pullback…
Price printed a double top near resistance, followed by a drop — but not a bearish one.
Instead, the correction was orderly, forming a bullish flag, with the low landing right on the 61.8% Fibonacci retracement. Classic healthy structure.
🚀 The latest breakout
Earlier this month, Total3 launched a very impulsive leg up, reclaiming the 1 trillion level with strength.
At the time of writing, we’re trading back above 1T, and momentum remains on the bulls’ side.
However, the chart does look a bit overextended in the short term, suggesting a correction could follow soon.
🧭 Trading Plan – Will We Get a Retest?
The textbook play would be to wait for a deep pullback toward previous support levels.
BUT – I don’t believe we’ll get a full retest of the breakout. Altcoins may stay elevated or correct only modestly.
Instead, I’ll be watching the 1T zone and slightly below — that’s where I’ll look to load up on interesting altcoins.
📌 Conclusion:
Total3 has broken structure, reclaimed key levels, and is showing classic bullish continuation behavior.
The market may not offer you the perfect entry — but small dips near 1T could be all we get before another move higher. 🚀
Be prepared. Don’t wait for perfection in a market because rarely gives it.