NEAR Swing Long Idea - Altseason 2025📌 Fundamental Sentiment:
The entire crypto market is rallying, alongside other risk assets. This is mainly driven by U.S. policy expectations — Trump is pressuring Powell to resign and aggressively pushing for rate cuts from the Federal Reserve.
📌 Technical Analysis:
NEAR has recently broken and closed above a significant HTF support/resistance level.
Additionally, we’re now trading inside the 0.75 Fibonacci retracement level of the HTF bullish trend — which I define as the maximum discounted zone.
For this setup, I’ll apply my Deep Range Theory (DRT):
If price dips below the 0.75 zone and accumulates there,
Then breaks above 0.75 after a period of consolidation,
→ It signals that price aims for the 0.5 level of the range and will likely run HTF liquidity for either reversal or re-accumulation before continuation.
📌 Gameplan:
✅ Break and close above HTF S/R
⏳ Waiting for break and daily close above 0.75
🔄 Retest to LTF demand (4H–1H)
📈 A bounce on LTF demand will trigger the long setup
📌 Trade Management:
This is a mid-term swing trade, as I’m following the HTF bullish trend.
🎯 Target: $5 — which is approximately a +70% move from current price.
❗Risk Management:
If price makes a daily close back below 0.75 after breaking and closing above, I will exit the trade to preserve capital.
I’ll also monitor macro sentiment closely. If there's a sharp bearish shift, I may consider an early exit before reaching the HTF target.
—
🔔 Follow the channel for daily trade ideas & weekly macro recaps.
💬 Drop a comment below if you have any questions or insights!
Altcoinseason

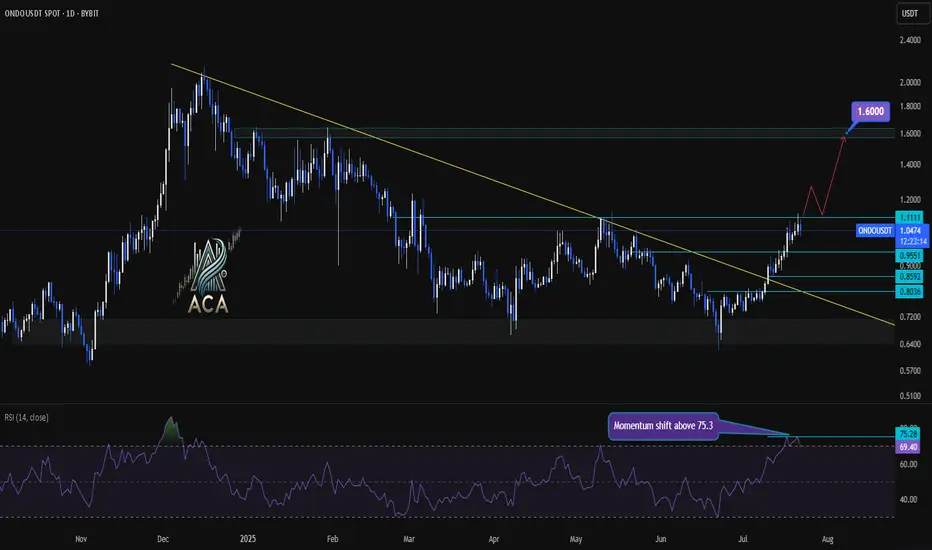
ONDOUSDT Daily Chart Analysis | Momentum Shift & Breakout LevelsONDOUSDT Daily Chart Analysis | Momentum Shift & Breakout Levels
🔍 Let’s dive into the ONDO/USDT daily chart and break down the latest momentum signals, key breakout areas, and targets for bulls.
⏳ Daily Chart Overview
The daily trend shows significant recovery after prolonged downward pressure, with price action now testing critical resistance levels. A key descending trend line has recently been challenged, highlighting a potential shift in market structure.
🔺 Bullish Setup
- Momentum Trigger: The RSI has closed above 75.3, signaling a strong momentum shift and upping the odds for continued upside.
- Breakout Confirmation: Watch for a daily candle close above the $1.1111 resistance level. This would confirm a bullish breakout and could serve as a solid trigger for further upside.
- Trend Line Dynamics: The price has decisively broken above the major descending trend line, which had capped rallies for months—removing a significant area of supply and emboldening bulls.
- Upside Target: Once confirmed, this setup opens the door for an advance towards the $1.60 area, where the next major resistance sits.
📊 Key Highlights
- Daily RSI closing above 75.3 reflects strong market momentum and buyer dominance.
- A daily candle close above $1.1111 can be used as a bullish trigger.
- The long-term descending trend line has been broken, indicating a major momentum shift.
- Immediate upside target stands at $1.60, representing a clear resistance level for profits or further evaluation.
🚨 Conclusion
Momentum is clearly shifting in favor of the bulls as technical barriers fall by the wayside. For traders looking to position long, confirmation above $1.1111 combined with the powerful RSI reading sets the stage for a move towards $1.60—keep these levels on your radar as the setup plays out!
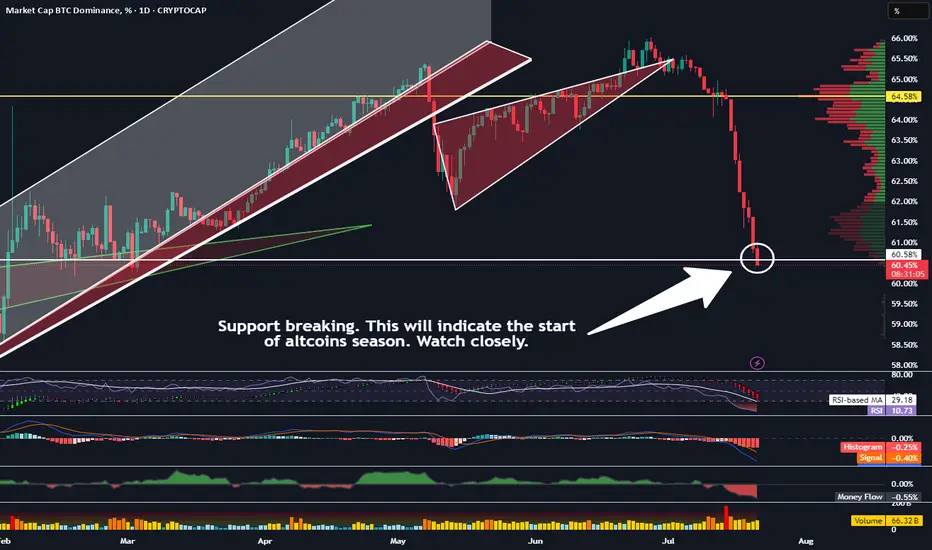
When This Support Breaks, Altcoin Season Becomes Official!Trading Fam,
We have many signs that altcoin season is almost upon us. Solana is breaking important resistance. Eth is nearing its target (both of these posts can be found below). But the most important indicator imo can be found on our BTC.D chart. Dominance has now reached an important support. I was kind of expecting a bounce here. And it still could bounce. But if it doesn't, then I feel like I can officially state that we will be in altcoin season for the rest of the year. Here's what you should be watching. If the body of that daily candle closes below our support today and then a new one opens and also closes below the support, its a wrap.
Let's go!
✌️Stew
Eth and the Altcoin Season Once Etherum retest and breaks previous cycle ATH and LMACD visits the diagonal traced from previous cycles (white dot). An altcoins season might follow.

Drop Your Token – I’ll Do The AnalysisHey everyone! Hope you’re having an amazing weekend !
Want me to analyze your favorite token ? Just drop your request in the comments using this format:
Request Format
Project Name: Bitcoin
Token Symbol: BTC( BINANCE:BTCUSDT )
Important Notes:
I’ll pick and analyze only the first 10 tokens requested .
One request per person — so choose wisely!
I’ll reply directly under your comment with the analysis.
If you find this helpful, don’t forget to Like ❤️ and Share this post with your friends!
Here’s to your success — health, wealth, and great trades! 🚀

DOGE/BTC: HTF Retest Complete — Reversal BrewingDiving into DOGE/BTC, we’re seeing strong bullish confluences that align well with the DOGE/USDT structure and support the idea that the macro low is in.
Looking back across all available data, DOGE/BTC has traded within a clear 7-year accumulation range dating back to 2014, bounded by a defined range high resistance and range low support. This long period of consolidation enabled massive accumulation, ultimately leading to the first breakout in 2021, which rejected at the highs, pulled back, and then exploded into a cycle ATH.
Since that 2021 high, DOGE/BTC has been in a 4-year downtrend, retracing back into discount pricing, right into the range high of that original accumulation zone — which now acts as a major HTF demand level and last point of support before the original breakout.
📉 What’s happened recently?
- Price swept 2024 swing lows (SSL)
- Tagged the HTF demand zone
- Retested the 2021 breakout level (accumulation range high)
- Coiling inside a descending wedge with contracting volatility
This entire region is a key reversal zone from both a structural and psychological standpoint. It’s where we typically see major trend shifts form, and the structure suggests we’re forming a HTF swing low and bottom from this area.
🧠 Add this to the confluence from DOGE/USDT — which also appears to have printed its bottom — and the case for a macro reversal gets even stronger.
As this wedge tightens and price continues to compress against long-term support, I’m anticipating an explosive breakout that kickstarts the next leg of the HTF uptrend — effectively a continuation of the original breakout from the 7-year range.
5D:

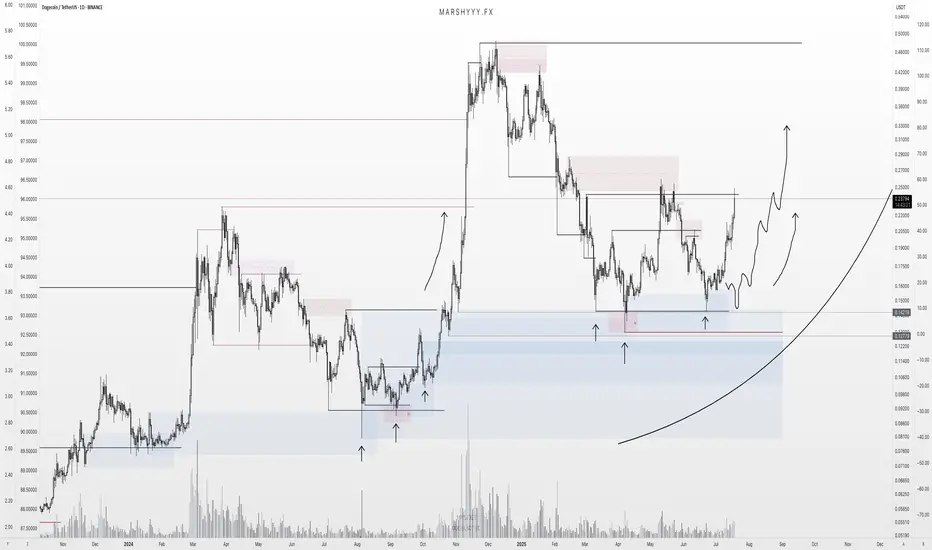
DOGE Update: Reversal Playing Out — $1+ in Sight?DOGE is playing out almost exactly as forecast back on June 14th, where I was monitoring for price to sweep the SSL and tap into range low demand within this larger HTF range.
Price did exactly that — pushing into discount, tagging the marked demand zone, and bottoming out right where I expected the reversal. I DCA’d hard at $0.165 after the initial low printed — just as planned.
Now sitting around +50% on those buys, and my plan remains to ride this out toward the ATH at $0.74 and potentially $1+.
The HTF closes forming here — across 3D, 4D, 5D, 6D candles — are showing clear strength. For me, the low is likely in, and I’m expecting new higher highs and ATHs from here. Now it’s just about letting the market do its thing, trailing stops, and taking profits into strength as alerts and targets get hit.
Zooming way out — I’m also watching DOGE’s 10-year uptrend channel. Price has once again tagged the lower bound of that channel, and historically, this has led to moves back to the channel highs.
🧠 Layer on a fib projection from the previous ATH to the bear market low, and we get:
1.272 Fib → ~$1.54
1.618 Fib → ~$3.92
Both of which align perfectly with the upper bounds of that long-term trend channel — giving us a key HTF reversal zone to monitor in the future.
In summary:
- Reversal from demand ✅
- DCA filled ✅
- HLs printing ✅
- Targets = ATH and beyond
- Watching HTF fibs + channel highs for eventual cycle top formation
DOGE is doing what DOGE does — don’t overcomplicate it.
1D:
3D:
1W:
1M:
The Final Turn Before the Altcoin RotationAs Bitcoin continued its rise, altcoins couldn't keep up. This isn't the first time; the market has experienced this many times. The general pattern is as follows:
1. Global liquidity increases, providing a kind of spark to the market.
2. Bitcoin catches fire, and a bull market begins. If global liquidity increases during this time, great.
3. For various reasons, altcoins don't rise at the same pace as Bitcoin, and therefore Bitcoin's dominance begins to gradually increase.
4. When the market reaches saturation, dominance declines, leading to a rotation into altcoins.
5. The altcoin market capitalization equals Bitcoin's, and the bull market begins.
We're currently at a stage where Bitcoin's dominance has peaked and liquidity is still rising. The beginning of a decline in dominance will trigger a market rotation. This will trigger a capital flow into altcoins, bringing their market value equal to Bitcoin's.
Therefore, we're at the final plateau before entering a bull market. A further rise or hold in Bitcoin is expected. I'm currently buying altcoins, but I'm holding Bitcoin. I don't have a sell mindset at the moment.
CRVUSDT 3D CURVE DAO TOKENDecided to update the idea. As always, key support and resistance levels are marked on the chart — along with price reactions at those zones.
Currently, we’re observing a potential breakout from a bull flag formation. The mid-term target lies in the $2.3 – $3.4 range, with a possible extension up to $4.8 as a maximum target.
⚠️ Don’t forget: there’s still a chance we get a retest of the bull flag — around the $0.64 level — before any major move to the upside. Manage your entries accordingly

Total2 wants to inv h&s its way into completing its cup’s handleShould break above the neckline of this lemon lime colored inverse head and shoulder pattern in the upcoming 1-3 weekly candles here, and we are likely less than a week a way from the daily chart golden cross (not shown here). The breakout target from this inverse head and shoulder pattern will take price above the rimline of the larger cup and handle pattern and upon triggering the breakout from that we head to the light blue erasure move target which fro where price action currently is is about a 100% gain for the alt racket which should confirm alt season. *not financial advice*

Altcoin Season Has Officially Begun!We're now seeing top altcoins like ETH, BONK, and ONDO outpacing Bitcoin with impressive gains.
Ethereum (ETH) has just broken above $3,100
BONK is surging back toward its winter highs
Portfolios are growing daily — even without active trading
The momentum is building fast, and the next few weeks could be highly rewarding for altcoin holders. Buckle up — Altcoin Season is here.

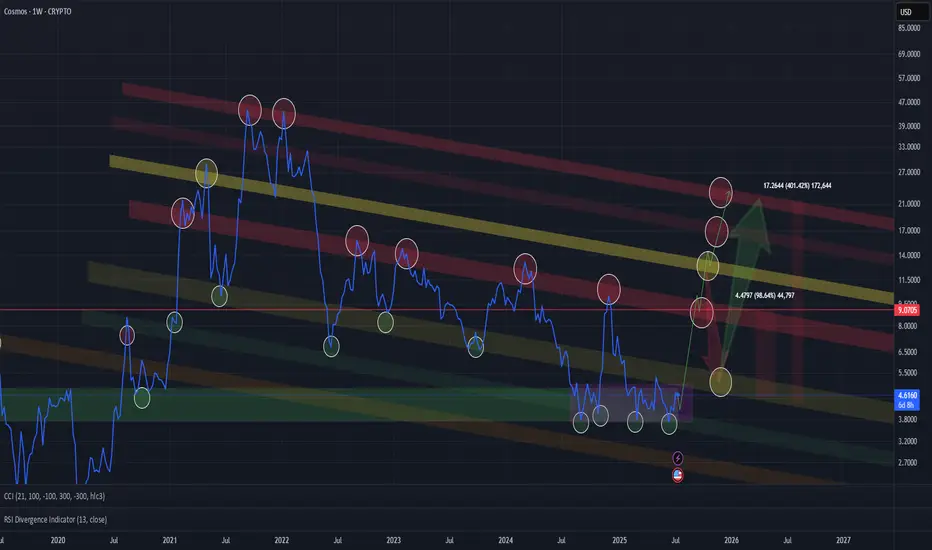
ATOM (COSMOS)🔹 Accumulation Phase in Play
We’re currently sitting in a clear accumulation zone — price is holding steady, showing signs of position-building by stronger hands.
📈 The next key areas are distribution zones, all of which are already marked on the chart. If you're entering a position now, odds are high you'll be able to secure profits as we move up. Just make sure to set a stop-loss — and don’t get greedy if you're aiming for the top.
⚠️ Even though it’s less likely, there’s a small chance of a shakeout near the yellow zone, but I personally doubt it — the market is already heavily shaken, sentiment is fearful, and many have been waiting for a move for too long.
🕰️ We’re also running out of time — the 4-year cycle is coming to a close by the end of this year. Historically, this aligns with significant market moves
Altcoins Market Cap: We on the Verge of a 5T Exposion!Hey crypto traders! Let’s dive into this monthly chart of the Altcoins Market Cap. You won’t believe what’s brewing!
We’re currently approaching a critical channel support at 200B, a level that might act as a springboard for massive rally — check out the jumps from channel support in 2019 and 2023! Each time the market cap hit this support, it skyrocketed, and now we’re at that pivotal moment again.
The chart projects a jaw-dropping target of $5T within the next 24 months if history repeats itself!
The price action shows we’re testing the lower boundary of this ascending channel, with the market cap sitting around 239.65B. A bounce here could send altcoins on a parabolic run, potentially hitting 5T by mid-2026. But if support fails, we might see a dip toward 100B — let’s keep an eye out!
Key Levels to Watch:
Support: 175B (channel support)
Resistance: 1.55T, 5T (projected target)
Breakdown Risk: 100B
Are altcoins about to explode to 5T, or will we see a deeper correction? Drop your thoughts below!
PS take a look at others vs. btc price action here:

BTC Dominance (BTC.D) — Weekly Failed AuctionChart Context
• Instrument: CRYPTOCAP:BTC.D
• Time-frame: 1-Week
• *Key vLevels (dashed):
• 68 % – 2021 supply pivot
• 66-68 % zone – recorded a Weekly Failed Auction (wick above, close back below)
• 62.50 % – mid-range support / prior breakout shelf
Failed Auction at the Top
Price wicked into the 66-68 % vLevel but closed lower.
On a weekly chart that pattern often marks exhaustion; bulls couldn’t maintain control.
First Support = 62.50 %
If BTC.D trades < 62.50 % and closes a weekly bar there, odds rise that capital rotates out of BTC and into alt-coins.
Historically this breakdown triggers the early stages of alt-season (see 2021 analogue).
Invalidation
Weekly close > 68 % negates the failed auction and points to renewed BTC strength (alts lag).
How I’ll trade / allocate
Spot BTC bias – overweight BTC while dominance holds > 62 %.
Alt-coin rotation – shift 20-35 % into high-conviction alts only after a confirmed weekly close < 62 % and follow-through below 60 %.
Risk checks – trim alt exposure back to cash/BTC if dominance reclaims 62 % after a breakdown (failed alt-season).

GRIFFAIN Chart Signals Bullish Rally$GRIFFAIN is forming a bullish ascending triangle pattern on the daily chart, signaling a potential breakout. Price is consolidating just below key resistance at $0.048, supported by a strong ascending trendline and a historical support zone.
A breakout above the triangle could trigger a sharp move toward the $0.15 level, offering a potential upside of over 100%-200%. The setup suggests growing bullish momentum and a possible trend reversal.
BITGET:GRIFFAINUSDT

Cronos (CRO) Soars +20% – Can the Rally Push to $0.10?Over the past 24 hours , the Cronos project with the CRO ( COINBASE:CROUSD ) token has seen a price increase of nearly +20% .
Let's see if we can still profit from the movement of the CRO token .
What is Cronos (CRO)?
Cronos is an EVM-compatible blockchain built on the Cosmos SDK. It supports DeFi, NFTs, faster payments, and even AI‑capable dApps. Its native token, CRO, powers fees, staking, and ecosystem activities.
Why CRO Jumped +20% Today (July 8)
Technical leap: Sub-second block times and faster throughput
Better UX: Real-world ready for fast DeFi, payments, and AI dApps
Increased adoption: Greater utility across CAPITALCOM:CROUSD ecosystem
Trader momentum: Volume surges and speculative interest
Strategic roadmap alignment: Upgrades following gas fee improvements ---------------------------------------------------------------------
Now let's examine the CRO token chart on the 4-hour time frame from a technical analysis perspective.
CRO token is currently trying to break the Resistance zone($0.0960-$0.0925) .
Also, in terms of Elliott wave theory , this CRO token price increase with high momentum should be in the form of wave 3 and we can expect a correction to the Potential Reversal Zone(PRZ) for CRO .
I expect CRO to re-attack the Resistance zone($0.0960-$0.0925) after entering the PRZ and rise to at least near $0.1(Round Number) .
Note: Stop Loss (SL) = $0.847= Worst Stop Loss(SL)
Note: If the CRO token breaks the Resistance zone($0.0960-$0.0925) without correction, we can expect a break of the Resistance lines.
Note: It is better to enter a trade if you find the right trigger for a Long position, as a Short position is more risky.
Please respect each other's ideas and express them politely if you agree or disagree.
Cronos Analyze (CROUSD), 4-hour time frame.
Be sure to follow the updated ideas.
Do not forget to put a Stop loss for your positions (For every position you want to open).
Please follow your strategy and updates; this is just my Idea, and I will gladly see your ideas in this post.
Please do not forget the ✅' like '✅ button 🙏😊 & Share it with your friends; thanks, and Trade safe.

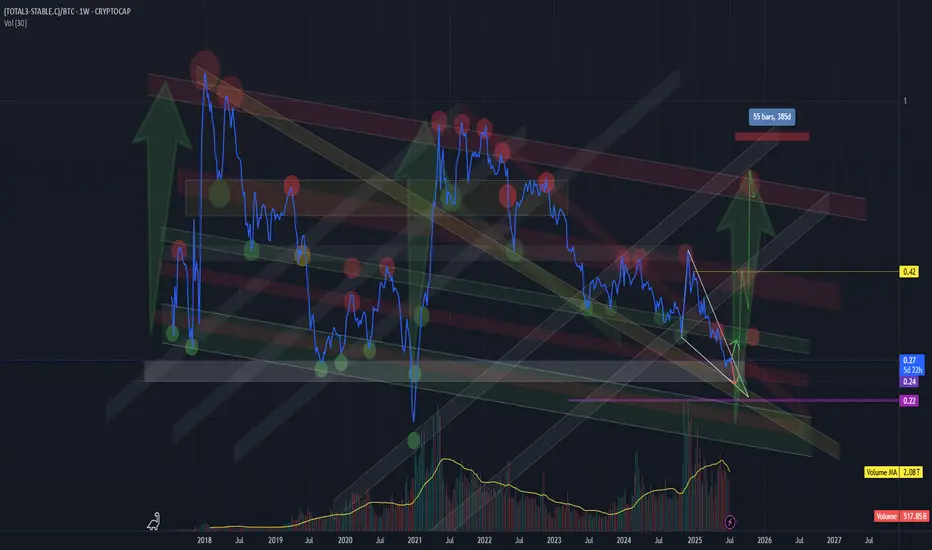
True altcoin-to-BTC strength indicator(CRYPTOCAP:TOTAL3-CRYPTOCAP:STABLE.C)/CRYPTOCAP:BTC
This formula strips out the noise and gives a true altcoin-to-BTC strength indicator.
STABLE.C removes all major stable coins (USDT, USDC, DAI, etc.).
The chart clearly shows previous capitulation zones and launch points for altseasons since 2017
Current formation – potential triangle:
Market makers appear to be coiling price action, forming a triangle-like structure.
This often precedes a volatile breakout — likely to the upside if history repeats.
Market psychology:
Many traders are already heavily positioned in altcoins, which suggests we could be nearing final capitulation.
Historically, altseasons never began with euphoria — but rather fear, exhaustion, and apathy.
BTC halving occurred in April 2024, and typically, the peak of the altseason follows 12 to 16 months later.
The seasonal strength of Q4, often fuels altcoin rallies.
!!! A final washout into a key support zone (on this ratio) could mark the trigger for the next major altseason — possibly starting around August 2025 !!!!!!!!
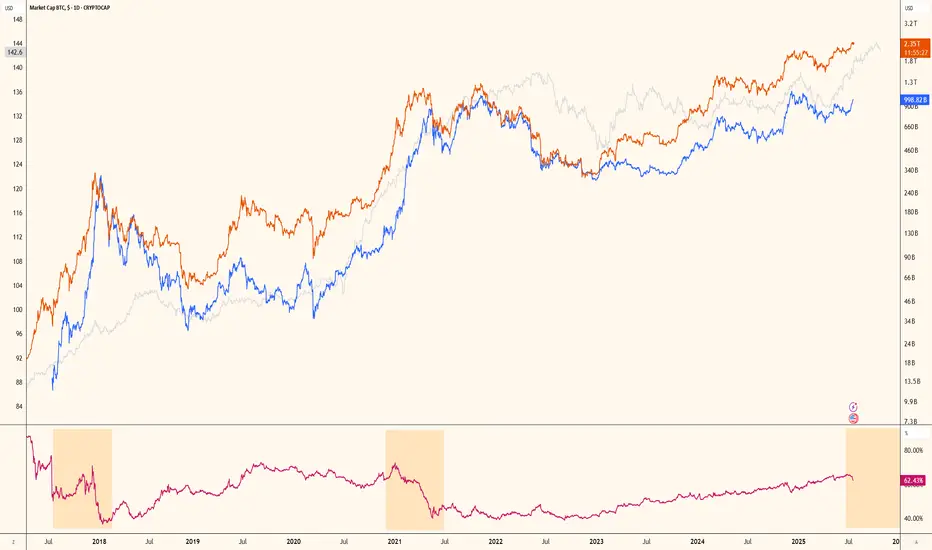
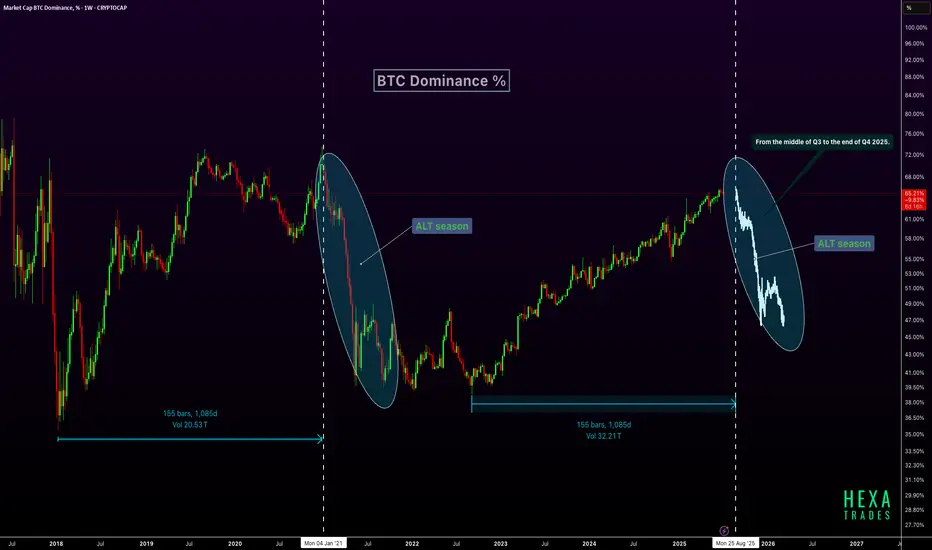
Altseason Ahead? BTC Dominance Cycle RepeatsBTC dominance is forming a pattern similar to the 2021 cycle, where dominance peaked after a long uptrend and then sharply declined, triggering a major altseason. Interestingly, that drop occurred after a 1,085-day rise, a time span we are once again approaching in 2025, projected to end around late August. If history repeats, BTC dominance could start declining from mid-Q3 2025, leading into a strong altcoin rally that may last through the end of Q4. This setup aligns with typical post-halving behavior, suggesting the final phase of the cycle could heavily favor altcoins.
CRYPTOCAP:BTC CRYPTOCAP:ETH CRYPTOCAP:XRP
LITECOIN (LTC) - On The Verge Of Exploding - ETF Catalyst?Litecoin: A Decentralized Network with a Differentiated Risk Profile
Litecoin (LTC), launched in 2011 by former Google engineer Charlie Lee, is one of the oldest and most active Layer-1 blockchain networks in the cryptocurrency space. Often referred to as the “digital silver” to Bitcoin’s “digital gold,” Litecoin was designed to offer faster transactions, lower fees, and broader accessibility while maintaining a similar monetary policy and codebase.
This post aims to provide an overview of Litecoin’s technical structure, usage, risk profile, and current developments—without speculative bias—so readers can form their own assessments.
1. Transparent Origins and Founder Dynamics
One key difference between Litecoin and Bitcoin lies in the identity of their respective creators. Bitcoin was developed by Satoshi Nakamoto, a pseudonymous and still-unknown individual or group, who is estimated to hold 750,000 to 1.1 million BTC—a significant portion of the total supply that has never moved. The dormant status of these holdings has occasionally raised concerns about future market impact if they were ever activated.
In contrast, Litecoin was founded by Charlie Lee, a known and public figure who was active in the community before, during, and after the launch. In 2017, Lee announced he had sold or donated nearly all his LTC holdings to avoid any potential conflict of interest. Today, no founder or insider is known to hold a disproportionate share of the Litecoin supply. This level of transparency and decentralization has been interpreted by some as a factor that lowers long-term governance and concentration risk.
2. Structural Simplicity and Leverage Exposure
Another distinction between Litecoin and Bitcoin lies in market structure and exposure to leverage.
Bitcoin is widely used as collateral in crypto lending markets and institutional derivatives, including perpetual futures and structured products. This has introduced significant systemic risk during periods of market stress, as high leverage has historically led to cascading liquidations across centralized and decentralized platforms.
Litecoin, in contrast, has relatively limited exposure to leveraged products and collateralized lending. It is not commonly used as collateral in CeFi or DeFi protocols, and institutional futures markets for LTC are smaller and less active. As a result:
Litecoin is less likely to trigger or be affected by mass liquidations
It has reduced systemic risk due to lower market entanglement
Its price tends to reflect more organic supply/demand dynamics
It is less involved in cross-collateralized or rehypothecated loan systems
This simpler structure may appeal to risk-aware investors looking for cleaner exposure without the reflexivity effects common in heavily leveraged markets.
3. Scarcity and Monetary Policy
Litecoin shares a similar deflationary model with Bitcoin, with a hard cap of 84 million LTC and scheduled halving events every four years. The most recent halving occurred in August 2023, reducing the block reward from 12.5 to 6.25 LTC per block.
With over 75 million LTC already mined, fewer than 9 million remain in future issuance. The protocol’s monetary policy is deterministic and cannot be altered unilaterally, which may appeal to those who prioritize predictable supply and inflation resistance.
While Litecoin’s cap is four times higher than Bitcoin’s, the relative issuance schedule and halving dynamics mirror Bitcoin’s design. Some investors view this as a hedge against fiat currency debasement, although the asset's volatility and adoption context should be taken into account.
4. Network Fundamentals and Real-World Use
Litecoin has maintained near 100% uptime since inception, and its transaction throughput and fee structure are generally favorable compared to many competing networks.
In 2024, Litecoin became the most used crypto for payments via BitPay, surpassing Bitcoin in transaction volume, driven by its fast 2.5-minute block times and low transaction fees. It is supported by major platforms including PayPal, and accepted by thousands of online and retail merchants.
From a security perspective, Litecoin’s hashrate reached all-time highs in 2025, partly due to merge-mining with Dogecoin, which has helped strengthen its proof-of-work infrastructure. Network upgrades like MWEB (MimbleWimble Extension Blocks) have added optional privacy layers to Litecoin’s UTXO model, while Lightning Network integration supports instant payments.
These developments suggest that Litecoin continues to evolve, with emphasis on efficiency, user privacy, and practical usability.
5. Institutional Presence and ETF Outlook
Litecoin has seen modest but growing institutional involvement. Products such as the Grayscale Litecoin Trust (LTCN) have existed for several years, and Coinbase introduced Litecoin futures trading in 2024. Fidelity also offers LTC trading and custody to institutional clients.
More notably, a Spot Litecoin ETF application is currently under review by the U.S. Securities and Exchange Commission (SEC), with analysts from Bloomberg estimating a 95% probability of approval before the end of 2025. If approved, this would make Litecoin one of the first proof-of-work assets outside of Bitcoin to gain direct exposure through a regulated ETF vehicle.
Should that happen, it may increase access, liquidity, and legitimacy among traditional investors. However, as always, regulatory decisions remain uncertain and subject to broader political and market conditions.
6. Technical Structure and Long-Term Price Action
From a macro-technical perspective, Litecoin has historically followed a pattern of higher lows and higher highs across each market cycle. This structure remains intact as of 2025, with a strong support at 81 USD on a 6 months timeframe.
Summary
Litecoin presents a combination of characteristics that differentiate it from other crypto assets, including:
✅ A public, transparent founder and no major insider dominance
✅ Limited exposure to leveraged lending, reducing systemic risk
✅ Deterministic monetary policy with a fixed supply and halving schedule
✅ Real-world usage in payments and retail adoption
✅ Strong network security and development activity
✅ Potential ETF approval that may broaden accessibility
These features do not necessarily imply outperformance, but they form the basis for an asset with a relatively clean structure, historical resilience, and a distinct position in the crypto ecosystem.
🔎 Disclaimer:
The information presented here is for educational and informational purposes only and should not be interpreted as financial advice.
Always conduct your own research, assess your individual risk profile, and make investment decisions based on your own analysis and objectives.

HolderStat┆XRPUSD forming the rising bottomBINANCE:XRPUSDT has broken above resistance and is consolidating above the breakout zone. This mirrors previous triangle–consolidation patterns that preceded upside moves. If momentum continues, a run toward 2.34 is in play.

OTHERS data points to biggest ALT-Season Good Day Investors and traders,
This the OTHERS on the weekly and I have taken some measured moves in what could be expected in time and price.
The OTHERS chart in my opinion is the last form of the higher risk curve which generally happens at the very end of cycles The others does not include the top ten crypto, so it a very good form of risk on.
I have been looking at the OTHERS chart fairly often of recent times because this is the time for it to really outshine Bitcoin and lead the market with fairly explosive gains.
I have marked a couple of possible time lines that could occur and both seem to be lining up in sort of way or another. From what I can see, others has one big wave remaining, and it’s the one you don’t want to miss
The Indicators
Fibonacci retracement
I have placed a potential take profit zone from the 1.272 to the 1.618 levels and anywhere in between. I have added an up trending channel that OTHERS would have to hold to stay somewhat relevant or then could be susceptible to adjustment.
2.RSI
I have measured the first breakout of the RSI from the 2015-17 and 2019-21 bull runs along with this one so far. The one more relevant to us is 2015-17 as this is the cycle we are more closely following. There seems to be a recurring trend of 90 plus bars before a top to OTHERS. One more thing that really stands out to me in the RSI this the first time it has shown a very strong bearish divergence. normally it seems to maintain or gain strength. right to the very end. time will reveal the real issue here.
3. ISO
The average sentiment oscillator to also show very consistent data for us. I have two measurements. The one points to late July and the the other late October. To me this could be the potential ALT-season time frame from July as it fizzles in the October time frame.
My suggestion to you is follow what you have been taught so far, do not get greedy, take profits when they are there and trust your game plan and stick to it. ALT- SEASON can you a lot of money, or lose you a lot of money. By design, its there to take any profits you have may have, or catch any late coming stragglers. Don’t get caught up in the hoopla.
Once again, I ask you for you input, I really want to hear from you.
Check my bio for more links and information
Kind regards,
WeAreSat0shi

HolderStat┆XRPUSD held the supportBINANCE:XRPUSDT on the 16h chart is showing strength above $2.05 after breaking out from consolidation. The path is clear toward $2.30 and $2.60 as buyers regain control. The bullish pattern sequence continues to develop.

TOTAL2, TOTAL MARKET CUP without BTCTOTAL2, TOTAL MARKET CUP without BTC
Reasonable targets are within the yellow zone — these are high-probability levels based on current price action, volume, and market structure. They offer the best risk/reward and are ideal for primary take-profit planning.
Targets outside the yellow zone are still possible but come with higher risk. They typically require extended time, increased volatility, or external catalysts. These should be treated as secondary or speculative targets, best approached with reduced size or active trade management.
Summary:
Yellow zone = high probability, balanced risk/reward.
Beyond yellow = lower probability, higher risk, use with caution.
