Altcoinsvsbtc

Bitcoin Dominance (Potential Alts Upside Continuation)If we assume the whole move up was an impulsive 5 wave structure; the dominance is now currently under the .236 Fibonacci level and the .382 may be next. I have (roughly) taken the height of the bearish descending triangle that broke down and cloned it for a breakdown target. This would also line up with the .382 level.
Here I am using the weekly candles. Although the current candle has not yet closed, a massive wick to the upside also retested the breakdown area of the descending triangle above it.
Providing this weekly candle closes under this .236 level a bullish continuation for altcoins would be expected!

Bitcoin Back Above Key Level With Positive Momentum If you've tracked our updates the past couple days you can see a glimpse of how quickly and easily market sentiment can change based on manual technical analysis.
Earlier today we said "Bitcoin Beyond Hope? 3% Drop At Hand". Here's the chart:
As of right now, price sentiment has reversed and we're back above resistance.
What a big consumption of time. And all for just a couple of percentage points either way up or down. But of course the opportunities and risks are larger. A drop could turn 3% into 30% and you miss it. Or a sudden price rally could turn 3% gain into a 30% climb. So we have to pay close attention... or do we?
SparksterSignals can help with algo-assisted signaling including fully backtested strategies (with clear performance metrics).
Check out our link below.
As of right now, sure enough, price action is reaching above the same horizontal level we've been watching since yesterday. This may indicate strong enough market sentiment that no further drop will happen.
If price climbs back into the yellow shaded region as shown, there's a good chance that panic stations are over and traders will be looking for new long positions.
We advise caution until momentum indicators reset on longer time-frames. We also advise making use of our algo-assisted signal and backtesting system.
Note: SparksterSignals (including our technical analysis and our algorithmic backtested signals) are not provided as financial advice.

BANDUSDT potential breakout gain of 70% gainBANDUSDT in an upside continuation structure after a massive run to the upside.
Comment, LIKE and Follow


Weekly Bullish Bat on BAT/ETHLast year i posted a bullish butterfly on BAT/ETH and it very much outperformed our targets it was great. The butterfly was mostly only visible on the 4hr and a bit on the daily.
Well now it seems that the price actin we got out of that has given us a nice much bigger visible on the WEEKLY Bullish BAT pattern
With buy targets between 0.00098795 and 0.00092667 ETH
gl everyone! lets see if we can get another huge winner out of BAT from this one ;p

CELER NETWORK WAITING FOR A PULL BACK FURTHER TO ENTER LONGI think this one is setting up for a nice upwards movement and would like a further drop into my buy zone which is confluent with the Monthly level and the golden pocket retracement of the big move up.
Will we get there? I don't know but if we do I will be looking to go long.

xrpHello,
Looks like XRP is going to consolidate for a little while and try to break through these next critical levels. the high vol nodes are up to .38c and then the smaller node is .51c after that it is pretty much open air and XRP bears will get slaughtered.

BTC- Target $13,030.36Bitcoin has broken out yet again! I will expect a test of previous highs of 13k back in 2019. If Bitcoin can break these levels, and find support, my next target will be 33k.
This is not financial advice. Just my opinion.

BTC/USD The Forgotten Triangular Pattern I am sure everyone knows BTC is about to make a huge move. From May till June even on the current moment BTC/USD is moving very slow and getting less and less volatile. BTC halving is already over is and is going to moon right? 24k here we come!!
Here is a warning!!
BTC is still within a strong triangle pattern, and still, in a strong downward pattern market, you can see in the chart I made the triangle pattern started to form at the end of 2017 and yet to be broken. I ain't optimistic about BTC/USD could break the triangle in short-team (now and in the near months).
Zoom in and looking at the 1D Chart:
BTC has attempted to break 10k area and hasn't succeeded yet, the 10k area remains as the strong resistance before BTC Moon. And I am really pessimistic about BTC's ability to break it now.
Here my reason; From the RSI the bear in on a steady pace controlling the market, as the RSI keeps on decreasing the bear get stronger, which only makes BTC weaker to break the 10k resistance. Also, capital seems to get out from BTC, less $$$ in more $$$ out, in other word market are not interested in buying BTC anymore, and selling it. Just take a look at the BTC Dominance Chart.
Hence I suggest keeping an eye out for the Altcoins market, Altcoins season seems to be nearing, and start to build short setup for BTC.
The last question from me, Are we now on a consolidation phase for an upward trend or we had reached the exhaustion point of the upward trend?
Share your answer with me on the comment section below, and like the post for more upcoming analysis for BTC or Altcoins.

NEO/USD: Multiple Levels of AnalysisNEO/USD was requested by my good friend GBU Professor Wally. I apologize I was not quick enough to respond to his Super Chat on Friday afternoon.
I quite like NEO in this area. On the Weekly Timeframe, we are consolidating following a downtrend and now a long period of sideways and volatile ranging. I identify the current formation as a Rectangle Bottom, which I have a high hit rate with in my discretionary trading. Once our weekly resistance level is broken (weekly close above) it will also flip the weekly SuperTrend bullish. I have marked out our measured weekly profit targets.
On the Daily, we are receiving a potential PTP Daily Swing Long Signal. The actual signal would have been generated on yesterday's candle, however we were above the Qualifying Line generated by our Donchian Base Line. Now we have a potential RBB buy in opportunity and price is within our Buy Zone. Good R/R on this setup.
On the hourly, we can see a potential market bottom being signaled. ICYS Bot has generated a buy signal in addition to Vix Fix signaling a high volume potential bottom.
Trade safely and position size wisely, 2% risk is recommended.

Good fundamentals Icon has good fundamental news, the team will release the new update to mainnet on 27 july 2020 ..
On the technical analysis, Icon is now retesting the 38.2% fibo level resistance and it's highly probable that it will be broken ...
Mid term:
Entry point: Between 4300 and 4500
TP1 5567 29%
TP2 6544 52%
TP3 7936 84%
TP4 9709 125%
SL 3379 21%
*Trade on your own risk and make your own analysis*
Good luck.

QTUM - ASIAN STATE PUMP STYLE BIGPump it up, we've got to?
Potential pennant break.
Can't see it stopping at least at a major previous resistance level.
Let's see!

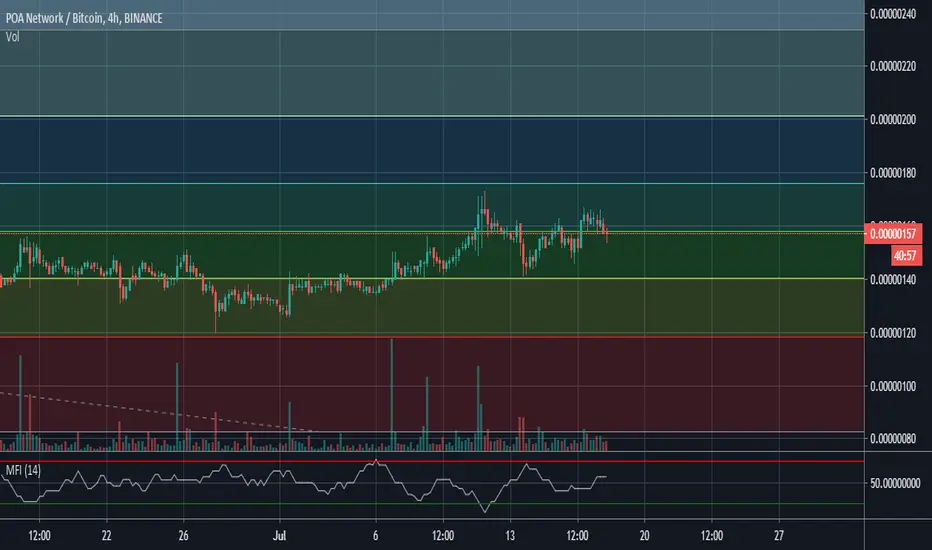
Scalping opportunity ..POA/BTC testing 50% fibo point, which is a strong support ..
We can do scalping with entry point 157
TP1: 176
TP2: 183
TP3: 199
SL: If 4H candle close under 151
Make your own analysis ...
Good luck !
btc.domguess at where btc.dom goes over the next week.
I think we see another wave of alt resurgence 20/07/2020 mostly for the meme
But also because it is current trending direction and apex decision point.


Altcoins just entered Moon Phase 2.0We're already in a risk on window and just confirmed bearish market structure AGAIN! Last time this happened was Feb. 2nd 2020, right before altcoins pumped into our spring rally.
Using the Bitcoin dominance chart as a guide for when to take risks on alts (risk on) and when to protect your sats (risk off) allows a trader to maximize opportunity and minimize risk when stacking sats via trading.
BTC dominance climbed steadily through the 2018-2019 bear market as altcoins washed out across the board and left holders heavily underwater. As ETHBTC emerges from its current consolidation and Bitcoin continues to range. Expect to see altcoins perform very well vs. Bitcoin.
Watching this chart for signs of bullish divergence and/or bullish market structure will give a trader an idea of when this "risk on" trend is drawing to a close and allow them to hold onto the BTC gains they made during the altcoin rally, instead of giving it all back in hopes of catching another wave.
Even when trading alts vs. BTC in this risk on window. We never take more than 5% risk on any trade and because we know that altcoins are correlated, we understand the implications of taking multiple 1-2% risk positions, in the event that BTC volatility picks up (which seems more likely with each passing week). Stacking up that risk can have catastrophic effects on a trade account, so we always proceed from a "manage risk first" perspective.
With that said. There are a ton of juicy looking altcoin charts out there and we'll be publishing some of the charts that were discussed on "Hxro Labs LIVE" this morning.
Always play from a position of strength!

Ziliqa at risk of 40% drop reveals new weekly candleThe weekly candle close was brutal.
After an indecision candle 2 weeks ago which pierced resistance and then closed below...
...then last weeks candle a steep red...
...and MACD trending down...
...given the meteoric rise we've seen in ZILUSD the past few months...
...it makes sense that Ziliqa may have to drop all the way down to find support, perhaps at the 0.011 level. A 40% drop from current price.
This is more likely to happen if BTCUSD does not somehow manage to quickly break it's consolidation range to move upwards, which as usual would probably bring the rest of the market up with it, including Zil.
Bottom line, traders are likely to be taking profit and looking for a cheaper entry position on Zil.

ETHBeen thinking this is more likely with a double bottom in $BTC $92 ETH makes a little more, mega bear moon shot still $67.

Bitcoin Dominance Quarterly ReviewUsing a Heiken Ashi chart type we can see a typical topping out pattern for BTC dominance. This suggests a decline in dominance ready to begin, although playing devil's advocate perhaps it's just a consolidation pattern against the downtrend waiting to be broken to the upside.
SparksterSignals team is betting on the altcoin market continuing to perform admirably over the course of the summer and beyond so we do expect money to flood into the altcoins as innovative projects gain partnerships outside of the crypto industry and utility builds towards the digital economy.
That is to say, we think bitcoin dominance will head down over the next few months.
Check out the short-term moving averages (light yellow and blue) which has just crossed over to the downside.
We also see the monthly Heiken Ashi candle as of today, 1st July, is painting red.

Monthly Close for Chainlink after Volume Fell To All Time Lows Does three months of trailing volume indicate no interest, or traders waiting ready to pounce on positions as soon as LINKUSD finds support at the ATH level?
The first week of July may reveal which way LINK is going for the rest of this month.

ETHI think alt coins r cooked well done at this point, and a larger correction is due. Same as the stock markets. But I think the crypto markets will go full blown risk off way b4 stocks and we could see the crypto space front run the pending stock crash.
