Altcoinsvsbtc

XRPBTC ripe for breakout: but to which side?It's time for ripple again !
And I'm kinda on a roll today, no idea why, but I just can't stop with this sh*t lol.
So, XRP is the only altcoin that hasn't yet risen much since BTC made the last low and started rising now.
In fact, XRP seems absolutely unimpressed and the price didn't change much.
We must therefore look at XRPBTC to understand why.
XRPBTC is interesing: 95% of the time it keeps just going down down down, and then suddenly, around the bitcoin top, insane spikes !
We could see something similar happen as the last time.
There is a large triangle within a falling wedge structure in 2015-17.
Right now, a new big triangle has formed which will soon end.
If XRPBTC breaks to the downside, we might see something very similar happen as in 2015-17.
If it breaks sooner to the upside, the idea is invalidated. I see slightly more potential for a sooner break to the upside because stoch RSI is massively oversold on weekly.
Apart from the shorter term behavior, I think XRPBTC can easily reach the peak values again in the next 2-3 years. If BTC is at 100k in 2021, XRPUSD could go as high as 25-35 USD. Nice indeed!
Anyway, I'll continue to closely monitor our friend XRP here, because for me, this coin promises an interestingly high potential ROI (x100 possible imho)
Please don't start with cebtralized scamcoin blablabla, I don't really care about the features of coins any more. They can also be called coin A, coin B or coin C, I see them
as really interesting leverage instruments, not much more. The one true coin always remains bitcoin for me. However, I also want to use these lesser coins to make some nice gains,
nothing wrong with that, hehe. And for me, XRP currently has the highest potential.
That's it, and now I really stop for today XD

Bitcoin still bullish: ascending triangle in 4h chartMost think of a 2015 fractal repeat, but I have turned from short-term bear to full bull since the massive MA200 break and weekly candle close above it.
I think BTC will go in this push at least to 6500 (lower limit), but as high as 7500 is indeed possible, before any major correction.
We see a nice slow ascending triangle in the 4h chart.
All indicators point also towards the upside, daily stoch RSI now on oversold again.
BTC wants this strong push imho.
Let's see :)


Breaking The Trend?Are we breaking the downtrend? As far as I'm concerned we have two trends to break: the one with steeper angle and another with more gentle angle. As you can see we can predict the timing of breakouts very accurately with straight lines. This graph shows that we have broke out of steeper angle trend and poked little bit of gentler one. In my book we need to haven't quite broke out of the downtrend yet. We sit on the 2017 September resistance levels which turned support in October. For that to happen we needed quite aggressive push to 6000+ and the rest is history. I'm waiting this to happen, but meanwhile I want to show you this portfolio management tool. You can see inverse correlation against other altcoins so it makes trading easier when you can track which coins are on downtrend and which are going up. It works in all time frames so it's valuable tool when it comes to trend analysis. Does not work in Binance, because apparently we TV doesn't have Binance support for this just yet. I'm working on making it support all coins. These are random coins to play with.


Vertcoin UPDATE: Pump Incoming?Decision time in 1 Week or LESS...
Expecting some fireworks!
Congratulations to those of you who are still active in this space.
You have earned what is coming next.

Vertcoin (VTC/BTC)PLEASE YOU PIECE OF GARBAGE JUST DO IT ALREADY
YOURE WORSE THAN FREAKING BITCONNECT BRO


BTC looks compelling, Alt Season 2019 is about to begin!Well we can see price has broken out from the symmetrical triangle and we are just waiting for the 4H candle close above to confirm the breakout. I have a fully bullish bias at the moment, strong bullish signals throughout the market!
FirstClass Crypto VIP members went long at 3535 catching to low wicks and rode this all the way to the top of the triangle. To summarize on the past data we can see the bears could not get a 4H candle to close below the original 0.618, few wicks below but eaten right up, shortly after we can see a small break up from the bull flag / falling wedge but the bears jumped into combat and stopped this move short. Once price came back down, again tested the 0.618, held support and started to rise I knew we had this one in the bag. The fact BTC price has broken above this symmetrical triangle and will soon close the current 4H candle above is extremely bullish IMO. Not only is this recent move alarming but check out the Alt Coin Market Cap chart posted below.... looks to me Alt season 2019 is about to break out! Remember... you heard it from me first! Because the Altcoin Market Cap chart is not from Tradingview you will need to click the link below to view this chart.
FirstClass Crypto
Telegram ~ @FirstclassEra
Discord ~ @FirstClassEra
discord.gg

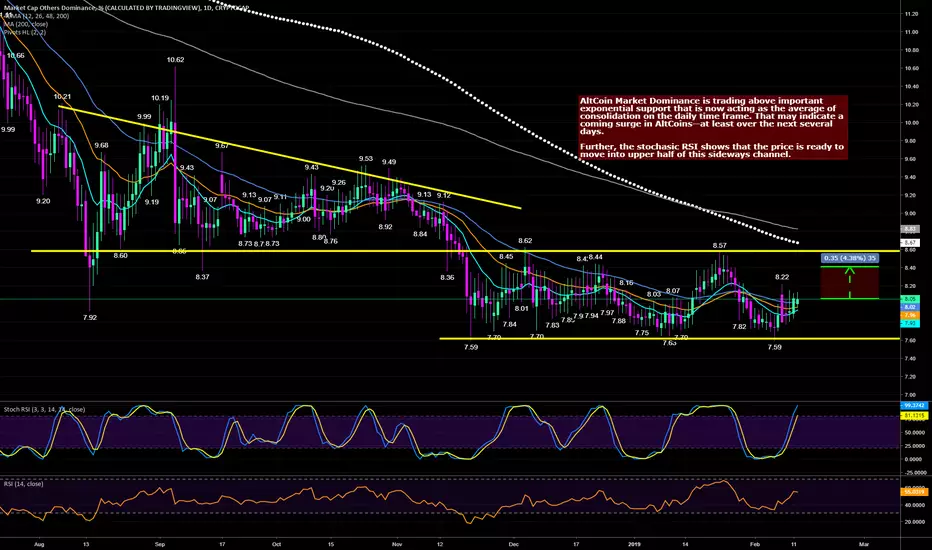
AltCoin Dominance Back-Testing EMA Support Before Next MoveAltCoin Market Dominance is trading above important exponential support that is now acting as the average of consolidation on the daily time frame. That may indicate a coming surge in AltCoins--at least over the next several days.
Further, the stochasic RSI shows that the price is ready to move into upper half of this sideways channel.
AltCoin MarketCap Overdue to Break the 12 Week EMA--Bull Trap?Altcoin Market Cap overdue for a break of the 12 week EMA resistance. A break of this EMA would likely lead to a rejection off of the 26-week instead. This bulltrap would be in line with the historical market cycle of executing a bull trap before eventual capitulation.

WAVES WAVESBTC
Elliott Waves 12345, target min for 5th Wave - 5950 sat ~ 10-15% from now. Broke good resistance line and after test go up.

Possible bottom found for some altcoins/BTC pair!Hello guys
This is the sum of some alcoins vs BTC paired.
On this chart I just noticed that we recently hit almost lowest levels for ETHBTC, XMRBTC,LTCBTC,NEOBTC,EOSBTC,IOTBTC,XRPBTC,ETCBTC
Also I can see Wyckoff Accumulation and if this is valid in crypto we are at the bottom of this painful correction, so we might see a bull run soon and if correction is going to continue after this I would expect BTCUSD to drop faster that other Atcoin USD.
I would love to hear your thoughts about this in comments bellow.
Take care and good luck.


HyperCashHCBTC
Light coin, not so long listed on Binance. With the falling wedge pattern, oversold and has bullish divergence. Till 3% of your trading capital can go for this deal with small stop lose.

RCN : Ripio Credit Network Short Term 30% !!According to Fibbonacci Level Restesting on 0.618 Now We Can Trade For Short Term and MidTerms.
RCN/BTC
Buy 480-510
Sell on 15% & 30% Profits.
Stop Loss 445
I hope that Price can fly From Buying zone.
Share Your Opinion in Comments.
if You Satisfied With My idea Then Dont Forgot To Hit Like.
Warning- I m Not a Financial Advisor this idea Only For Educational Purpose Only.
Thank You !!

SKY/BTC, BINANCESKYBTC
Touched the good support zone into the falling wedge. Short-term moving downward near the support zone & resistance line and then go up by realization of the reversal pattern. Also have bullish divetgence by indicator.

A I O N AIONBTC
After long-term falling AION reached his ATL
and has started to accumulation in the triangle 78 days for the next cycle. Stoch RSI oversold and averages crossed , it's good signal to buy.

XRP rippleXRPBTC
See the round top, a flat stop before continuing the fall.
Mid-term target 0.0000616

Nano showing bullish signs SFP formation observed on the daily, will be looking to long any retrace down to the open/close of previous daily candle and stop beneath the swing low wick. Targeting the clear S/R level marked in red.
Idea by Pheneck

Nano/BTC showing signs of bullishnessSFP formation observed on the daily, will be looking to long any retrace down to the open/close of previous daily candle and stop beneath the swing low wick. Targeting the clear S/R level marked in red
