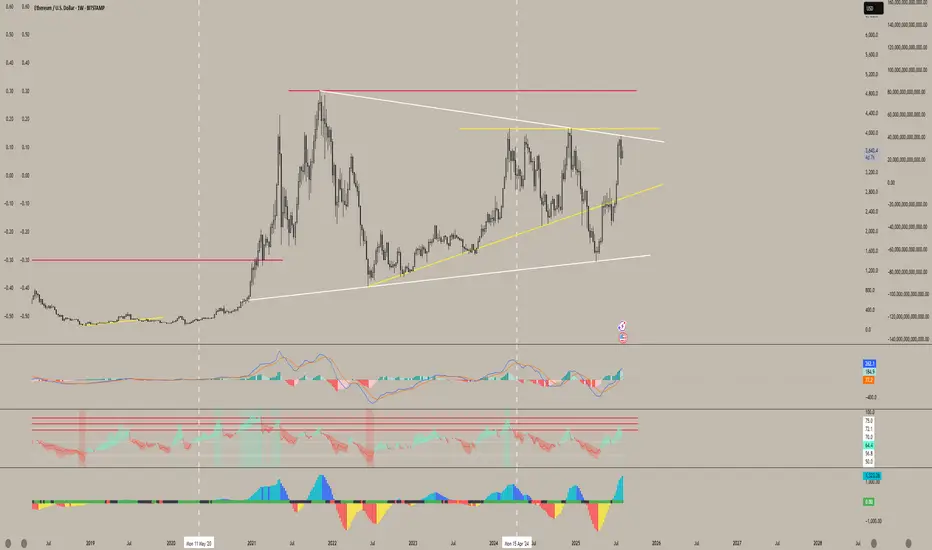
ETH | NEW ATH or DUMP ?Ethereum recently peaked at $3900. And allthough this is not a new ATH (close by a few hundred dollars), it is a local high for the year.
My last update was on an inverse Head and Shoulders pattern on ETH, which has since increased over 50%:
(The original idea here:)
The question now, is what's next for ETH - further increase, or are the increases over for the near term and is a correction more likely?
I'm going to say that the increases for ETH are over for now. This is because we correction is most definitely due after such a large increase in a fairly short timeframe. I'm not saying we're heading into a full out bearish cycle, but a 20-25% correction would be most normal at this point.
Additionally, XRP has also made it's peak and lost the high, now trading just under $3. This is a strong sign that the alts have likely already rallied, since XRP used to be the last to increase (if it increased at all, historically. (Thanks Jedd).
I was very lucky to call that top here:
Either way, buyers may use this correction to scoop up on smaller alts over the next few weeks. This ultimately depends on whether the market has ONE MORE pump, and if the correction will bounce back from a 20-25% pullback.
_________________
BINANCE:ETHUSDT
ALTS

Can SUI end the year at over $10?Sounds wild sitting here in August.
But those are the type pf moves possible on a new cycle blockchain entering the last parabolic run of the 4 year cycle.
Now we are still unsure when this cycle will end?
Q4 of 2025 or does extend April/May of 2026.
Either way SUI has potential of compressed price action, waiting for #ETH to break above $4100 is probably going to be the trigger that starts the party.

ETH is knocking like Walter White on that $4K levelOnce we break past this point, there’s little to no resistance-we should all be expecting an all-time high. Altcoins are going to melt people’s faces off when we break past $4K. With rate cuts anticipated, don’t miss out on this move.
ETH is holding extremely strong right now in relation to BTC, while other altcoins are still seeking their lows for this cycle. With rate cuts expected in September, ETF flows, and growing institutional interest, I believe ETH will have a crazy rally.
Once we break past this resistance from the trendline dating back to the 2021 high and close above $4K, I think we’ll start to see ETH blow past Bitcoin-and altcoins will follow.
I still believe ETH will outperform others for now, but once we get those rate cuts, I feel the bleeding will stop-and by then, the ship will have sailed.
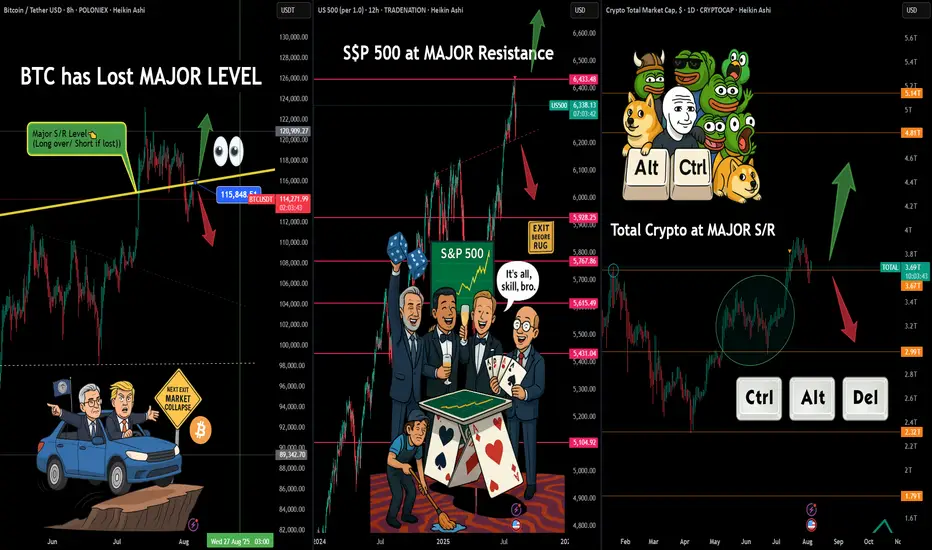
Alt-Season or Alt-Control-Delete.?🤖💣 Alt-Season or Alt-Control-Delete.? 🧠📉
The market looks like it's a bout to rug someone... and it might just be Trump.
While President Trump narrows down his Fed Chair shortlist, the real driver — Powell — is still at the wheel. But the car? It's swerving dangerously near the edge. BTC has lost a key S/R level, the S&P 500 is at major resistance, and Total Crypto Market Cap is stalling at a crucial decision point.
Despite the hype around altcoins and "recovery rallies," I’m deeply cautious. JP Morgan and Bank of America stocks might dip after Trump’s public accusations — signaling that institutions might already be repositioning. Capital tends to exit before the narrative shifts... and that shift could be incoming.
The chart says it best:
👀 BTC beneath S/R
🎲 S&P 500 gamblers partying at resistance
🧠 Meme coin mania while total crypto hits S/R
🧨 Trump’s signaling right, but Powell might yank the wheel left...
This could all be the calm before a liquidity flush.
Stay sharp, don’t follow the crowd — follow the capital.
That said , Bitcoin remains my favorite asset — especially in times of systemic risk. Remember what history shows us: when banks stumble or go bust, Bitcoin tends to rise. If there's one asset in the world I want to carry through a storm, it's Bitcoin. The decentralized antidote to centralized chaos.
One Love,
The FX PROFESSOR 💙
ps. we might see a breakout and Fomo for good reasons...why not? but for now my charts are screaming: CAREFUL!
Disclosure: I am happy to be part of the Trade Nation's Influencer program and receive a monthly fee for using their TradingView charts in my analysis. Awesome broker, where the trader really comes first! 🌟🤝📈
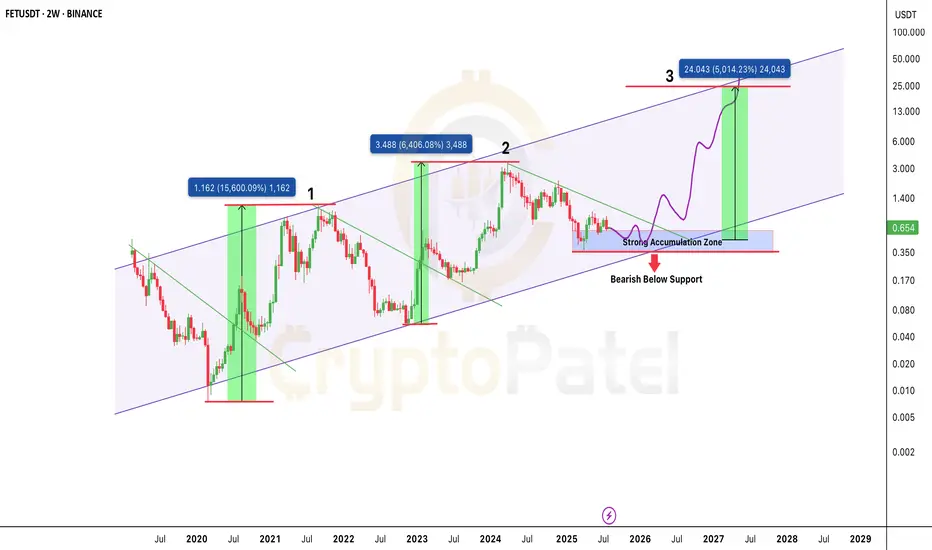
$FET is back in the zone that sparked 15,000%+ rallies?NYSE:FET is back in the zone that sparked 15,000%+ rallies. Same setup. 50x incoming?
FET continues to respect its multi-year ascending channel structure, active since 2020.
Price Action History:
🔹 Wave 1 (2020–2021): +15,600% rally from channel support to resistance
🔹 Wave 2 (2022–2024): +6,400% move following a similar breakout pattern.
🔹 Current Cycle (2025): Price is consolidating in the same accumulation range of $0.35–$0.65.
Key Demand Zone: $0.35–$0.65
Upside Target: ~$24.00 (5,000%+ potential)
🔻 Breakdown Level: Below $0.35 = Structure invalidation
Structure Insight:
Each macro move begins with:
🔹 Accumulation at channel support
🔹 Break of falling trendline
🔹 Aggressive expansion toward the upper boundary
The projected Wave 3 follows this same path if demand zone holds. The structure remains bullish as long as price stays above $0.35.
FET is trading at a high probability accumulation level within a valid macro trend. If history repeats, this could be the next major leg up.
✅ Favor long accumulation strategies
❌ Exit plan needed below $0.35
NFa & DYOR
Altcoins Recovering: TOTAL3 Bounces from Key Support ZoneIn my previous analysis on TOTAL3, I mentioned that I'm working with two possible bullish scenarios for altcoins. It now seems we're firmly in Scenario #2.
📉 The price dropped exactly into the highlighted support zone, then yesterday we saw a clean recovery and reversal starting right from that area — a textbook technical reaction.
📈 At the time of writing, TOTAL3 sits at $986B, and a break above the $995B–$1T resistance could trigger a new leg up for altcoins.
🎯 Short- and mid-term targets remain:
• $1.08T (recent top)
• $1.15T
• Potential for new all-time highs if momentum builds
✅ As long as price holds above the $920–$930B support zone, bulls remain in control. This keeps the door open for selective altcoin entries — ideally, projects with real structure, strong tokenomics, and clear momentum.

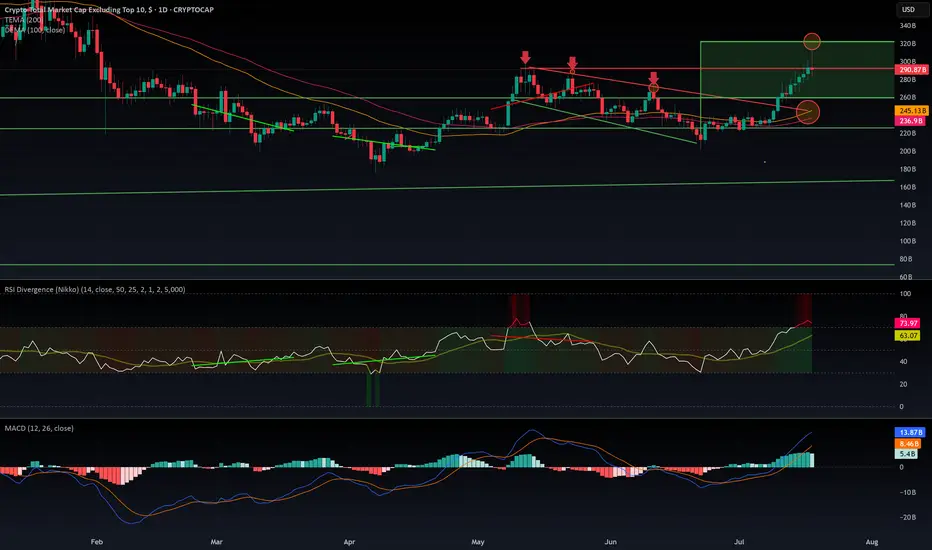
$OTHERS rejected from $320 B resistance. What is next?CRYPTOCAP:OTHERS Rejected at $320B: Is the Altseason on Pause?
CRYPTOCAP:OTHERS just got rejected at the $320B resistance after a decent pump — the kind that usually signals the start of an altseason. But if we dig into the indicators, warning signs are flashing:
- MACD is sitting in overbought territory.
- RSI is heavily extended, signaling potential exhaustion.
- EMA 100 & 200 are colliding with the top of a previous downtrend channel — a zone that historically acted as strong resistance.
The rejection was sharp. So what's next? Are we entering a range between $320B and $260B? It's quite possible. The aIf you wantltcoin market now sits at a decision point: either it keeps pushing higher or takes a breather — potentially pausing the rally until September.
Historically, August is a slow month in the West. People go on vacation, volumes drop, and markets tend to cool off. This seasonal pattern supports the idea of a consolidation phase before a stronger second leg of altseason kicks off in mid-September and carries into Q4.
I’m not posting too many ideas lately because the market landscape has changed. The new players aren’t just trading — they’re manipulating flows with massive capital to hunt retail liquidity.
They’re also using far more sophisticated tools than our classic MACD and RSI — including AI-powered indicators and multi-layered analytics that are beyond retail reach.
In this new environment, predictions are harder and risk is higher.
🧠 Do Your Own Research (DYOR), stay sharp, and don’t blindly trust social influencers.
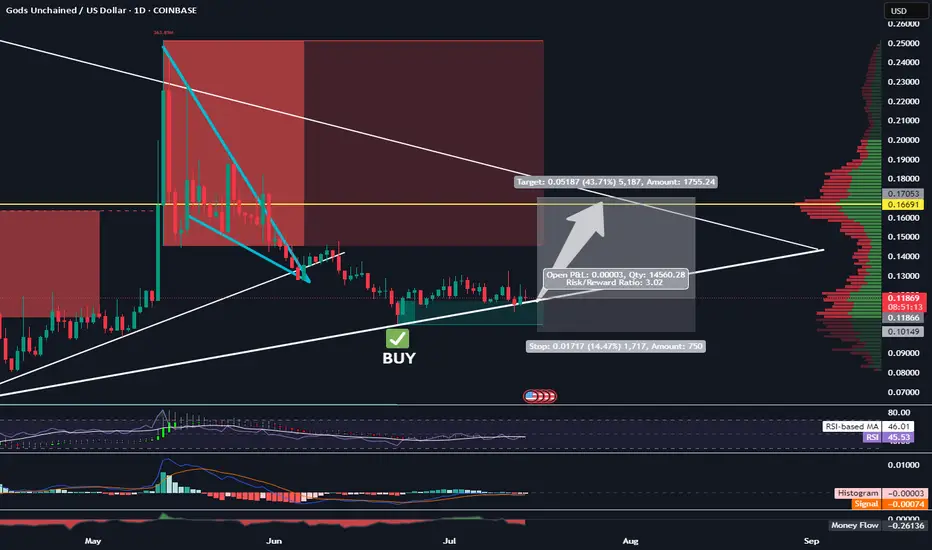
Long GODS - Target 17 Cents - 1:3 RRRTrading Fam,
As I continue to gain experience with my AI-created indicator, I am learning to remain patient and wait for the perfect setups. We have one here on GODS. You can see that we've returned to the bottom of a larger triangle and are using it as support. Additionally, we are within a favorable liquidity block where buyers tend to accelerate the volume. My indicator gave the BUY signal 2 weeks ago, and there has been plenty of sideways accumulation since the signal flashed. Probability suggest that GODS will pump soon.
I'll be targeting 17 cents with a SL at 10 for a 1:3 RRR.
Let's go!
Stew
PHA Main trend since 2020. Hype Web3 AI 07 2025Cryptocurrency as an example. This applies to all similar assets by liquidity. Logarithm main trend. Time frame 1 week (smaller time frame, to understand the shown and described, is not necessary). Cryptocurrency is an imitation of utility with a good legend, which is traded on liquid exchanges (in the decline phase in the next cycle) most likely there will be delists, if they do not make a “restart” (rebranding). A big plus in the crypto legend of this project is that it is mentioned as the basis of the legend of Web3 and AI.
What is it. Phala Network is an execution layer for Web3 AI. By allowing AI to understand blockchains and interact with them, it removes the barrier for the first billion users joining Web3.
Phala Network's multi-security system is a solution to the problem of AI execution. Based on Phala Network, you can easily create hack-proof and unstoppable AI agents tightly integrated with on-chain smart contracts using AI-Agent Contract.
Agentize smart contracts: create AI agents for smart contracts using natural and programming languages.
End of participation phase. Created a project at the end of the participation phase in 2020 09 before entering the distribution zone of the last cycle with the highs of 2021.
Market distribution . Then, under the hype of alts, very aggressive convincing marketing and pumping over +1500%. Long distribution (more than 9 months) with price retention at a huge profit and publication of convincing fairy tales-news for “pouring” fresh fuel (mass pipel) through info wires in the market distribution zone of 2021.
Phase of decline to the recruitment zone. (partial change of hands, those who created, they do not need it). Phase of decline from the sales zone (advertisement is good), to the purchase zone (no advertising, no activity) -93%. That is, the “fresh fuel” money of investors turned into “dust” on the spot (conditionally $ 1000 of super promising next "shit", in $ 50-100), on futures still in the distribution zone “disappeared”.
Phase of accumulation (use of many short alt seasons to shake the price and “shake out”). Upon reaching the recruitment zone, — reverse. They made a reversal, pump-buyout of liquidity (their heavy orders) by a large % (+580%), which served as the starting points for the formation of the horizontal pump / dump channel range, that is, conditional accumulation.
Now another wedge is being formed locally in the horizontal channel — its breakthrough, the beginning of the pumping and another altseason, which can develop into the participation phase.
It is worth noting that they can enter the long stop loss and long liquidation zone when forming a wedge (this often happens). Take this into account in your money management in advance. Accept risks, or distribute entry money when implementing force majeure in advance, even if you do not lie that this is possible. The capitulation phase (part of accumulation, liquidity collection), that is, “dumping passengers” and the final liquidation of their faith, does not always happen, which is logical.
On weak assets (very old, low liquidity), outright scams that have "outlived their usefulness", the capitulation phase sometimes ends in a complete scam.
Alt-seasons of accumulation and capitulation zones . During this time, there were 3 average alt seasons, which naturally affected the price of this cryptocurrency (3 pumping waves in the channel +580%, +300%, +650% (average gain/drop conditionally in half), price movements in the median zone of a large trend channel.
Participation phase — most likely, there will be a series of pumps with sticks under the market trend as a whole, and most importantly, the hype of everything related to AI.
Distribution phase — most likely will be shorter in time than before, and still I would exit mostly under the mirror zone of the previous distribution, as the project is “old”, the hype "the chart remembers the deceived investors". Then two options, the development of the paths of which depends on the market as a whole, and not on this candy wrapper.
a) Consolidation and exit from it to the second zone of the final distribution ("the hamster is not scared", "it will grow forever").
b) Transition to the decline phase, then the fading of marketing, the final loss of liquidity (supporting the project with money), and a gradual (delists, regulation, norms) or sharp scam (hacking, etc.).
It does not matter which path we take in the distribution phase, the final path, like everything similar created under the hype, is the loss of liquidity, oblivion and scam. Therefore, do not forget to sell such (99.999% of the crypto market) at high prices, despite the positive news deception creeping into the mind through the ears and eyes.
Rebranding. Restart. Resetting price charts. If they do it like EOS and similar "old" scams — rebranding (preparing for a new market hype in advance), and remove all charts from exchanges, so that for the new market hype as a whole, the project would be “fresh” according to the chart, new, that is, the previous scam of "few experienced investors" would not be visible, then pumping up more than +1000% is possible, but this is irrational... As you need to spend a lot of money, it is easier to create a new imitation of something useful...
The market phases are clearly visible on the chart. I also described everything in detail.

ETH Breakout and potential bullishness expected for a monthETH has broken out from downtrend and market sentiment has turned bullish overall. So it is expected to go up until it reaches 4000$ (70%) where a long term resistance is found.
Any further bullishness post 4000$ depends on future market conditions and price action at that point of time, as it is a long term resistance which would be more difficult to break.
Fibonacci retracement is used to find potential temporary selloffs in this up move. This move could potentially end the medium term bearish sentiments in ALT Coins.
Note: For educational purposes only. DYOR before investing or trading.

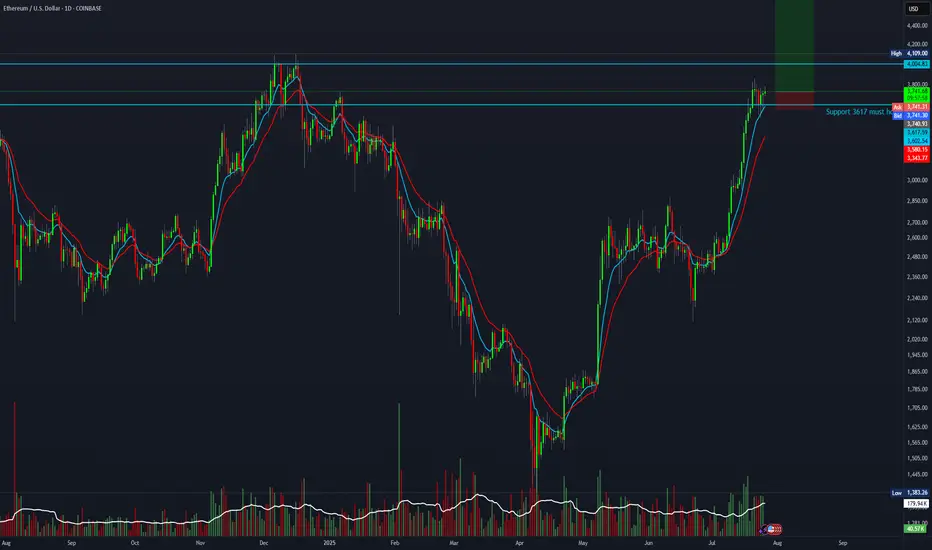
20:1 R:R setup for Ethereum.The train is about to leave the station if BTC breaks above 120K. This setup offers a favorable risk for a 20:1 R:R.
Entry: 3,750
Stop-loss: 3,580
Target: 7,000
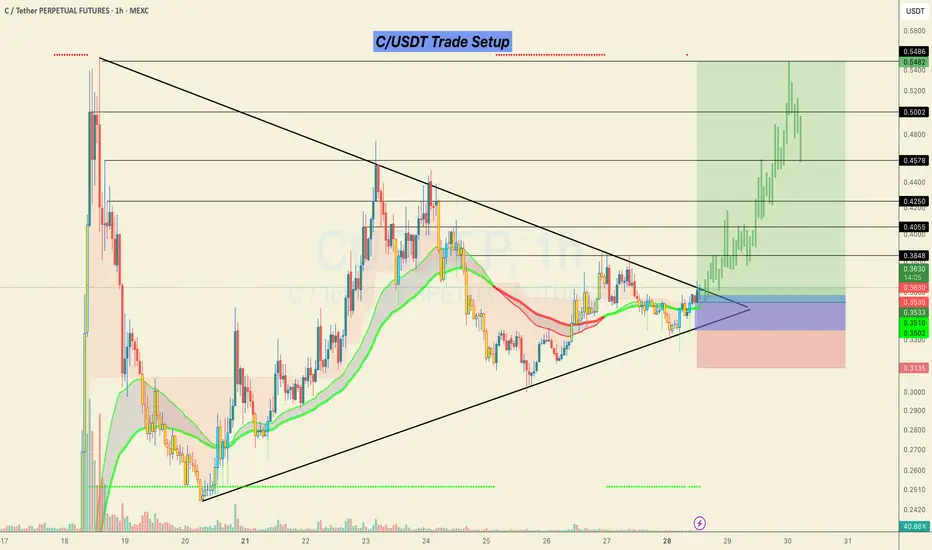
#C/USDT Looks ready for a 50% bullish move.C/USDT Trade Setup 📉
Currently forming a strong breakout structure after a long consolidation inside the triangle.
📌 Accumulation Zone:
0.3350 – 0.3580
🎯 Targets (Black Horizontal Levels):
0.4055
0.4250
0.4578
0.5002
0.5486
🛑 SL: Below 0.3135 (previous structural low)
Price broke out with solid momentum and retested the breakout zone. As long as we hold above the EMAs and the structure remains intact, continuation toward higher levels is likely.
This is a low-risk, high-reward setup as long as the risk is managed properly.
> Not financial advice. Trade at your own risk.
Do hit the like button if you want me to post more of these setups here.
Thank you
#PEACE
ALTUSDT Forming Bullish ReversalALTUSDT is currently displaying a bullish reversal pattern that may mark the beginning of a significant trend change. After a prolonged period of downward or sideways movement, the asset has shown signs of accumulation, with increasing volume and a shift in price structure. This type of reversal formation typically signals that buyers are stepping back into the market with strength, aiming to reclaim lost levels and push higher.
Technically, the chart structure supports a strong recovery potential, as the price is attempting to break out of a consolidation zone with solid momentum. The bullish reversal pattern suggests that sellers have likely exhausted their control, and a trend shift is underway. With increasing interest and engagement around the ALT project, both technically and sentimentally, a price surge in the range of 90% to 100% becomes a realistic expectation.
From a market sentiment perspective, ALT is regaining attention from crypto traders due to recent development updates and growing adoption potential in its ecosystem. Investors are beginning to identify ALT as a sleeper altcoin that may deliver above-average returns once the reversal is confirmed. This momentum is backed by improved volume and clear buying pressure on critical support levels.
A confirmed breakout above resistance, with sustained volume, could act as the catalyst for a parabolic move. Traders should monitor this setup closely, as it may offer one of the best reward-to-risk ratios in the current market cycle. ALTUSDT could be setting up for a major rally in the coming days or weeks.
✅ Show your support by hitting the like button and
✅ Leaving a comment below! (What is You opinion about this Coin)
Your feedback and engagement keep me inspired to share more insightful market analysis with you!

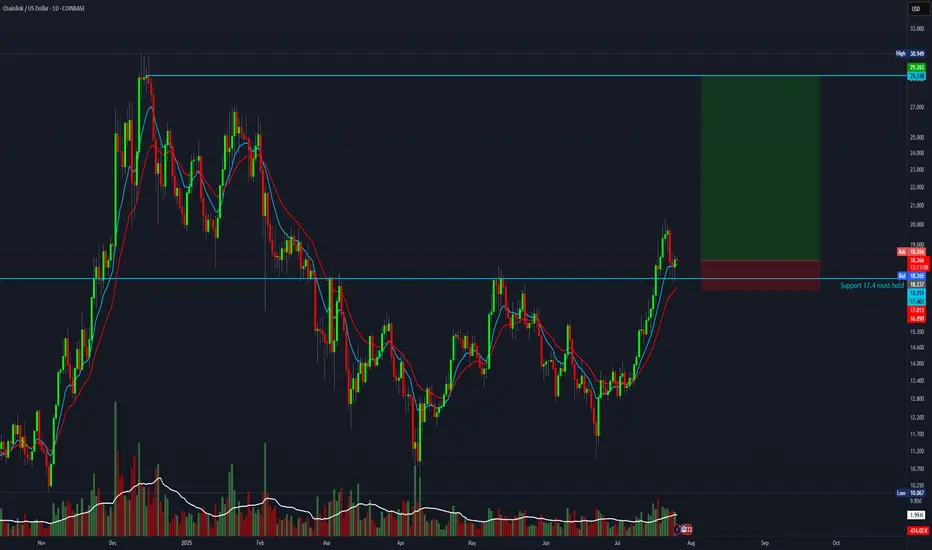
8 R setup for ChainlinkBTC is about to flip upwards. This is the chance to take a high-reward trade with an 8:1 risk-to-reward ratio.
Entry: 18.23
Stop-loss: 16.8
Target: 29
2025 BTC.D to %44 then retrace to %56 - 2026 real Altseasonthe drop in bitcoin dominance from now till end on August to %44 will send some Alts 5 to 10 X then all the market will dump till the end of the year and the dump will be brutal
Brutal means : bitcoin down %65 and altcoins %90 from the upcoming August mini Altseason run. which actually Alts prices will be cheaper than now ( today )
eventually BTC.D going down to %20
Not a financial advice

Now We WaitTrading Fam,
In my last video, I mentioned how I had been learning to trade more patiently, giving myself those high-quality, high-probability winning trades. This is a perfect time to illustrate that strategy.
With our altcoin market overheated, I am expecting more rest, accumulation, and pullback in many of our alts. The selection of even decent entries is very slim. It's time for us to sit back, wait, and let the trades come to us again.
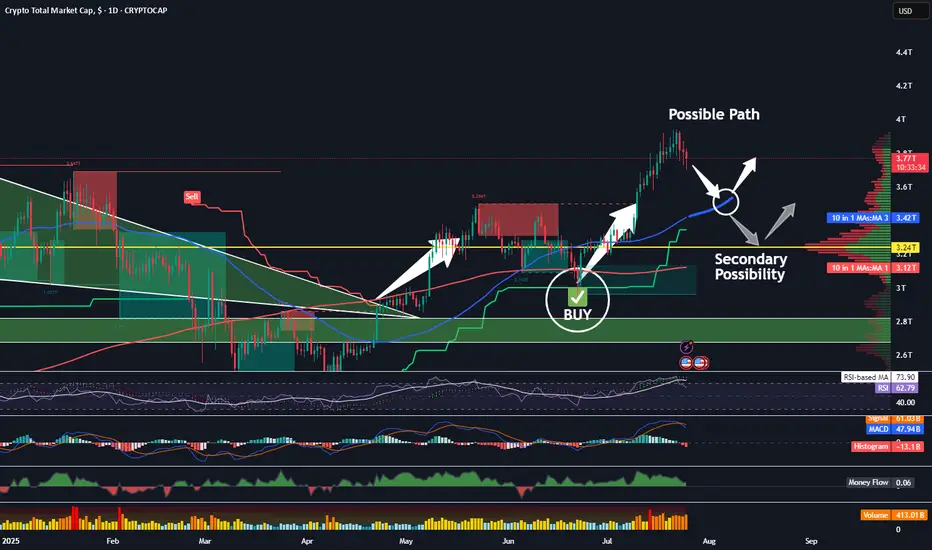
The TOTAL chart shows us more clearly what may occur. Let's discuss a few important indicators on this chart.
First of all, we see my indicator popped a BUY signal right around 3T. We had a safe bet at that point; we were going to see quite a bit of buying action in the altcoin space. Indeed, we did. The altcoin market increased by about 25 percent and went all the way to 4T, at which point the sellers came back in. Now, we are in the middle of a little bit of a pullback, and I think there could be more to come. I am expecting at least a touch of that rising 50-day SMA, currently at 3.4T.
Supporting my thesis here are the crossover of the RSI to the downside of its 14-day MA, the MACD cross, the Chalkin money flow decrease, and the HMV indicating high volume during these sell-offs. Leverage is being liquidated. This is healthy!
It is possible that the total market cap could drop even further, all the way down to that 3.24T PoC on the VRVP. That is where we see most of our volume in alts has occurred. Keep these two targets in mind. Once hit, I will begin looking for more trade entries once again.
✌️Stew
$AAVE Daily Hidden Bullish divergence?CRYPTOCAP:AAVE and alts begin their retracement Wednesday but is this a long term top or just local? Im betting we have a higher to go this summer..
Hidden daily bullish divergence is printing on RSI at the daily pivot and 0.5 Fibonacci retracement which should all act as strong support provided BTC doesn't dump.
The 'alt-coin golden pocket' Fibonacci retracement 0.786 sits at the descending daily 200EMA and High Volume Node support offering a secondary target for reversal and continued upside.
Losing this and closing below would flip me bearish until a new bullish signal emerges.
Safe trading.

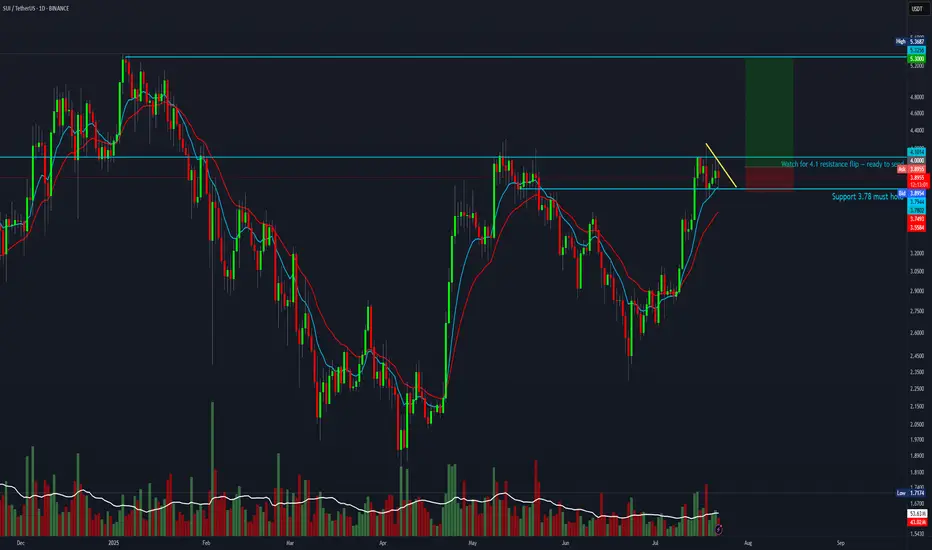
SUI 5R setup forming.SUI looks ready to move. Wait for a breakout above $4 — once it flips the $4.10 resistance, it could fully send toward ATH.
Entry: $4
Stop Loss: $3.70
Target: $5.30
Bitcoin Dominance - No Altseason yetAs long as Bitcoin Dominance is moving in the channel, there will be no AltSeason unless it shows weakness and breaks the channel downwards.

Syrup looks ready to start moving towards new ATH'sCRYPTOCAP:SYRUP has started to break out of its downtrend after revisiting the June lows. It has outperformed most of the market since April, with this month's pullback being an exception. I expect an aggressive move up into new highs. The fibs around $1 look like a good target for the short term, this would also be ~1b mc.

$BTC Will Go Up Alongside Alt SeasonSomeone posted on one of my tweets the following:
" Jonnie my bro, the only problem for me right now is that btc didnt top yet. You also talked how btc shoud top around 200k range. Alt season can only come when btc reach top"
MYTH DEBUNKED ✅
CRYPTOCAP:BTC does NOT need to top in order for Alt Season to commence.
Both can and will occur in tandem 🤝
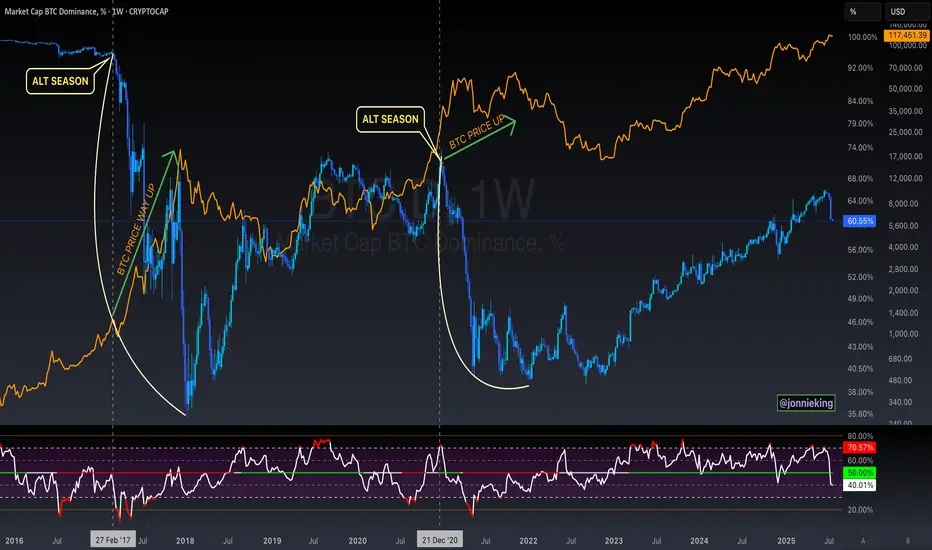
Altseason Loading?BTC Dominance chart has once again respected the long-term descending trendline resistance, showing a sharp monthly rejection. Historically, similar rejections have marked the beginning of ALT seasons, where capital flows out of Bitcoin into altcoins, boosting their performance significantly.
Chart Highlights:
-Major triangle pattern since 2017
-Clear rejections from the upper trendline coincide with previous ALT seasons (2018, 2021)
-Current rejection resembles those past cycles
-A move down in dominance could fuel strong altcoin rallies
If BTC dominance continues to decline, we could be entering another powerful altcoin season in the coming months.
Cheers
Hexa🧘♀️
CRYPTOCAP:BTC.D BINANCE:BTCUSDT

DOGE | Gearing up For a BIG MOVEDoge is looking mighty bullish after establishing a clear bottom.
Together with confirmation from BTC, we can safely say that altseason is yet ahead of us. BTC's recent increase show that the bullish impulse is still upon us. And after ETH increases, the rest of the altcoin market will follow suit as per usual.
DOGE is bullish because:
✅ Clear bottom
✅ Higher lows, daily looking to reclaim the moving averages:
✅ Altseason upon us after ETH increase
Ultimately, we need to wait for confirmation - if THIS major resistance zone is cleared (in other words if daily candles close ABOVE this zone) then we're full bull mode.
________________
BINANCE:DOGEUSDT
