#Altcoins capitulation phase.Altcoins run started after the last correction stages towards the end of February 2017, before the parabolic run in the 2016 2017 altcoins bull run.
we are here
ALTS
ARKM | CHART PATTERNS | BUY the BOTTOMARKM is a fairly new altcoin that's been on my TOP alt list for some time.
The bearish M chart pattern is a pattern that signifies a large correction, especially in the macro timeframe such as the weekly. By looking at the chart, e can see the correction is nearly over since it has almost retraced ack to opening levels - almost .
Opening levels have in fact not yet been retested, and this may be a great place to stack up / re-accumulate if you're a believer.
Another ALT that's seems to be approaching a bottom is AVAX:
______________
BINANCE:ARKMUSDT

DXY Falling Below $106 - Cue AltSeason in March!The biggest shock to everyone is going to be the price of CRYPTOCAP:BTC going DOWN while ALTS skyrocket 🚀
As I have discussed in my macro thesis, the TVC:DXY is FINALLY breaking down on the Weekly along with the 10Y.
RSI has topped and Price broke below the WMA9 & 20.
Just waiting on the WMA9 to break below the WMA20 for final confirmation.
Historically when this happens...
it’s ALTSEASON BABY!!! 🥳
After this happened in March 2017,
BTC and ALTS pumped together,
then BTC went down 33% while ALTS exploded higher over a 3 week period before BTC rallied alongside again.

Solana (SOL/USDT) Showing Bearish Signs – Further Downside 1DSolana (SOL) is currently displaying bearish price action on the charts. After failing to hold key support levels, the price has started trending downward, signaling potential further downside.
Large market participants appear to be interested in accumulating Solana at lower price levels. Current price action suggests that smart money is patiently waiting for a deeper pullback before stepping in with significant buy orders.
Potentially interesting entry points for Solana could be approaching very soon. With the current bearish price action, the market may offer attractive opportunities for buyers looking to enter at discounted levels.

total2Accompanied by feelings of hatred, the biggest #Altcoins run in history will become inevitable!

AVAX | ALTS | Possible for BOUNCE HEREAVAX hasn't yet made a glorious ATH, but on the flip side - this means that there is great potential for upside, specifically from this support zone.
If we take a look at the percentage the price has previously bounces from this particular support level, it's quite significant - although it wasn't over night. This support zone is roughly between 20-22 and may be a great place for a swing.
Make sure you check out yesterday's update on LINK; also showing promise for another impulse wave up:
__________________
BINANCE:AVAXUSDT

LINK | Wyckoff Method | Phase 3 IMPULSE WAVELINK shows a very clear Wyckoff Method Cycle from the macro timeframe:
This is typically what a Wyckoff Method cycle looks like from a macro perspective:
When we look at Chainlink from the macro and compare it to the previous cycle, it seems likely that LINK goes up in "impulse waves". We now have Wave 3 to look forward to, which may likely play out over a few months - as did the previous cycle.
________________
COINBASE:LINKUSD

Ethereum....CRYPTOCAP:ETH is a great catalyst and headliner for Altcoins, who will put on an epic show and attract all the attention
The reaction price of #Ethereum ($2,150) from the demand zone after the last major correction phase is equivalent to the price ($310) it received from the demand zone after the last major correction phase of the 2020-2021 season.

A Cool 3x On Bittensor $TAOAI is still hot and so is Bittensor TAO as one of the biggest winners since 2023.
Also – as of now – the Inauguration seems to trigger a little Mania.
Thats why I think this Cup and Handle Pattern will play out soonish.


Altcoin Golden Cross Formed Last Week - First Time in 4 YearsTrading Fam,
You are probably tired by now of seeing all the hopeful headlines, predictions, and analysis while altcoins continue to descend. I am too. Therefore, I am going to sound a little more pessimistic in this post. Some call this 'realistic' but whatever ...semantics.
While I am hopeful that an altseason will occur, I am also beginning to become less and less convinced that anything like we experienced in the past will occur again. The longer we go without seeing the beginning of our altcoin cycle, the more time altcoins have to dilute the capital pouring into the market. There are just so many altcoins to choose from now and literally hundreds or thousands more are being created weekly by way of memecoins. As the meme on my chart illustrates, those pouring in are spreading their resources out much more thinly now because there is so much more to choose from than there was in 2021. Therefore, what pump we may see in our own investments may not equate to what we expect. And if we are not careful to pick the right coins, it may not even equate to the average profit that was realized in the altcoin market in 2021.
So, here's the deal. By now, you may or may not be aware that a couple of weeks ago our altcoin charts showed us something we haven't seen in over four years! It was the golden cross. This event occurs when our 100 DMA crosses above our 200 DMA. In this case, white represents the 100 DMA and red represents the 200 DMA. They are both SMAs. This event is supposed to be an amazing indicator and a lot of analyst were using it to say that we that our altcoin season has now begun. This very well could be the case, but also, we could drop further and use one of those moving averages as support before any real bounce occurs. Furthermore, past history should never dictate current. History may not in fact repeat and altcoin season may not occur at all. It doesn't have to. Maybe this time we don't get one? This is simply something we should realistically consider.
Now if it does occur, excellent! This is what I personally have been banking on. So, the other thing I want to discuss a little bit more is what actually occurred in the altcoin market last time this happened in 2021. You can see from the chart, that once the golden cross occurred, the race was on. Price essentially continued up through May, dipped from May through July and then continued up again from July through November. So, if you held from the beginning of the cross to our peak in November, you would have realized average altcoin gainz of around 500% (or 5x).
Now, let's say the same thing occurs this year. Our golden cross occurred two weeks later this year than it did in 2021 but I don't think that makes much of a difference. Essentially, if this altcoin season is truly beginning right now, we'll have about 9-10 months of upside with the potential of a big dip somewhere there in the middle. That dip in 2021 was about a 60% drop from top to bottom and paper hands folded quickly during that time thinking the top was in.
If similar price action occurs this year, then we may have 9-10 months to capitalize on alts but again, with a huge exception ...only the best of the best in alts will perform up to this 5x standard or better. You know, stuff like Doge, XRP, SOL, ETH (yes, I said ETH), etc. The OG classic boomer alts.
But what about memecoins?
IMO, a select few memecoins could still do very well, however, we have to be honest here. We are playing roulette. Despite what Murad and others on X continue to preach about belief and conviction and religiosity of the coin, the number of holders, yada yada yada, in the end, we have to be honest with ourselves or we will lose money. Memecoins are simply a big casino. Some will do very well and make their millions. You'll hear from these lucky bastards incessantly I am sure. The fact that they turned 100 dollars into $100,000,000 will be advertised on X and other social media platforms ad nauseam. You will want to go throw up because you were at one time in one of these memecoins too. And then you sold. And these are the stories you won't hear. You won't hear about how many failed. You won't hear about how many degens went broke chasing this imaginary illusion, this pipe dream, of unlimited wealth filled with lambos and yachts with girls. You won't hear that most memecoin traders lost money rather than gained.
I don't want to end too pessimistically here because I am playing the memecoin game too. I'm in the casino and spinning this wheel. Maybe one day I'll be one of those lucky bastards that wins. As of today, that is certainly not the case (just being honest) and I certainly don't stake my life savings on it. So, all I am suggesting here once again is to be cautious. Have fun. Play the game if you wish and I hope you win. But also, be careful, pick only the best of the best, and NEVER risk more than you can afford to lose.
Here's to hoping this is truly the beginning of another altcoin run.
✌️ Stew

TOTAL2 - Rising MegaphoneThis structure allows for strong bullish continuation on this TOTAL2 chart
The green area line shows the continued support for price, this is also the 50MA
I believe we are going to see more support for alts and therefore the market cap will increase
Bullish on this Weekly

ALTCOINS This is the final bullish call.The altcoin market has found support two weeks ago on the 1week MA50.
Even though it is pulling back this week, the new bottom has been formed and the Channel Up should now extend the Cycle and its final Bullish Leg.
The previous Cycle topped just under the 1.5 Fibonacci extension.
With the 1week RSI about to turn neutral, the trend now favors buying again.
We expect to see the market at 2 Trillion (just under the 1.5 Fib).
Follow us, like the idea and leave a comment below!!

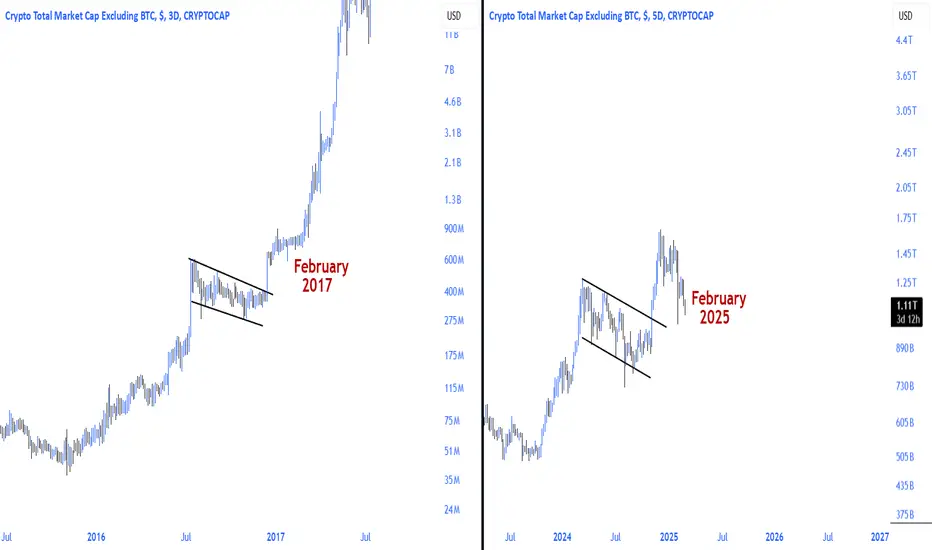
OTHERS.D \ ALTCOINS DOMINANCE CRYPTOCAP:OTHERS.D \ #Altcoins Dominance
The uptrend, which started in 2015, was tested again in December 2016 and the major pump process started. It was tested again for the third time in February 2025, 9 years later.


OTHERS - Bull Channel Looking for continuation of this large channel on the Weekly timeframe
This chart excludes BTC and ETH but there is such an oversaturation of alts that i expect a massive pump across the board, legitimately on every altcoin,
If the channel hodls we are in for a massive run
PUMP IT


SUI | ALTS | BULLISH Chart Pattern?A bullish chart pattern is forming on SUI in the daily chart.
It should be noted that this patter is still premature - meaning that it's not yet completed and there is not yet the confirmation that we need to act on it:
Don't miss the most recent update on XRP here:
_________________________
COINBASE:SUIUSD

SAY IT BACK #Altseason The second phase of the parabolic run that #Alts started in October 2023 begins!
#Altcoins market cap TOTAL3 exited the second accumulation area section of the wyckoff method and started the parabolic run phase.

ALTS painting a clear Cup & HandleNot sure what to do with this information.
I am cautious up here as many of my ALTS are already up over 400% and I have taken profit, just can't unsee what is cooking.

This Coin Is A POWERHOUSE MartyBoots here , I have been trading for 17 years and sharing my thoughts on AAVE here.
AAVE is looking beautiful , very strong chart for more upside
Very similar to XRO which mooned from this structure
Do not miss out on AAVE as this is a great opportunity
Watch video for more details

FET | ALTCOINS | Fetch.AI - GREAT Re-Accumulation ZoneFET was one of my top altcoins for 2024, and it did not disappoint after a 500%+ increase early last year.
FET has since been trading in a major corrective cycle, with near-term bounces (also called mid-cycles or mini-cycles).
A great re-accumulation zone is approaching, and it's possible that FET may trade range before making another push for the upside.
Make sure you don't miss yesterday's update on another great alt, ARKM:
______________
BINANCE:FETUSDT

ETH COOKING ATMLet him cook.
Can't help but notice the similarities in previous mark-up cycles.
Everything looks primed for major expansion to the upside.
