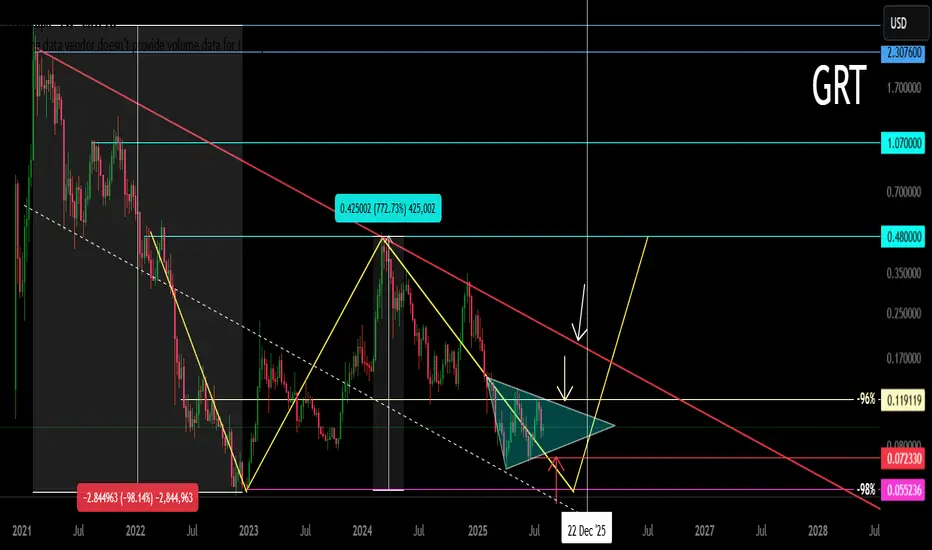
GRT Main Trend (addition) Double Bottom + Triangle 08 2025Logarithm. Time frame 1 week.
Main trend . Supplement for clarity to the previous idea for this cryptocurrency, published 23 02 2025 Everything is essentially the same, the new idea is made to visualize the trend, nothing more.
GRT Main trend.
Line chart, price now
Secondary . Big double bottom (in any case, with local scenario A or B, it will be realized in the medium term).
Local trend (price movements in the trend minimum zones before a big pump). Triangle above the Gann fan ray (see the previous idea, where this tool of the logic of movement in the trend is shown).
The second wave of the triangle is formed.
A downward breakout is a descending pennant, which is the removal of longs under the pattern of a larger scale of historical minimums.
A upward breakout is the realization of the triangle targets, and the price movement to the descending line of the main trend +80-100%
Altseason
Ethereum is seeking to break through the $4k ┆ HolderStatKUCOIN:ETHUSDT recovered from a swift correction into rising trend support and is pressing back toward the 3.76–3.80k pivot. The broader pattern shows sequential triangle breakouts and a strong sideway accumulation that launched the last vertical leg. If 3.55–3.60k holds on dips, targets sit at 3.85k, 3.95k and the round‑number magnet at 4k. Only a decisive daily close beneath 3.50k would threaten the higher‑low sequence and re‑open 3.35k–3.40k. With breadth improving, the bias remains upward while price consolidates beneath resistance.

Hyperliquid is back above $40 ┆ HolderStatKUCOIN:HYPEUSDT rebounded through the 40 handle after completing a measured drop inside a falling channel. The reclaim came right at multi‑month trend support drawn from the “growing channel,” turning 38–40 into a key demand shelf. Momentum broke the channel’s midline and the market is attempting to stair‑step higher with higher lows on 4H. If price holds above 38–40, upside targets sit at 44.2, 46.8 and the prior reaction zone near 48–50. Failure back below 38 would risk a return to 36.3 and the lower boundary; until then, the bias stays moderately bullish with dips likely to be bought.

Solana consolidated above the descending wedge ┆ HolderStatBYBIT:SOLUSDT rotated higher after a swift corrective channel, reclaiming the mid‑range and pushing back toward the 195–205 supply. The chart highlights repetitive triangle resolutions and a strong sideway accumulation before the last impulse, suggesting ongoing demand. Immediate support sits at 176–180 and 168–170; holding above keeps attention on 195, then 205. A breakout through 205 unlocks 210–215 near the upper trend band. Only a daily close beneath 168 would compromise the structure and re‑open 155–160. Until then, dips remain buyable with targets at 195/205.

MEMEFI : Risky but goodHello friends🙌
✅Given the good growth we had, we are now in a correction phase, and given that the price has reached a good support area, we can buy one step, of course, with capital management. In case of further correction, the second step of purchase has also been determined, so make a second purchase, of course, with capital management.
✅We have also specified the targets for you.✅
🔥Follow us for more signals🔥
*Trade safely with us*

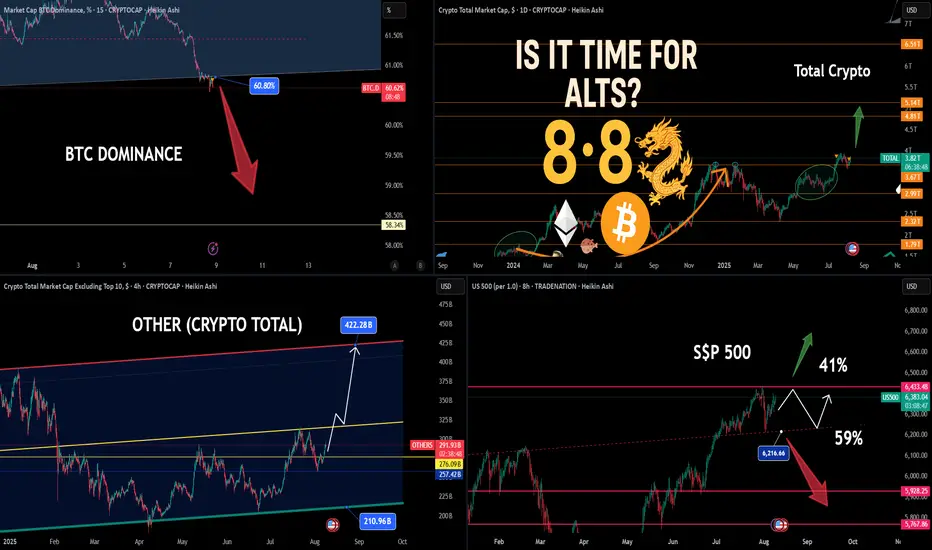
8-8 Double Luck — Time for Alts!🐉🍀 8-8 Double Luck — Time for Alts! 🚀📊
8-8-2025 — Double fortune in Chinese culture, and an angel’s number for alignment and abundance. The market setup is lining up for something interesting.
BTC Dominance (BTC.D)
📉 Slipped under 60.80% — now major resistance.
As long as it stays here, the odds tilt toward altcoin outperformance (if BTC holds or rises).
BTC Above Key Level
🔑 BTC remains above 115,800 support — bullish structure intact.
Total Crypto Market
📈 Watching for follow-through toward higher targets if BTC.D weakness persists.
“Other” Crypto Market (Excluding Top 10)
📊 Breakout path toward $422B possible if momentum continues.
S&P 500 (SPX)
📉 Still in range after rejection at resistance.
Two possible paths:
✅ Break higher (41% probability)
❌ Pullback toward lower support (59% probability)
Summary:
BTC > 115,800 ✅
BTC.D < 60.80% ✅
ETH already tagged $4K.
Alt window is open — for now.
One Love,
The FXPROFESSOR 💙
Disclosure: I am happy to be part of the Trade Nation's Influencer program and receive a monthly fee for using their TradingView charts in my analysis. Awesome broker, where the trader really comes first! 🌟🤝📈
LINK : You want the link for the pump?Hello friends🙌
✅considering the recent market decline, the LINK market has also fallen like other currencies, and many of you are afraid that this is the end and the rise is over or is there still a rise?
✅Well, as we have indicated on the chart, after the price fell to the support area marked with Fibonacci, a double bottom pattern was formed and then the price was increased by buyers.
✅In this wave, we drew another Fibonacci and identified the area where the price pulled back, and we believe this currency has good potential for growth.
✅Now you can buy in steps in the specified areas with capital and risk management and move to the specified targets.
🔥Follow us for more signals🔥
*Trade safely with us*

ETH: LIVE TRADEHello friends🙌
✅Given the good rise we had, we had a small correction that was a buying opportunity and there is another support area where we can buy the second step in case of further correction.
We have also specified targets for you, be careful and do not act emotionally and observe capital and risk management.
🔥Follow us for more signals🔥
*Trade safely with us*

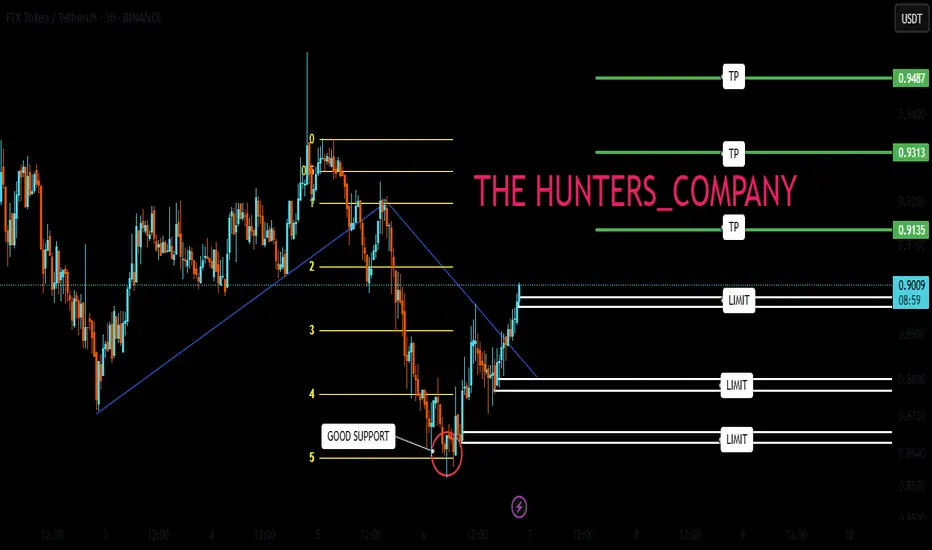
FTT : Go to work, it's goodHello friends🙌
✅after the decline we had, you can see that the price was supported by buyers in the support area we identified with Fibonacci and broke its resistance.
✅Now you can buy in the support areas we have identified for you with risk and capital management and move towards the set goals.
🔥Follow us for more signals🔥
*Trade safely with us*
BIO : BUY MARKET!!!Hello friends🙌
✅Given the good upward wave we had, the price has now corrected, providing a good opportunity to buy in steps in the specified areas with risk and capital management and move towards the specified goals.
🔥Follow us for more signals🔥
*Trade safely with us*

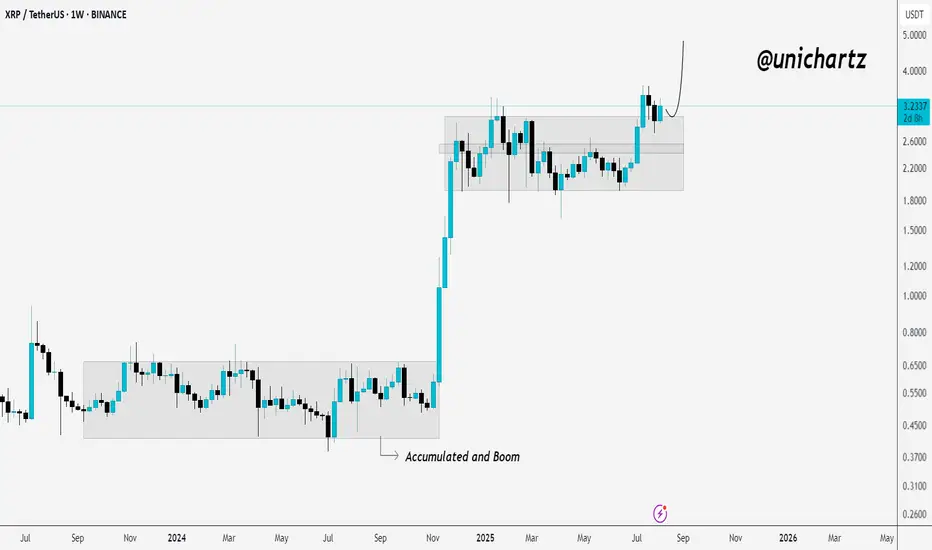
From Accumulation to Acceleration – XRP Ready to RunCRYPTOCAP:XRP has successfully retested the breakout level from its previous accumulation zone, showing strong bullish momentum.
After spending months consolidating in a tight range, price finally broke out with a sharp rally. The recent pullback found support right at the top of the old range, a classic breakout retest, and buyers stepped back in.
This retest confirms the breakout’s strength and could set the stage for the next leg up, with bulls now eyeing higher targets as long as price holds above the former resistance zone.
DYOR, NFA
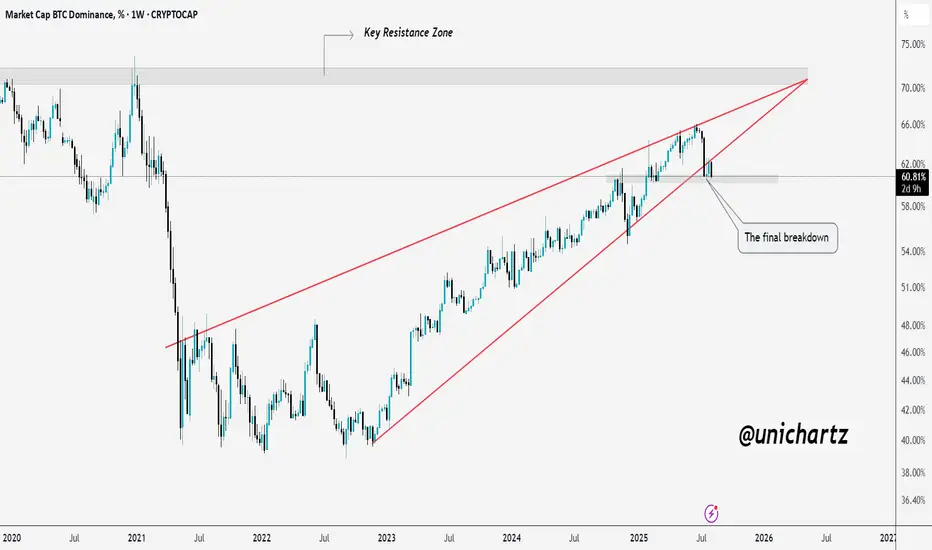
Altcoin Bulls Watching This Retest CloselyBTC Dominance has cleanly retested the breakdown from its rising wedge pattern after failing to break the key resistance zone.
This retest is a critical point if sellers maintain control here, dominance could trend lower toward the next support range, potentially sparking an altcoin relief rally.
However, a reclaim above this breakdown zone would invalidate the bearish setup and shift momentum back in Bitcoin’s favor.
DYOR, NFA
VELVET : RISKY BUSINESSHello friends🙌
✅According to the movement logs that this currency has formed, it shows the high purchasing power of buyers and we can also buy in stages during price corrections with risk and capital management and move with it to the specified goals.
🔥Follow us for more signals🔥
*Trade safely with us*

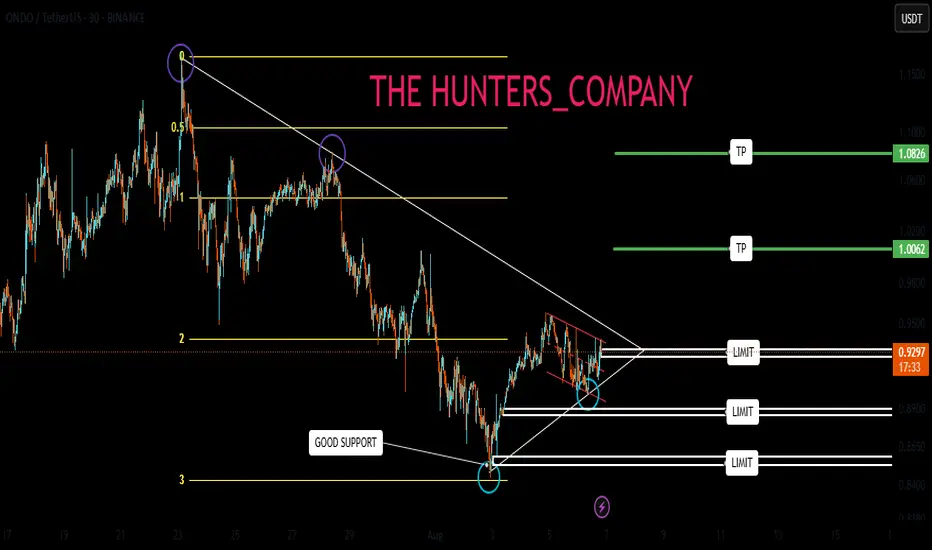
ONDO:What are the implications of being listed on an exchange?Hello friends🙌
What are the implications of being listed on an exchange?
✅Well, the first question that comes to mind when a currency is listed on an exchange is what impact does it have? Will the price be pumped or dumped? Let's examine it together.
✅Well, many currencies are listed on exchanges, and not every currency that is listed is necessarily pumped or dumped.
Many factors are involved in this, the most important of which is the chart.
✅So, if we look at the chart of this currency in the 30-minute time frame, which can be considered a short-term time frame, we see that we had a decline due to the selling pressure in the market for the past few days, and now we see that in the third leg of the Fibonacci, buyers supported the price and created higher lows.
✅Now, these higher lows alone are not enough for us to buy, we need other confirmations, the most important of which is a valid breakdown of the identified resistance.
By breaking this resistance validly, we can buy in the areas we have identified for you in a stepwise manner, with capital and risk management, and move towards the specified goals.
If it fails to break the specified resistance and the buyers do not have enough power, we will refrain from buying it.
✅So this was the listing of currencies on the exchange and its impact on the currency price.✅
🔥Follow us for more signals🔥
*Trade safely with us*
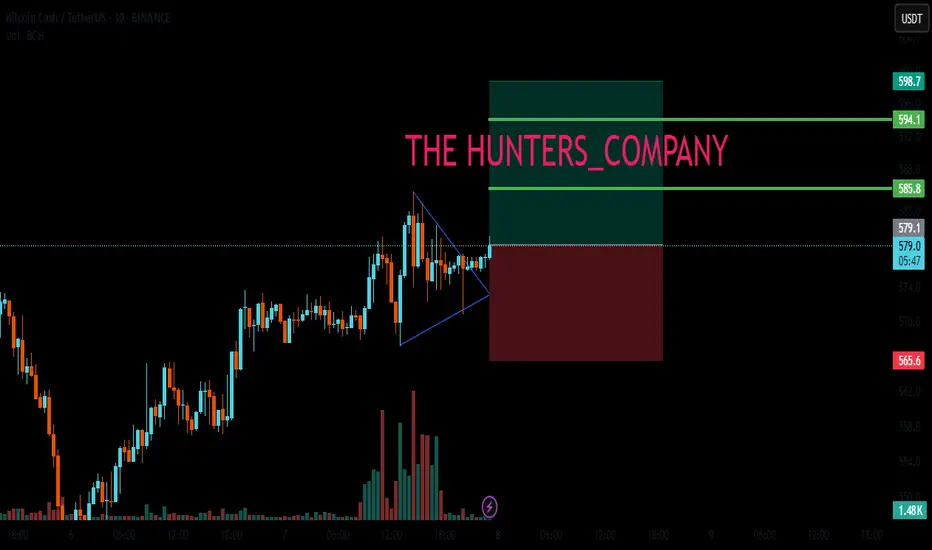
BCH : LIVE TRADEHello friends 🙌
✅Due to the good rise we had, the price has compressed and now formed a triangle.
Now with the valid triangle pattern, we can enter the trade with risk and capital management and move with it to the specified targets.
🔥Follow us for more signals🔥
*Trade safely with us*
Ethereum Not Dead- i know some peoples think ETH will go to 250$ or 500$, so wait for it...
- I've always maintained that I'm not a fan of ETH because of its scalability limitations and centralization, for that reason ETH needs some messy L1...L2...etc..
- That said, my opinion doesn’t matter much, ETH is here to stay. The Ethereum ecosystem hosts thousands of projects; I’d say it’s too big to fail.
- i used Bitstamp exchange to look further back in the chart's history.
- i simplified this monthly chart so much that even a 10 year old kid could understand it, just check the RSI low levels and compare it with previous years. Again, check the max RSI level for the previous ATHs.
- i won't discuss where to buy because, whether you get ETH at $1,800 or $1,500, the bull run for ETH and Altcoins hasn't started yet.
Happy Tr4Ding !

ETHSimple chart :
- Don’t fight the trend, just stick to your strategy.
- follow the signs.
- Never go all in and always DCA.
Only this way we will learn to master our emotions.
Happy Tr4Ding !

TST : Waiting for the defeat of suffering...Hello friends🙌
✅ considering the large and frequent declines of this currency, we do not take unreasonable risks and have identified the trading range that has formed and are waiting for the range to break.
✅If there is a valid resistance break, you can buy and move with it to the targets specified by Fibonacci.
✅In the event of a continuation of the decline and a valid break of the range from below, you can enter a sell trade and move with it to the targets specified by Fibonacci.
✅Be sure to observe capital management.✅
🔥Follow us for more signals🔥
*Trade safely with us*

OMNI : Will it happen again?Hello friends🙌
✅As you can see, everything is clearly and explicitly drawn for you.
✅Just pay attention to risk and capital management for trading and if you like, support us.
🔥Follow us for more signals🔥
*Trade safely with us*

XRP | Ripple Game Plan - Swing Long Idea📊 Market Sentiment
Overall sentiment remains bullish, supported by expectations of a 0.25% rate cut in the upcoming FOMC meeting. The weakening USD and increased risk appetite across global markets are creating favorable conditions for further upside in crypto assets.
📈 Technical Analysis
Price broke the bearish trendline that had been driving the downtrend since July 18th.
A strong breakout and close above the trendline confirmed the move.
The breakout area also aligns with a significant HTF key level, adding strength to this zone.
📌 Game Plan
Looking for a quick retest of the broken trendline and HTF key level before a rejection.
🎯 Setup Trigger
Confirmation will come from a clear 1H break of structure after the retest.
📋 Trade Management
Stoploss: Below the 1H swing structure that caused the break of structure
Targets: TP1: 3.57 | TP2: 3.66
Will trail stop aggressively to secure profits as the move develops.
💬 Like, follow, and comment if this breakdown supports your trading!
More setups and market insights coming soon — stay connected!

Altcoin Season Still Nowhere in SighThis cycle is shaping up very differently for altcoins compared to what we’ve seen in the past. Typically, about a year after the Bitcoin halving, altcoins begin to rally hard against their USD pairs, with the run generally continuing until Ethereum tops out — which usually happens in Q4 of post-halving years. However, this time around, altcoins have remained largely dormant. With the exception of the pre-election pump in 2024 — when retail traders prematurely priced in perfection without fully grasping what lay ahead — the altcoin market has barely moved.
To better visualize this, I’ve overlaid BTC Dominance (BTC.D) with the ratio of (TOTAL3 - USDT) to BTC. On that overlay, the 0.25 level stands out as a key historical marker. In previous cycles, once that 0.25 level was hit, BTC Dominance would peak and then drop rapidly, marking the beginning of the blow-off phase for altcoins. Ethereum and other major alts would then play catch-up, often resulting in massive upside. But as of now, we haven’t even touched that level, and BTC.D remains elevated.
This deviation from past patterns likely stems from growing institutional interest in Bitcoin. Unlike previous cycles, capital is not flowing into altcoins at the same rate. Bitcoin has increasingly positioned itself as an asset in its own league, attracting large-scale investors who are ignoring the broader crypto space. That institutional support is creating a clear separation between Bitcoin and the rest of the market.
I still believe we’ll eventually see an altcoin season, but it hasn’t happened yet. For that to occur, we need to see the 0.25 level on the TOTAL3/BTC chart get hit and for BTC pairs of altcoins to bottom. Only then will the conditions be right for altcoins to rally and for Ethereum to begin its catch-up phase. Until then, patience is critical.

EPIC : Risky signal...Hello friends🙌
🔊Due to the good price growth, we have found important support points for you.
Now, due to the price correction, we have found buy points for you and you can buy with risk and capital management and move with it until the goals we have set for you.
🔥Follow us for more signals🔥
*Trade safely with us*

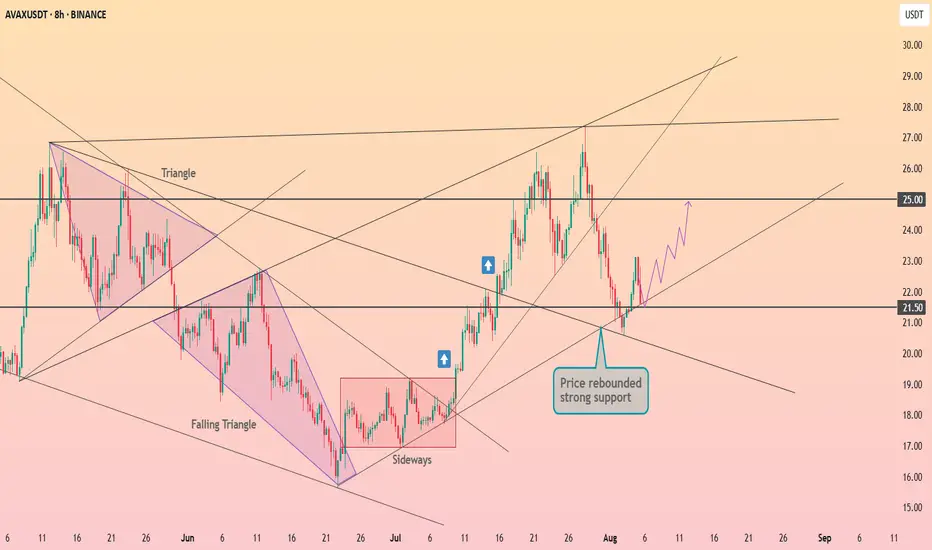
Avalanche will retest the $21.5 level ┆ HolderStatBINANCE:AVAXUSDT bounced sharply from the $21.50 support, confirming the level as a pivot zone. Previous breakout patterns remain intact, and the current price action indicates potential for a move toward $25.00 resistance if buyers maintain control.