The Telcoin Explosion Starts Now!Telcoin reminds me of the early days of the Bitcoin cycle. I see strong potential for a massive pump coming soon. When cycles are this undervalued—when the community is strong, the fundamentals are solid, and the chart looks amazing—almost nothing can stop a parabolic run from happening.
As always, stay profitable.
– Dalin Anderson
Altseason

Bitcoin Mid Term Game Plan - BTC PLANBitcoin just broke a key resistance level with strength.
I expect a new all-time high soon, likely the summer top.
Summer markets are usually weak for risk assets and strong for gold. Seasonality matters, keep that in mind.
I expect risk markets to sell off until mid-July to early August. I’ll start buying once we break structure again.
The plan:
Wait for BTC to hit $110K
Look for a reversal from that level
Start aggressively shorting alts, beginning with ETH and memecoins
Hold shorts until late July / early August
Close positions and shift back to buying

Pudgy Penguins PENGU Bullish Reversal Taking Shape🐧 Pudgy Penguins BINANCE:PENGUUSDT has bounced twice from the $0.009–$0.008 buying zone, showing resilience despite the choppy structure. As long as the June low holds, the setup favors a higher low formation next month, potentially setting the stage for the next impulsive leg higher.
Momentum is building — now it’s about follow-through and confirmation.

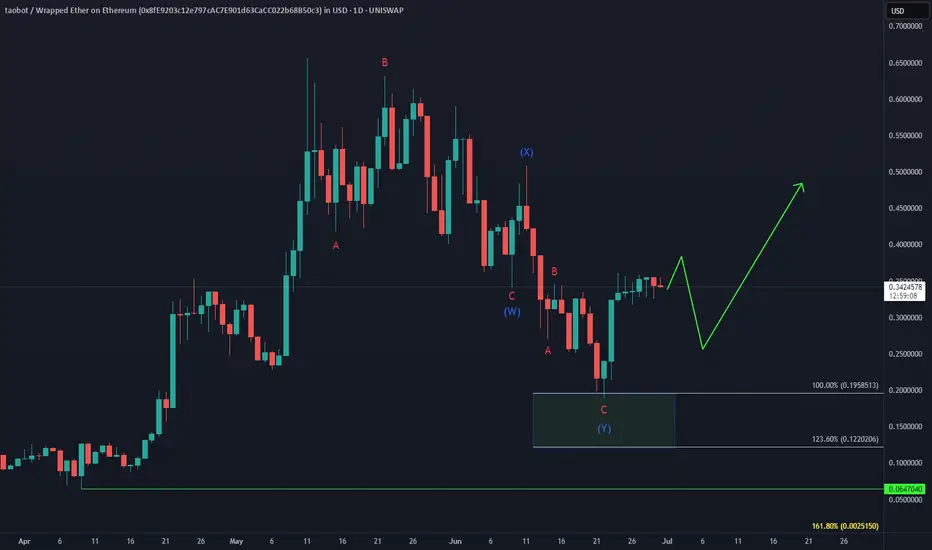
TAOBOT Bullish ReversalWill UNISWAP:TAOBOTWETH_8FE920.USD outperform BINANCE:TAOUSD ?
After the failed early June bounce, price completed a double correction into the $0.195–$0.12 equal legs zone, triggering a sharp 90% reaction higher.
As long as $0.19 holds, the setup favors continuation to the upside, with a break above the May peak in focus.
KAITO gears up for liftoff!CRYPTO:KAITOUSD
The correction from the May peak has wrapped up within wave (2), and price is now pivoting from the June low at $1.22. Holding above that level keeps the bullish roadmap intact—with eyes firmly on the $2.96 target to unlock fresh all-time highs.

SOL Ready To Breakout?SOL had a decent move this weekend overcoming descending resistance and now testing as support.
Price appears to have a completed a wave (2) at the .618 Fibonacci retracement and S1 daily pivot and a larger degree wave 2 at the channel bottom, High Volume Node support and .618 Fibonacci retracement.
If a wave (3) of 3 is underway then we should expect a strong move sooner rather than later with an initial target of the swing high resistance a/ R2 daily pivot $208-$216 range
Safe trading.

Parcl - PRCL-USD - 30 Million Market Cap (100x Potential)www.tradingview.com
CHATGPT Research Summary:
Parcl: Unlocking Real Estate Exposure on the Blockchain
Introduction:Parcl is a groundbreaking decentralized platform that enables traders and investors to speculate on real estate market price movements much like they trade crypto or equities. By combining real-time housing data with blockchain technology, Parcl offers around-the-clock, borderless, and highly liquid exposure to global residential real estate markets. In this comprehensive blog post, we’ll explore what Parcl is, how it works, what it means to own the EGX:PRCL token, the unique opportunities it provides for investors (including AI-driven strategies), its core strengths, and the risks and challenges it faces. The tone is professional, investment-focused, and designed for the TradingView audience.
What is Parcl and How Does It Work?
Parcl allows users to trade real estate price indices for global cities without ever owning or transacting physical property. Each index represents the aggregated median price per square foot/meter for residential properties in a specific city. Users can go long or short on these indices using perpetual contracts with up to 10x leverage, entirely on-chain and settled in USDC.
Built on Solana, Parcl leverages the blockchain's high speed and low fees to offer a seamless and cost-efficient trading experience. Users only need a Solana-compatible wallet (e.g., Phantom) to deposit USDC, select a city index, and place a trade. There are no barriers such as down payments, brokers, or escrow delays — just rapid, decentralized access to global housing markets.
Data integrity is ensured through Parcl Labs, which aggregates millions of housing data points daily to generate real-time city indices. These feeds are streamed on-chain via oracles like Pyth Network, ensuring transparency and reliability.
What Does It Mean to Own EGX:PRCL ?
The EGX:PRCL token is the governance and utility token of the Parcl ecosystem. Holders of PRCL can:
Participate in protocol governance by voting on changes to platform parameters, fee structures, and market expansions.
Access premium real estate data and analytics through Parcl Labs.
Receive airdrops, rewards, or staking incentives as part of community growth and loyalty initiatives.
While PRCL doesn’t currently offer revenue sharing, it grants holders influence over protocol decisions and potential future economic alignment as the ecosystem matures.
A New Asset Class for Investors and AI Agents
Parcl opens up a completely new asset class: blockchain-native, synthetic real estate exposure. This has major implications:
For retail investors, it democratizes access to real estate, which was previously limited by geography, capital requirements, and illiquidity.
For sophisticated traders, it enables granular bets (e.g., short New York, long Miami) and high-frequency strategies previously impossible in traditional real estate.
For AI agents and algorithmic investors, Parcl provides composable, on-chain access to a diversified asset class that can be rebalanced and traded programmatically.
In short, Parcl makes real estate a liquid, programmable, and globally accessible financial primitive.
Core Strengths: Why Parcl Stands Out
Solana-native speed & cost-efficiency: Enables fast execution and micro-investments ($1+), ideal for retail users and automated agents.
Unique data infrastructure: Parcl Labs’ real-time indices provide unparalleled accuracy and granularity.
Sophisticated perpetual AMM model: Handles liquidity and market balancing with dynamic funding rates and cross-margining.
Growing community and product-market fit: With 80,000+ users and over $1.3B in cumulative volume, Parcl is becoming the most liquid real estate trading venue in the world.
Risks and Threats to Consider
Regulatory uncertainty: Synthetic real estate products may eventually face classification as securities or derivatives in some jurisdictions.
Liquidity dependencies: The AMM model depends on sufficient USDC liquidity pools; low liquidity could cause slippage or insolvency risk.
Smart contract vulnerabilities: As with all DeFi platforms, there is non-zero risk of exploits or oracle manipulation.
Platform dependency: Parcl is tightly coupled to Solana — if the chain experiences downtime or congestion, the protocol may be impacted.
Investors should also be aware of token unlocks and potential dilution from early backers and treasury allocations.
Future Outlook and 100x Potential
With a current market cap near $30 million, Parcl represents a high-upside, early-stage bet on tokenized real estate. If the project gains traction and achieves broader adoption, it’s feasible to imagine a future market cap of $2.5 to $3 billion, representing a 100x potential from current levels.
Factors that could drive this include:
Expansion to more global cities
Increased PRCL utility and staking incentives
Growing demand for real-world assets (RWAs) on-chain
Enhanced support for automated and AI-driven strategies
Final Thoughts
Parcl is redefining what it means to invest in real estate. By transforming local, illiquid property markets into a global, composable, and liquid asset class, Parcl enables both human and AI investors to access and trade the housing market like never before.
Whether you’re a trader looking for uncorrelated exposure, a long-term investor seeking innovation, or a technologist building AI agents — Parcl offers a compelling opportunity.
⚠️ Disclaimer: This is not financial advice. Always do your own research and make investment decisions based on your individual risk profile.

Breakout loading on $XRPBreakout loading on CRYPTOCAP:XRP 🚀
Accumulating heavily here as the price coils inside a massive triangle.
Q3 could be explosive, chart points to a breakout toward $4.60
Retweet if you're BULLISH !!

Bitcoin Dominance Is at the Edge and Fundamentals Are PushingCRYPTOCAP:BTC.D Bitcoin dominance (BTC.D) is pressing right into a massive multi-year trendline that has capped it since 2018. We have seen higher lows building since 2022, tightening this squeeze even more. Now it is decision time.
The fundamentals might just tip the scales.
David Sacks says July could be a huge month for crypto. Bakkt is lining up a 1 billion dollar shelf offering that could directly buy BTC. Meanwhile US regulators are pushing hard to finalize crypto market structure rules by September. On top of that, ETFs and big institutional players keep funneling money primarily into Bitcoin, not altcoins.
All this is fueling the case for a breakout in BTC dominance. If it happens, Bitcoin will likely outperform the rest of the market for a while, pulling more of the crypto share back into its hands.
If the chart rejects, we might see altcoins catch some wind and take the spotlight for a bit. But right now with this macro pressure building, the odds seem to favor Bitcoin leading the next leg.
Keep an eye on this chart. A clean breakout above the trendline could set the stage for a very Bitcoin-heavy next few months.

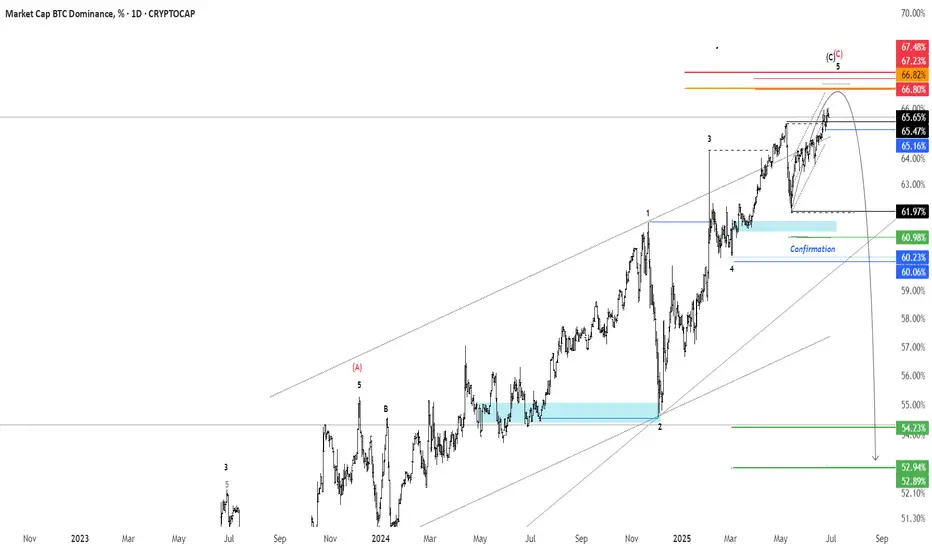
BTC.D - 1D Timeframereversal zone 66.8 : 67.2%
Confirmation : 60.23%
Targets : 52.94% / 31.03
invalid : 67.48%
HolderStat┆ETHUSD trying to break through the resistanceBINANCE:ETHUSDT has confirmed a triangle breakout above the 2,312.67 level and is forming a bullish staircase structure. The chart shows a history of breakout rallies from similar formations, and this current setup targets 2,700+. Maintaining higher lows is essential for follow-through.

HolderStat┆XRPUSD consolidation of the assetBINANCE:XRPUSDT has bounced from the 2.02 level and is approaching the upper edge of a large consolidation structure. Multiple prior consolidation zones have led to breakouts, and the current bounce hints at continuation toward 2.30. A clean close above resistance would confirm bullish intent.

HolderStat┆BNBUSD forming the falling wedgeBINANCE:BNBUSDT on the 8h chart rebounded from a falling wedge and reclaimed the $630 support. Price structure shows growing strength as it aims for $680 next. Watch for a breakout confirmation to ignite a push toward $740.

I'm having illusionsBTC.D is back at 65% (White Line) — same level we saw 5 years ago (5 years is a natural market cycle). In Dec 2020, it spiked to 73% (Green Line) before dipping hard... and that drop kicked off the last real Altseason.
BTC.D dipped to 40% by May 2021 (Orange Line)
ETH pumped +470% 🚀 in that window. A few months later in Nov '21, ETH hit its ATH of $4,878 (Pink Line)
Fast forward to now:
BTC.D is climbing into a historic 70% (Yellow Line) resistance zone (pre-alt era levels). I’ve set an alert for 69%, which is just below that pre-altseason rejection zone (69 is also a natural number, if you know what I mean)… so it’s a critical level to watch.
Despite Ethereum being criticized by some as a “relic,” its market capitalization is still vastly higher than the next-largest alt, XRP, by over $166.9 billion. That’s a huge footprint in the crypto space; it's still very much a market heavyweight IMO. ETH/USD likely to decline near term. Watch for a potential rebound by end of Q3.. #NFA
Not saying history will repeat... But if it rhymes again — I might turn off the charts for a night and go dancing!

Cardano Correction or Opportunity? (READ THE CAPTION)By analyzing the #Cardano chart on the 3-day timeframe, we can see that after reaching 73 cents and amid rising war tensions, the price started a correction along with the broader crypto market. This correction has now brought ADA to attractive zones for potential laddered buying and long-term investment. Cardano is currently trading around 54 cents, and if the conflict continues, it may drop further, possibly below 45 cents.
Key demand zones are at $0.36, $0.45, and $0.52.
Short-term targets are $0.61 and $0.76, while long-term bullish targets are $0.93, $1.05, and $1.33.
Please support me with your likes and comments to motivate me to share more analysis with you and share your opinion about the possible trend of this chart with me !
Best Regards , Arman Shaban

HolderStat┆ETHUSD formed the rising bottomBINANCE:ETHUSDT on the 16h chart is pressing upward inside a steep channel after reclaiming $2,300. Momentum is driving the price toward $2,800 and possibly $3,400. Previous breakouts from consolidation zones support the bullish bias.

HolderStat┆SOLUSD above the supportBINANCE:SOLUSDT reclaimed the $140 level after a wedge breakout and is now forming a stair-step recovery structure. The price is targeting the mid $150s with higher lows supporting the bullish thesis. Previous consolidations and wedge formations suggest buyers are regaining control. Continued strength above $140 reinforces the move.

HolderStat┆BNBUSD retest of the channelBINANCE:BNBUSDT has completed a bullish reversal from the 633.4 level and is now testing upper trend resistance. A breakout from this wedge structure may lead to a rapid move toward the 680–700 region. Past triangle patterns have preceded strong rallies, and momentum indicators favor bulls. Traders will look for a breakout above 650 to confirm.

HolderStat┆ADAUSD retest of the supportBINANCE:ADAUSDT has bounced from the 0.55 support level, completing a falling wedge structure. The price now attempts to recover, with a visible bullish wave formation targeting the 0.62 resistance trendline. Multiple past consolidations have preceded breakouts, and if this pattern holds, a strong upside push is possible. Watch for confirmation of continued higher lows.

AEVO Main Trend DEX L2 Listing 212 X !) Decrease -98% 06 25Logarithm. Term 3 days.
Asset super hype in the past, listing with overly positive and aggressive marketing at 212X!
1️⃣Q1 2023 Private Seed $0.0185 / $1.85 million
2️⃣10 05 2023 Private Series A $0.13 / $6.01 million
3️⃣Q4 2023 Private Series A+ $0.25 / $8.75 million
4️⃣13 03 2024 Listing on the Binance exchange on the day of the secondary market trend reversal (I missed it, and it happens).
26 06 2025 now -98% decline after listing, which is 4.2X from the last prices of scammers, who gradually distributed, maintaining liquidity and the news background all this time their huge profit. Most of the coins are redistributed. You can think about collecting in this sideways, on a breakout of a local wedge (local trend), or on a breakout of a descending channel (reversal of the main trend).
Those who are far from trading can buy in equal parts (3 parts). From the position of the main trend and potential, the prices are now acceptable (you can buy the first part), so to speak (former "hype investors" are in wild horror).
Exit zones will be zones of previous consolidation, that is, those who previously bought on the hype will not be able to make a profit. In fact, it is always like this ... There are no “passengers”, then they will pump up well. As a rule, +800-1000% such assets of the previous excitement and such liquidity.
Local reversal zone.

BTC Dominance Nearing Major Reversal Zone?Dominance has been grinding higher for months, but it's now walking into heavy resistance, and the structure looks like a rising wedge (not a great sign for bulls).
This setup often ends with a breakdown, which could be the spark altcoins are waiting for.
It’s not confirmed yet, but the chart’s starting to hint at a shift.
Watch closely, big moves usually follow tight squeezes.

15 R:R setup for EthereumWe assume that this marks the beginning of a new uptrend for BTC. This setup offers an easy 15:1 risk-to-reward ratio.
Entry: 2534
Stop Loss: 2373.33
Target: 5000
This is for educational purposes only.

TOTAL2, TOTAL MARKET CUP without BTCTOTAL2, TOTAL MARKET CUP without BTC
Reasonable targets are within the yellow zone — these are high-probability levels based on current price action, volume, and market structure. They offer the best risk/reward and are ideal for primary take-profit planning.
Targets outside the yellow zone are still possible but come with higher risk. They typically require extended time, increased volatility, or external catalysts. These should be treated as secondary or speculative targets, best approached with reduced size or active trade management.
Summary:
Yellow zone = high probability, balanced risk/reward.
Beyond yellow = lower probability, higher risk, use with caution.
