HolderStat┆ADAUSD above the $0.66 levelCRYPTOCAP:ADA
→ Climbs out of falling channel, presses 0.68 trend-lid
↳ Accept > 0.68 targets 0.72–0.75 → 0.80–0.85
⇢ Must defend 0.60–0.63 breakout shelf
⤴ Fall < 0.60 hands reins to bears aiming 0.58–0.55
Altseason

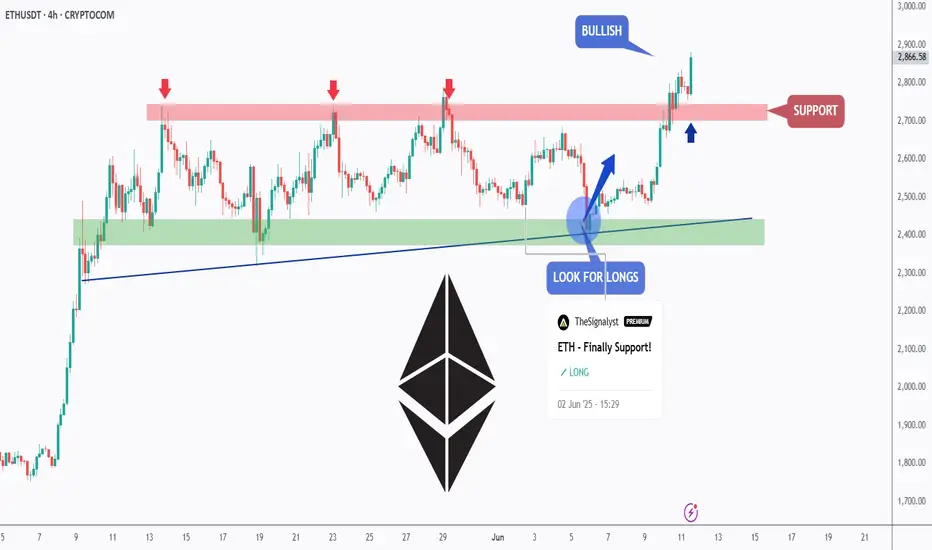
ETH - Medium-Term Bulls Confirmed Control!Hello TradingView Family / Fellow Traders. This is Richard, also known as theSignalyst.
📈 As per our previous ETH analysis (shown on the chart), ETH rejected the green support zone and pushed higher, reaching our target near $2,750.
What’s next?
After breaking above the $2,750 structure marked in red, the bulls have confirmed medium-term control.
🏹 As long as the last major low at $2,700 holds, ETH is expected to remain bullish, with a potential move toward the $3,500 resistance zone.
📚 Always follow your trading plan regarding entry, risk management, and trade management.
Good luck!
All Strategies Are Good; If Managed Properly!
~Rich
ADA | Liquidity Drain or UPSIDE POTENTIAL??ADA is lacking behind in terms of altcoins this season. We've not yet seen the new highs or parabolic increases that is due for a new BTC ATH.
We're seeing higher highs, and higher lows in the macro which is a bullish sign - indicating the trend is still BULLISH
From the macro, we do see a better picture.. at least THIs time around, the accumulation cycle isn't in such a tight range, and you could day trade / swing trade:
_______________
BINANCE:ADAUSDT

The Charts Never Lie [Well, almost never]So many reasons to be Bullish on Alts right now.
Historically, BTC will peak first, and then ALTS will have their turn. It looks like they are prime for a run at least to the middle of the range, although why stop there?

$GRT IS ABOUT TO GO Graph ( JSE:GRT ) is about to go. Zoom in and out and see it for yourself. History will always repeat itself. You can see the short term targets

BTC.D(based one NEowave)the Z wave of this branch shown as a triangle and I think its finished but for confirmation breaking the 61.9 is important.
its a green light of Altseason.

Altcoin MarketCap - Consolidating Before the Ride!On the chart you can see a Pure Capitazation of Altcoins - Crypto Market Cap Excluding Bitcoin, Ethereum and ALL Stablecoins.
There was formed a very clear model that has all chances of repeating once again:
First goes a strong ascending movement from 0 to a bit higher than 0.618 Fibo lvls.
Then there is a correction inside the descending channel/bull flag down to ~0.382 with one long shadow below that sets a 0 point for a new cycle.
Breakout of a bull flag follows after.
Final stage before the growth is consolidation in the range of 0.382 and 0.5 levels by Fibo.
Pump.
We are currently at the 4th stage , as you might have guessed. The consolidation can still take some time, up to a couple of months, since there are no specific time restrictions that invalidate the model.
However, this doesn't cancel the fact that the target is 1 by Fibo, namely $1.7T MarketCap of Altcoins, which is x2 from current points . I tend to believe holders deserve such a run.

LINK Structure Shaping Up for Potential BreakoutvChainlink is now approaching a key resistance trendline after showing a strong bounce from the recent demand zone.
Price is pushing into this trendline with good momentum. If we see a clear breakout and daily close above it, this could open the door for a continuation move toward the next target area around seventeen point seven dollars.
However, this is still an important level to watch. If the trendline holds and price gets rejected, a pullback toward the demand zone near fourteen dollars is possible.
At this stage, the chart is showing a constructive setup. It’s worth keeping an eye on how price behaves here in the coming sessions.
Thanks for reading

HolderStat┆BTCUSD preparing to test 110kYesterday's rise in CRYPTOCAP:BTC puts the immediate target at testing 110,000 and 112,000 and after that opening a new ATH. Local resistance has been broken.

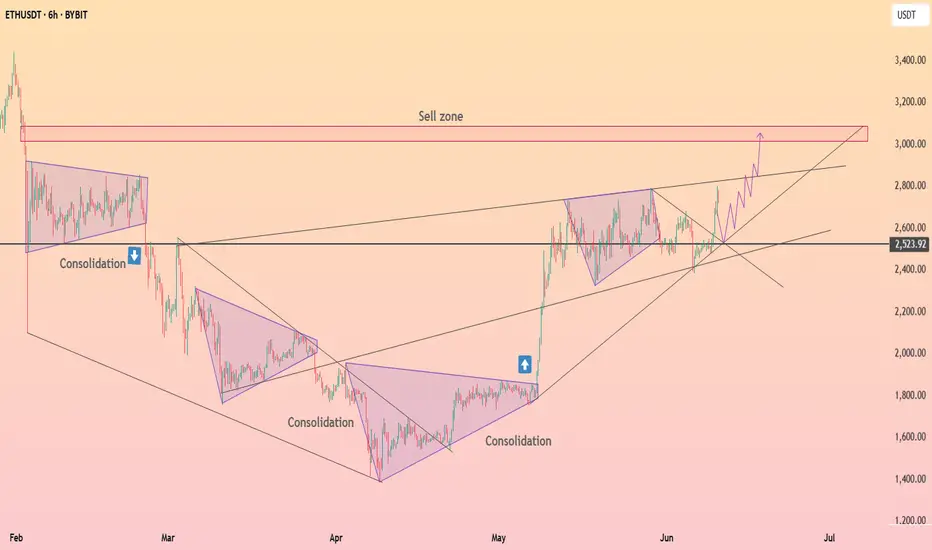
HolderStat┆ETHUSD move in accumulation zoneHolding CRYPTOCAP:ETH in the range of 2,520 - 2,750 formed an accumulation zone. Breakout of this range gives an opportunity for growth of 3,000+
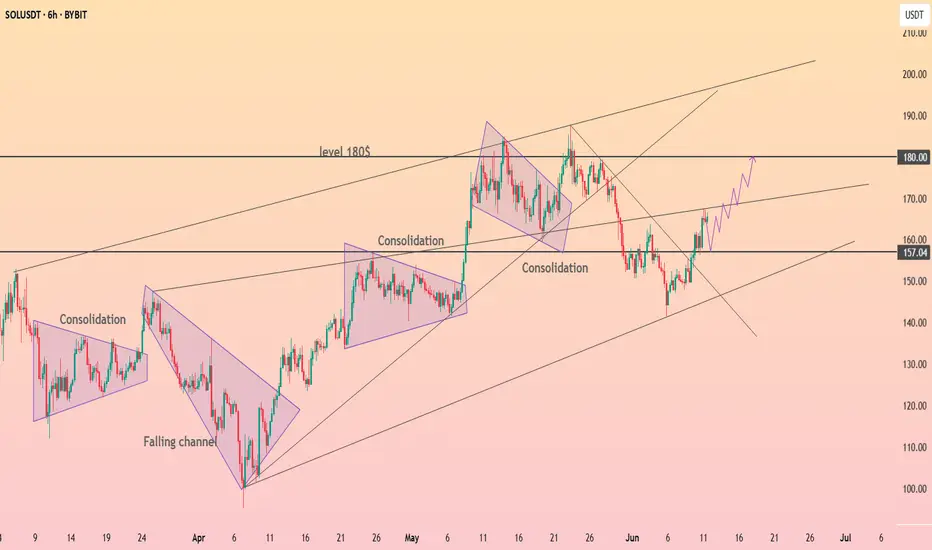
HolderStat┆SOLUSD reached resistance lineCRYPTOCAP:SOL just flipped the 157 pivot into support after escaping a falling channel and retesting the up-trend. Holding here fuels a run toward the 170 trend-cap and 180 supply shelf; failure invites 150 again. Growing channel, consolidation clusters, breakout watch.
HolderStat┆XRPUSD kept the support trend lineCRYPTOCAP:XRP has successfully consolidated above trendlines that have previously acted as resistance on multiple occasions, but the market could still retest 2.25. A break of 2.35 opens the way to 2.4.

HolderStat┆BNBUSD breakout of the $655 levelCRYPTOCAP:BNB successfully broke upward descending channel and is now above the level of 655. The triangle target was reached around 620, which gives control to bulls.

HolderStat┆ADAUSD above the $0.7 levelCRYPTOCAP:ADA is aiming to test 0.7 level with possible reaching 0.6764. The descending structure has been broken, we expect the formation of an ascending bottom to confirm the new structure.

SUI is building momentum!📈 CRYPTO:SUIUSD After a three-swing corrective pullback into the $3.3 - $2.7 buying zone, price is bouncing and setting up for the next upside move.
The structure is in place—let’s see if the breakout confirms!

ALT RALLY COMING - UPDATE! The long awaited ALT rally is coming. Just a few more days it looks like. Then perhaps 25% - 40% increases in alts across the board.

Bitcoin Dominance Update – Key Levels in Play!Hey Traders!
If you’re finding value in this analysis, smash that 👍 and hit Follow for high-accuracy trade setups that actually deliver!
BTC Dominance is testing a major resistance zone after a sustained rally from late 2024. The structure is showing signs of exhaustion near the 64-65% zone.
🔶 Pattern: Rising wedge breakdown
🔶 Current Action: Retesting broken support zone as resistance
🔶 Key Resistance: 64.5% - 65%
🔶 Rejection zone: Strong supply sitting overhead
Why this matters for Altcoins:
A rejection from this zone could open the door for capital rotation into altcoins.
BTC dominance stalling = potential for ETH, SOL, and midcaps to gain momentum.
If dominance goes down, it may keep altcoin rallies capped for now.
Monitor closely — dominance breakdowns often align with altseason rotations.
💡 Stay patient, stay prepared.

ETH BULLISH SETUPEthereum has recently broken out bullishly on higher timeframes, signaling a potential move toward the key resistance zone around $3,460. This level holds significant technical importance. The breakout above the hourly flag pattern confirms bullish momentum. As long as price holds above $2,300, the setup remains valid. A drop below this level would invalidate the current bullish outlook.

You can't unsee itThere is something to be said for the simplicity.
The historical price action is clear.
The RSI trend/cycles are just as clear.
There is not much space left for compression.
A BIG MOVE IS COMING.
The only question is, are you ready?

Ethereum Is About to Start Making Its Move to $4100Trading Fam,
Lot's of good patterns occurring on the crypto charts recently, Ethereum is no exception. Here you can see a valid inverse head and shoulders pattern has formed. 85% of the time, these patterns play out.
If we do break that neckline to the upside, I would suggest that $4100 will come fairly quickly. We do have a few resistance areas ahead of us where I expect some pause. But this will only give the market enough time to recognize they may be missing the rocket ride and hop in.
If we don't break that neckline this week, we could pull back for another week. But I think by the end of June our neckline will break and we'll be on our way.
Best,
Stew

$UNI Breakout: 400% Target AheadCRYPTOCAP:UNI just broke out from its long-term accumulation zone around $4.000–$4.801, gaining +30% this week.
The market structure has turned bullish, with the next major target near $19–$24, a potential 400% upside.
As long as UNI holds above the breakout zone, further gains look likely.
Watch this one closely.
DYOR, NFA.

DUSK - LONG SET-UP 2x Target.BINANCE:DUSKUSDT
𝐃𝐔𝐒𝐊/𝐔𝐒𝐃𝐓
Dusk is breaking out of a long-term downtrend on the weekly chart. A potential move of +103.77% is projected, signaling a bullish reversal if the breakout holds

TIA - Super Bullish For AltseasonBINANCE:TIAUSDT
𝐓𝐈𝐀/𝐔𝐒𝐃𝐓
TIA is coiling at the tip of a falling wedge — a breakout looks imminent. Eyes on the $3.31 level for a potential 107% move if bulls take charge
