Avalanche will retest the $21.5 level ┆ HolderStatBINANCE:AVAXUSDT bounced sharply from the $21.50 support, confirming the level as a pivot zone. Previous breakout patterns remain intact, and the current price action indicates potential for a move toward $25.00 resistance if buyers maintain control.
Altseason
EPIC : Risky signal...Hello friends🙌
🔊Due to the good price growth, we have found important support points for you.
Now, due to the price correction, we have found buy points for you and you can buy with risk and capital management and move with it until the goals we have set for you.
🔥Follow us for more signals🔥
*Trade safely with us*

Solana formed the rising bottom ┆ HolderStatKUCOIN:SOLUSDT has respected the $158 key support following a structured pullback from recent highs. The setup features repeated bullish continuation patterns such as triangles and consolidation. Expect a potential move toward 184+ if support holds.

CKB Main trend. Horizontal pump channel. AI. 08 2025Logarithm. Time frame 1 week (less is not needed). Work in a horizontal channel from support/resistance zones. Pay attention to what a huge % (more than +1400%) pumped up this asset in 2024, when all the alts were and are at their minimum zones.
Local trend of the decline phase, after the pump +1400% as before. The local reversal zone, on which the medium-term trend direction (the entire market) will depend, is a coin as a projection.

Ethereum is consolidating ┆ HolderStatBYBIT:ETHUSDT is trading within a consolidation zone just under $4000 after rallying from sub-$3000 levels. The trend remains strong with prior triangle and consolidation patterns fueling upward moves. A continuation breakout may test the $4000 barrier soon.

RENDER gaining momentum As it reclaimed the 89 EMA and now it's acting as support, it might retest it once more before moving up to reclaim EMA 200
So I would say RENDER is gaining momentum again into the upper direction after showing a strong support on the green zone from the chart.
DYOR / NAFA

XRP : Will Ripple be pumped?Hello friends🙌
✅ considering the decline we had and the entire market, Ripple has also fallen like other currencies.
✅You can see that the price has hit resistance several times but failed to break it. Finally, in the last hit, which we also identified on the chart, the powerful price broke through the resistance.
✅Now, in the support area we identified on the chart, you can see that the price is supported by buyers and higher lows have been recorded.
✅Now that the price has pulled back and buyers have provided good support, you can buy in steps with risk and capital management and move with it to the specified goals.
🔥Follow us for more signals🔥
*Trade safely with us*

PROVE : PROVE Find out.Hello friends🙌
✅We have come with an analysis of the PROVE currency, which has just been listed and is in a good range. If this pattern fails, you can enter a purchase transaction in steps and with risk and capital management. We have also specified the stop loss for you and the targets are also specified...
⚠Be careful not to involve more than 1 to 2% of your capital in buying these types of currencies and be sure to manage your capital.⚠
🔥Follow us for more signals🔥
*Trade safely with us*

ETH is knocking like Walter White on that $4K levelOnce we break past this point, there’s little to no resistance-we should all be expecting an all-time high. Altcoins are going to melt people’s faces off when we break past $4K. With rate cuts anticipated, don’t miss out on this move.
ETH is holding extremely strong right now in relation to BTC, while other altcoins are still seeking their lows for this cycle. With rate cuts expected in September, ETF flows, and growing institutional interest, I believe ETH will have a crazy rally.
Once we break past this resistance from the trendline dating back to the 2021 high and close above $4K, I think we’ll start to see ETH blow past Bitcoin-and altcoins will follow.
I still believe ETH will outperform others for now, but once we get those rate cuts, I feel the bleeding will stop-and by then, the ship will have sailed.
Binance coin fixed above the $730 ┆ HolderStatOKX:BNBUSDT is testing ascending trendline support near $740 following a corrective move. The structure is still bullish with earlier breakouts from triangles and sideways zones playing out successfully. If $740 holds, a retest of $800 could unfold quickly.

SOL | Solana Game Plan - Swing Long IdeaSOL | Solana Game Plan - Swing Long Idea
📊 Market Sentiment
Market sentiment remains bullish, supported by expectations of a 0.25% rate cut at the upcoming FOMC meeting. The weakening USD and rising risk appetite across global markets continue to favor crypto assets.
We’re currently seeing a minor retracement, primarily driven by the Nasdaq’s pullback — but the overall outlook for the crypto market remains bullish in the weeks ahead.
📈 Technical Analysis
Price was rejected from the HTF bearish trendline near $207 and is now retracing.
The retracement aligns with a HTF bullish trendline, which I believe could spark a strong move to the upside.
This area also aligns with the 0.5 Fibonacci retracement level (discount zone) and a HTF demand zone — forming a strong confluence for a potential bounce.
📌 Game Plan
I want to see price hit the HTF demand zone at $152 (purple box).
It should also tap the bullish trendline.
The zone aligns with the 0.5 Fibonacci level — my key discount area.
🎯 Setup Trigger
After these levels are tagged, I’ll be looking for a 4H bullish break of structure, which should also form a new 4H demand zone for confirmation.
📋 Trade Management
Stoploss: Below swing low of the 4H demand zone
Targets:
• TP1: $188
• TP2: $207
• TP3: $297
I’ll trail my stop to lock in profits aggressively as price moves in my favor.
💬 Like, follow, and comment if this breakdown supports your trading!
More setups and market insights coming soon — stay connected!

Alt Season? Buy dips, then run it turbo. 1400 days...? Then up. It took exactly 1400 days from the previous all time high (ATH) set in alts (excluding BTC) in early Jan 2018 to break that level again in 2021 to form our current all time high resistance.
Alts have tapped the ATH set in 2021 3-4 times. And it will be 1400 days since the last all time high on September 1st.
Why do you think this time will be different?
I don't control the tape, but I trade it.
August maybe soft, but you'll remember this September and we'll be in funky town james brown price discovery before you know it. Just dont blow it. Buy liquidations and what's going up. By early Jan you'll be the man.
Ethereum is approaching the key level ┆ HolderStatKUCOIN:ETHUSDT is consolidating between $3,368 and $3,866 following a strong impulse move. Sideways range formation and trendline support hint at bullish continuation. Breakout above $3,866 may resume the upward trend toward new highs.

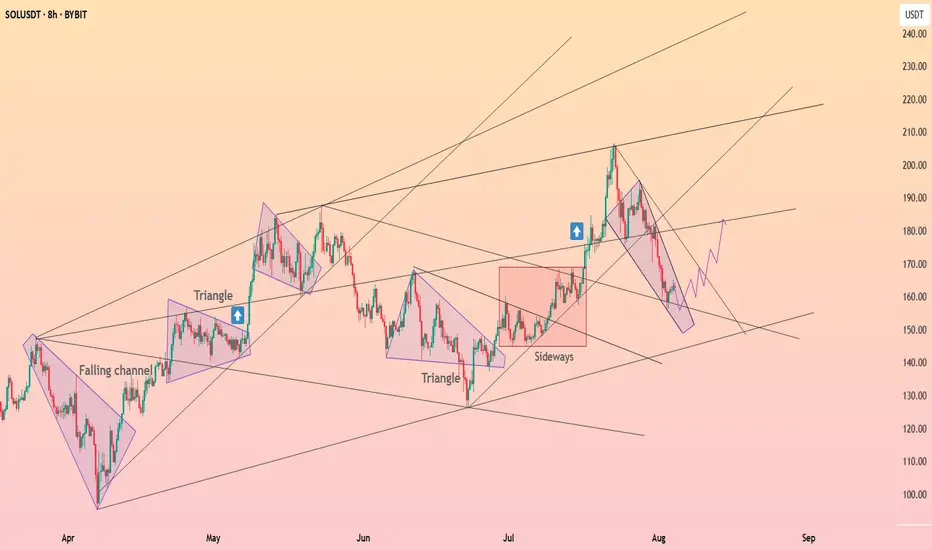
Solana is forming the falling wedge ┆ HolderStatBYBIT:SOLUSDT is moving within a falling channel after the recent drop from $200. Previous triangle breakouts led to rallies, and the current setup resembles earlier accumulation zones. A break above the channel could lead to $180 upside.
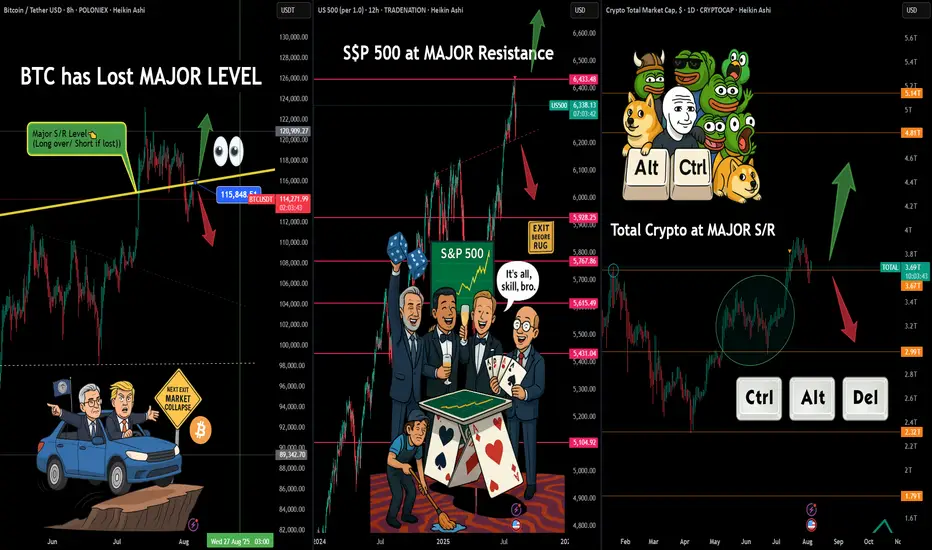
Alt-Season or Alt-Control-Delete.?🤖💣 Alt-Season or Alt-Control-Delete.? 🧠📉
The market looks like it's a bout to rug someone... and it might just be Trump.
While President Trump narrows down his Fed Chair shortlist, the real driver — Powell — is still at the wheel. But the car? It's swerving dangerously near the edge. BTC has lost a key S/R level, the S&P 500 is at major resistance, and Total Crypto Market Cap is stalling at a crucial decision point.
Despite the hype around altcoins and "recovery rallies," I’m deeply cautious. JP Morgan and Bank of America stocks might dip after Trump’s public accusations — signaling that institutions might already be repositioning. Capital tends to exit before the narrative shifts... and that shift could be incoming.
The chart says it best:
👀 BTC beneath S/R
🎲 S&P 500 gamblers partying at resistance
🧠 Meme coin mania while total crypto hits S/R
🧨 Trump’s signaling right, but Powell might yank the wheel left...
This could all be the calm before a liquidity flush.
Stay sharp, don’t follow the crowd — follow the capital.
That said , Bitcoin remains my favorite asset — especially in times of systemic risk. Remember what history shows us: when banks stumble or go bust, Bitcoin tends to rise. If there's one asset in the world I want to carry through a storm, it's Bitcoin. The decentralized antidote to centralized chaos.
One Love,
The FX PROFESSOR 💙
ps. we might see a breakout and Fomo for good reasons...why not? but for now my charts are screaming: CAREFUL!
Disclosure: I am happy to be part of the Trade Nation's Influencer program and receive a monthly fee for using their TradingView charts in my analysis. Awesome broker, where the trader really comes first! 🌟🤝📈
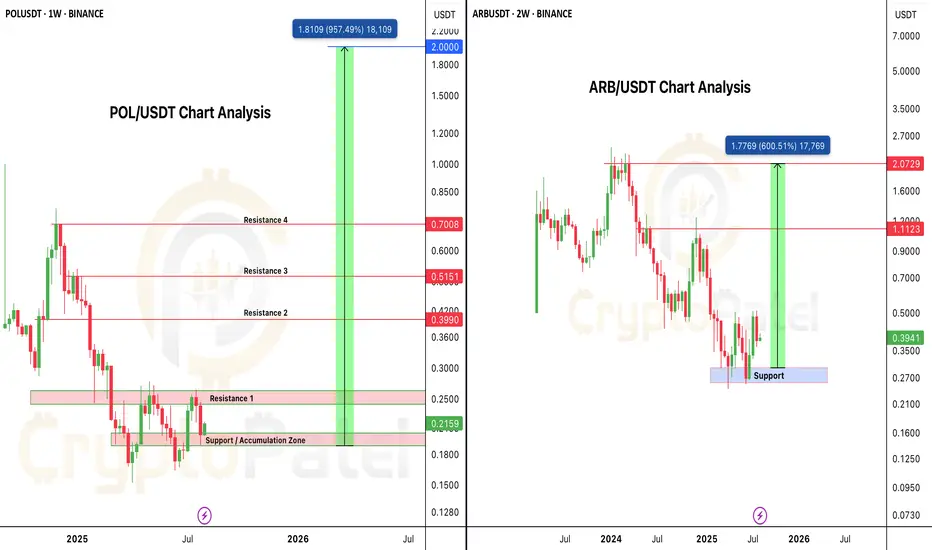
Altseason is Loading... Which One’s Your 10x Pick – $POL or $ARB🚨 BULL MARKET ACCUMULATION ALERT 🚨
Both PSX:POL and AMEX:ARB are currently trading below $0.40, and both charts are showing strong long-term bullish structure.
PSX:POL Analysis:
• Current Price: Under $0.40
• Strong Entry Zone: $0.20 – $0.17
• Bull Run Targets: $2 – $5
• Backed by powerful fundamentals, strong tech, and serious investors.
AMEX:ARB Analysis:
• Current Price: ~$0.40
• Key Accumulation Zone: $0.40 – $0.30
• Bull Run Targets: $2 – $5
• One of the strongest L2 ecosystems with deep liquidity and solid fundamentals.
Both are technically oversold, fundamentally strong, and positioned for major upside in the coming altseason.
Question for the community:
Which one hits $2 first — PSX:POL or AMEX:ARB ?
Drop your pick below 👇
NFA & DYOR
Which altcoin hits the $50 club first? $INJ or $DOT? Which altcoin hits the $50 club first? CRYPTOCAP:INJ or CRYPTOCAP:DOT ? 🚀
3W HTF Technical Breakdown:
1⃣ CRYPTOCAP:INJ (@injective )
✔ Reclaimed structure above $13.31
✔ Targeting $31 → $52.98
✔ Clean 385% R:R setup
⚠ Invalidation below $8.79
2⃣ CRYPTOCAP:DOT (@Polkadot )
✔ Bounced from multi-year TL + demand zone
✔ Hold above $3: Targets $16.67 → $24.37 → $55
✔ Monster 1,660% setup loading
Both charts are screaming high-conviction breakout.
The $50 race is on…
NFA & DYOR

BTC.DChart Overview (1D TF – BTC Dominance):
1. Pattern in Play: Rising Wedge (Bearish Bias)
The chart shows a rising wedge pattern forming with:
Support line (PA (D)s) in blue, sloping upwards.
Resistance line (PA (D)r) in red, also sloping up, but less steep.
This pattern typically has a bearish outcome, especially when formed during a downtrend as we see post-June.
Price is nearing the apex of the wedge, meaning a breakout (likely down) could be imminent.
2. Key Horizontal Support and Resistance Levels
Support at 60.27%: Price previously bounced from this level—very significant zone.
Resistance at 61.89%: Acting as a key ceiling; price got rejected here recently.
66.03% (Top Black Line): Major macro resistance and the 2025 peak trendline intersects near that level around October.
3. Trendlines and Long-Term Context
Macro Uptrend Support in red intersects around the 61.89%–62% zone in early October. If dominance holds this zone and bounces upward from the rising wedge, this trendline becomes crucial support.
Previous Uptrend Line (purple) was broken significantly in June, which triggered the sharp drop. BTC dominance lost momentum and is now in recovery/decision zone.
Interpretation:
Short-Term Bias: Neutral to Bearish
As price is within a rising wedge post-downtrend, the probability of breakdown is higher.
Failure to break above 61.89% again and maintain momentum suggests downside towards 60.27% or even 58.60%.
Medium-Term Possibility:
If price breaks down from the wedge, support zones are:
60.27%
Then 58.60%
If price breaks up, it will need to reclaim 61.89% cleanly, then test toward 64%–66%.
Macro Trendline Intersection (~Oct 13): Could be a major decision point aligning with fundamental crypto market catalysts. Dominance could break sharply above or below that time depending on broader crypto cycles.

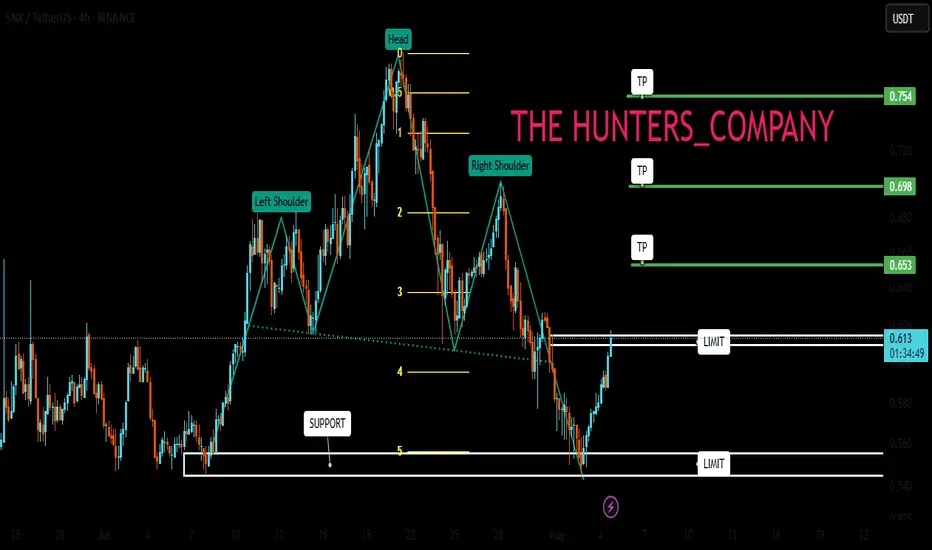
SNX : Has the climb started?Hello friends🙌
👀According to the shoulder and shoulder pattern that was formed and then the price fell in the support area that we identified for you with Fibonacci, buyers entered and provided good support for the price, which also broke our resistance, which creates a good opportunity to buy, of course with risk and capital management.
🔥Follow us for more signals🔥
*Trade safely with us*
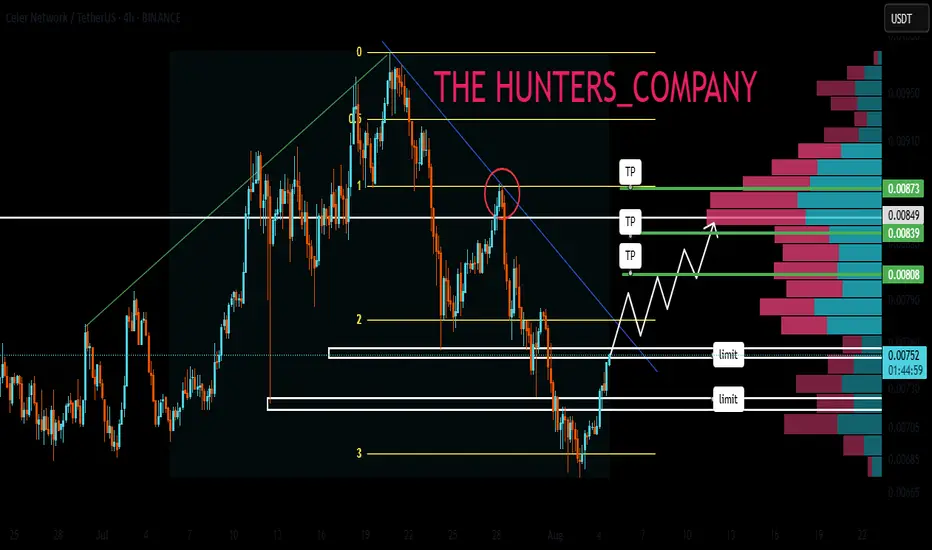
CELR : Sensitive areaHello friends🙌
✅Considering the decline we had, you can see that the price has been well supported in the support area drawn with Fibonacci and now it seems that it wants to go up to the specified ranges, which are also good and high-volume ranges, and these areas are like magnets for the price.
✅Don't forget risk and capital management.
🔥Follow us for more signals🔥
*Trade safely with us*
MAGIC : Magic is neededHello friends🙌
📈Given the good rise we had, the price is now in the ascending channel, now in the specified support areas, you can buy in steps with risk and capital management and move to the specified targets.
🔥Follow us for more signals🔥
*Trade safely with us*

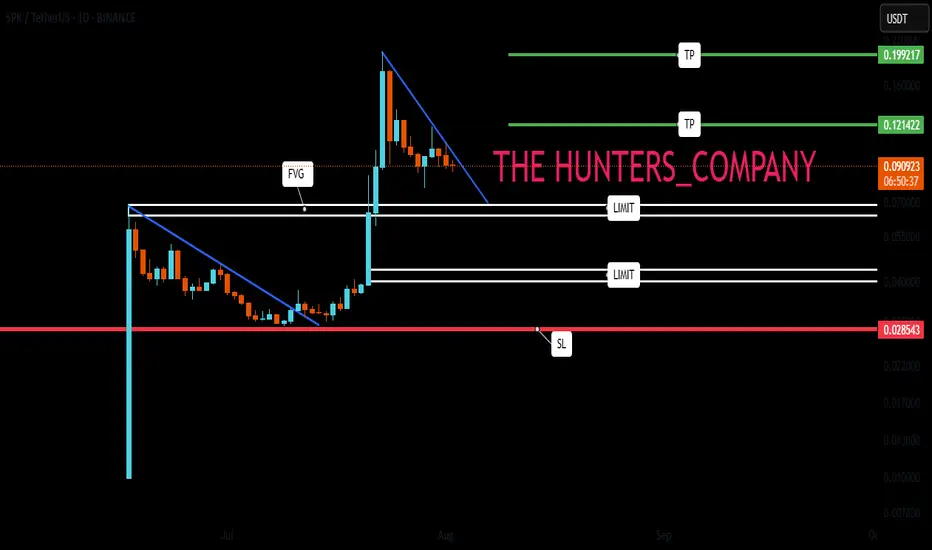
SPK : Does history repeat itself?Hello friends🙌
✅You see that once a pattern was formed and after the resistance was broken, we had a good growth.
✅Now the same pattern has formed again and the price is in the accumulation phase.
✅We have to see if history repeats itself and if the buyers support the price again or not.
✅We have obtained important support areas for you, so that if it falls, you can buy in steps and if the pattern breaks, you can buy in steps right here, of course with capital and risk management.
🔥Follow us for more signals🔥
*Trade safely with us*
CFX : don't be afraidHello friends🙌
If you take risks, you will win. If you don't, you will regret it.
✅Given the good price growth, now that the price is in a correction phase, there is a good opportunity to buy with risk and capital management, of course, at the specified support levels and move with them to the set targets.
🔥Follow us for more signals🔥
*Trade safely with us*