ETH ANALYSE We have two key levels to watch on ETH:
- Either the price reacts upwards on the $2401 level in H4,
- Or it falls further and reacts at the $2,121 Daily level.
Either way, the fall should not last too long.
Altseason

HolderStat┆BNBUSD 645 gate opens 730BNB price surged out of a steep falling channel and later coiled inside a tight consolidation rectangle, igniting a vertical drive that now hovers under the 645 USDT horizontal cap. Holding the breakout origin at 600‑610 keeps the upside narrative intact; clearance of 645 exposes the 720‑730 objective derived from the earlier channel depth.

HolderStat┆ADAUSD down‑trend break, $1 goalCardano price popped its lengthy descending channel, using a 0.62‑0.78 consolidation base as springboard to reclaim 0.78 USDT. Provided buyers defend that level, the move unlocks an advance into the 0.95‑1.00 resistance ribbon flagged above. A close beneath the rising guideline from April lows would dampen, but not invalidate, the emergent ADA breakout.

HolderStat┆XRPUSD retest complete, $3 aheadXRP price completed a clean wedge breakthrough at 2.5 USDT, snapped back for a textbook retest on the same line, and has since printed a series of higher lows. Momentum favors continuation toward the 2.9‑3 k supply shelf shaded on the chart. Failure to hold the reclaimed trendline would neutralize, but not yet reverse, the present bullish bias.

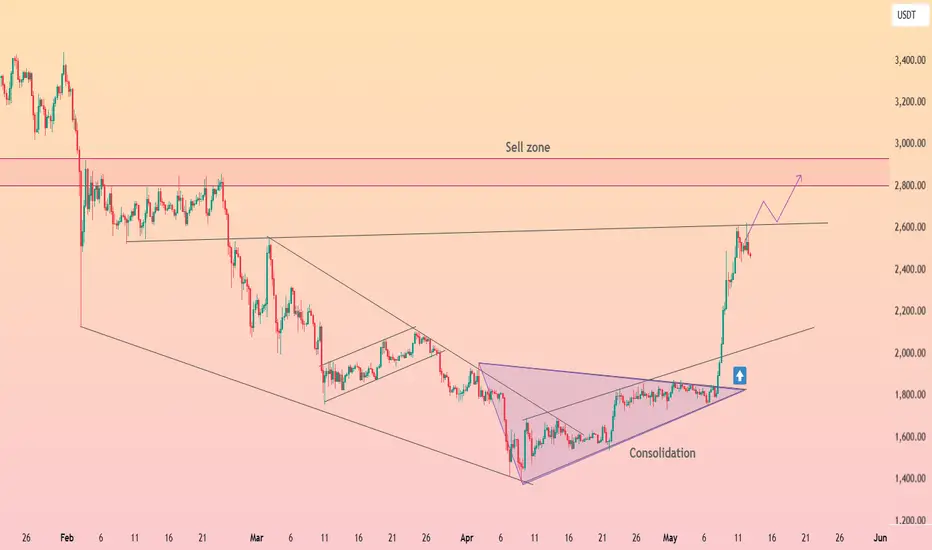
HolderStat┆SOLUSD 180 $ flip, 200 $ nextSolana price escaped April’s consolidation box, flipped the old down‑sloping resistance into a rising support line, and is now pressing the 180 $ ceiling inside a well‑defined growing channel. A decisive daily close above 180 transforms that barrier into a launch pad, opening the measured channel extension toward 200‑205 $. Channel lows near 150 remain key invalidation for the bullish momentum.

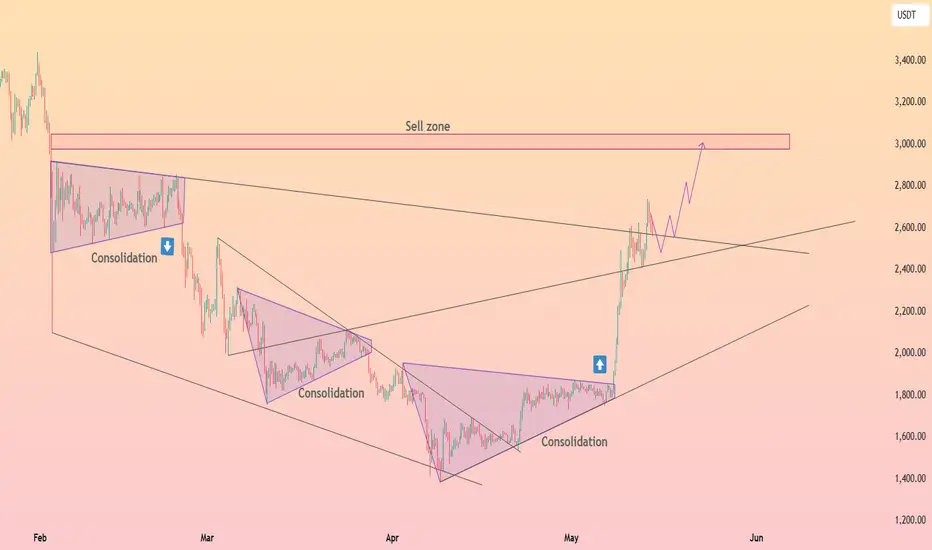
HolderStat┆ETHUSD wedge catapult toward 3kEthereum price tore out of its multi‑month falling wedge and smaller consolidation triangle, blasting through the mid‑2 k range before pausing around 2.7 k. As long as price respects the former wedge roof as trendline support, bulls retain scope to probe the highlighted 2.8‑3.1 k sell zone. A soft pullback into 2.4‑2.5 k would be viewed as a constructive retest rather than trend failure.
Altcoin Market Holding Strong – Breakout on the Horizon!📈🚀 Altcoin Market Holding Strong – Breakout on the Horizon! 🌈📊
Hey Traders!
The altcoin market is gearing up for a powerful breakout! TOTAL3 (the altcoin market cap excluding BTC and ETH) is holding perfectly above the critical $893B support zone. This is exactly the kind of price action we expect before major upside explosions!
📊 Key Levels to Watch:
📍 Support Holding Strong: $893B – Bulls are defending this level with conviction.
🚀 Breakout Zone: A clear move above $900B sets the stage for a rapid surge toward $1.13 Trillion, a potential +25% rally!
✅ The structure is bullish, momentum is building, and the charts don’t lie—this market wants higher!
📚 Why This Time Feels Different:
BTC dominance is struggling at resistance—this is the perfect environment for altcoins to shine! 🌟
Real crypto projects are finally starting to show strength amid all the meme coin noise.
We’ve seen this setup before… and it led to explosive alt rallies. History may not repeat perfectly, but it sure loves to rhyme! 🎯
💬 Your Next Move:
Are you already positioned for this altseason breakout, or planning your entries now?
Which altcoins are you most bullish on for this run to $1.13T and beyond?
This is the moment serious traders wait for—don’t let it slip by! The market is loading the rocket… will you be on it when it takes off? 🚀
One Love,
The FXPROFESSOR 💙

BTC bull cycle comes to an end.We can see it clearly on the chart. BTC has ended the 5 waves pattern in Elliot wave count. you can see it on the chart, you can see it on the MACD & RSI.
What we are seeing now is that because of Greed & Hype no one is selling bitcoin. the up-trend we are seeing now is the result of no sellers and Hype Buyers. This is a bull trap. We can see the divergence clear as day. Stay alert and dont let them catch you this time.

I see ETH break the trend lineETH owner buy enough coin in their wallet with breaking the descend line.

APEX Main trend. DEX exchange Bybit. Hype and super pump 05 2025Logarithm. Time frame 1 week. Correction (descending channel, two distribution zones) after a super pump of about 1500%. All key support and resistance zones were shown, including dynamic ones.
Also showed a local target in percentage in case of exit from a local descending wedge. There is a possibility that the price will enter the mirror support zone of the previous volatility zone of the horizontal channel, or even to the median (green dotted line). Just remember this. When working with the crowd hype, remember the risks.

Altcoins are in a similar channel as in 2022–2023.I believe that as long as the interest rate stays at 4.5%, we won’t see real growth in altcoins — only short-term pumps. Rate cuts are expected to begin in the summer, but it will take some time to have an effect. I would compare the current market to both 2019 and 2022.

Decided to enter Zerebro for the public portfolio.Decided to enter Zerebro for the public portfolio; AI agents are growing well. Potential upside: +140%.
Zerebro (ZEREBRO) is a decentralized AI system on the Solana blockchain, creating and distributing content across social media and crypto communities. Using RAG technology, it generates unique texts, NFTs, and memes, avoiding templates. Operates on X, Instagram, Telegram, integrated with Solana, Polygon, and Bitcoin. Token price: ~$0.05, market cap: ~$50M.

Having a Mini ALT pump -but it may not last much Longer -CAUTION
The main chart is the Daily BTC PA and the BTC DOMINANCE ( BTC.D ) super imposed below, for the same period.
When BTC.D Drops and BTC PA remains stable, we see ALTS increase in Value, Mostly.
On the main chart, you can see that in Nov 2024, Till Dec, we had a mini ALT seasons and we are having another now
But will this last ?
If we look in more detail at the BTC.D chart below, we can get some ideas
Will it Last ? I do not think so.
We are on two areas of strong support right now.
The 618 Fib extension has provided support already and PA bounced. In fact, at time of writing, Many ALTS are in the RED on an hour chart. We need to watch and see where we go in the next 7 hours
Should this Fib extension Fail, Just below is a longer term line of support.
SO, I would head towards a High rate of Caution with the ALTS right now.
Does this mean that Bitcon will push higher ?
The potential is there, YES
High Level of Caution for th eALTS right now

ALTSEASON is here!The Crypto Total Market Cap (excluding the Top 10 coins) broke above the 1D MA200 (orange trend-line) and is consolidating on an overbought 1D RSI (>70.00).
Since October 2023 when this set of conditions emerge, the long-term Channel Up starts a rally (technically its Bullish Leg). This is what in the crypto world is known as 'Altseason',which is when the lower cap coins see enormous gains relative to the top 10.
The last Bullish Leg (2024) rose by +200%. The previous one, even more. If it 'just' repeats the +200% Leg, we are looking at a market cap of $525 Billion.
The time to invest in alts is now!
-------------------------------------------------------------------------------
** Please LIKE 👍, FOLLOW ✅, SHARE 🙌 and COMMENT ✍ if you enjoy this idea! Also share your ideas and charts in the comments section below! This is best way to keep it relevant, support us, keep the content here free and allow the idea to reach as many people as possible. **
-------------------------------------------------------------------------------
💸💸💸💸💸💸
👇 👇 👇 👇 👇 👇

HolderStat┆SOLUSD fixed above the trend lineSOL spent March in a messy consolidation box before rotating into a disciplined rising channel that has marched price from 110 to the doorstep of 180. Bulls are now wrestling with that major horizontal barrier; acceptance above it would turn the former ceiling into fresh support and open the calculated channel extension toward 205. Until channel lows around 150 give way, trend traders may lean on pullbacks inside the lane to stay positioned with momentum. 🔥

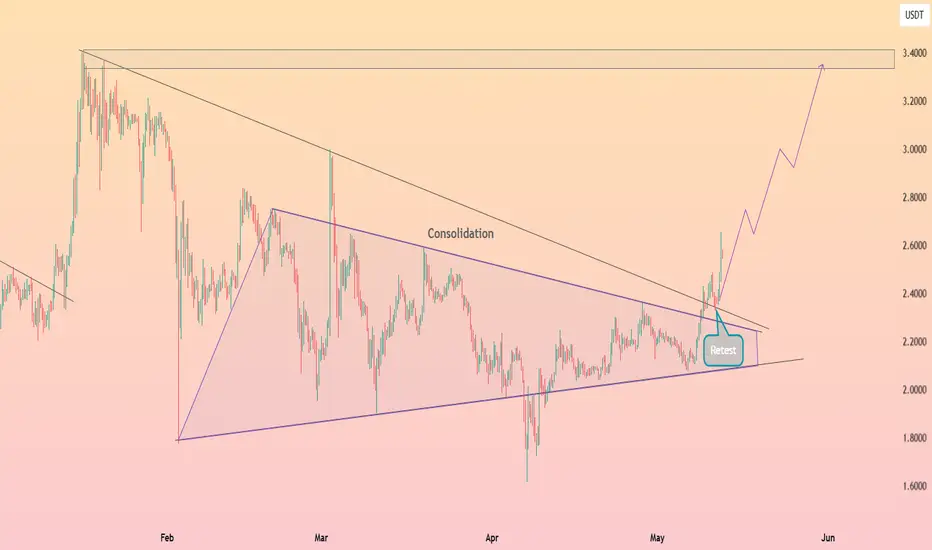
HolderStat┆XRPUSD broke the downtrend📈 XRP compressed for weeks inside a contracting triangle, posting a series of higher lows beneath a stubborn down‑sloping ceiling. Early May produced the decisive break, with price flipping the 2.3‑2.4 zone and immediately returning for a clean retest that held on a dime. The pattern implies energy is stored for a measured move toward the 3.4 resistance band highlighted on the chart; invalidation rests beneath the reclaimed trendline, keeping risk tight.
HolderStat┆ETHUSD retest $2500 After months locked inside a broad falling wedge, ETH erupted in early May, blasting through both the wedge roof and an internal consolidation triangle. The vertical thrust carried price from 1.8 k straight to 2.6 k, where a key horizontal lid now tests bulls’ resolve. Short‑term dips back toward the broken trendline or 2.2 k support would look constructive while momentum targets the well‑flagged 2.8‑3 k sell zone overhead. 🎯
IOTA Could Be On The Way Back To December 2024 HighsIOTA with ticker IOTUSD made sharp and impulsive rally at the end of 2024, which we see it as a first leg (A)(1) of a bigger recovery in minimum three waves (A)(1)-(B)(2)-(C)(3). Since the beginning of 2025, Crypto market slowed down and IOTA made a deep retracement, but in three legs ABC with an ending diagonal/wedge pattern into wave C, which indicates for a correction in wave (B)(2).
Well, it nicely bounced recently, making a clean five-wave impulse away from projected 78,6% Fibonacci support and back above channel resistance line, so it can be wave 1 of a new five-wave bullish cycle within higher degree wave (C) or (3). That said, after current pullback in wave 2, be aware of more gains for wave 3 of a five-wave bullish cycle that can send the price back to December 2024 highs this year.

$ENA Finally Breaks Out – Retesting Before Next Leg Up!!MIL:ENA eventually broke through the adamant trendline resistance.
following repeated rejectionsPrice is now backing off slightly, testing the Fib area and breakout formation.
Holding at this level positions it to make a clean run to $0.48–$0.50+This chart is on the rise again ????
Follow for more updates
DYOR, NFA

Valuable Demand Zone Amid Weak Market ConditionsLTCUSDT Analysis: Valuable Demand Zone Amid Weak Market Conditions
I believe the blue box in LTCUSDT is highly valuable as a demand zone. Given the overall market conditions are not strong , I’ve identified a lower entry point that aligns with more favorable risk-reward scenarios.
This blue box stands out due to its significance from multiple perspectives . I used heatmap , cumulative volume delta (CVD) , and volume footprint techniques to accurately define this zone as a potential buyer area.
Key Points:
Market Conditions: Currently weak, favoring conservative entry levels.
Blue Box: A carefully identified high-value demand zone.
Techniques Used: Heatmap, CVD, and volume footprint for precise demand mapping.
If you'd like to learn how I use these advanced techniques to define accurate demand zones, just DM me!
If you think this analysis helps you, please don't forget to boost and comment on this. These motivate me to share more insights with you!
I keep my charts clean and simple because I believe clarity leads to better decisions.
My approach is built on years of experience and a solid track record. I don’t claim to know it all, but I’m confident in my ability to spot high-probability setups.
If you would like to learn how to use the heatmap, cumulative volume delta and volume footprint techniques that I use below to determine very accurate demand regions, you can send me a private message. I help anyone who wants it completely free of charge.
My Previous Analysis
🐶 DOGEUSDT.P: Next Move
🎨 RENDERUSDT.P: Opportunity of the Month
💎 ETHUSDT.P: Where to Retrace
🟢 BNBUSDT.P: Potential Surge
📊 BTC Dominance: Reaction Zone
🌊 WAVESUSDT.P: Demand Zone Potential
🟣 UNIUSDT.P: Long-Term Trade
🔵 XRPUSDT.P: Entry Zones
🔗 LINKUSDT.P: Follow The River
📈 BTCUSDT.P: Two Key Demand Zones
🟩 POLUSDT: Bullish Momentum
🌟 PENDLEUSDT.P: Where Opportunity Meets Precision
🔥 BTCUSDT.P: Liquidation of Highly Leveraged Longs
🌊 SOLUSDT.P: SOL's Dip - Your Opportunity
🐸 1000PEPEUSDT.P: Prime Bounce Zone Unlocked
🚀 ETHUSDT.P: Set to Explode - Don't Miss This Game Changer
🤖 IQUSDT: Smart Plan
⚡️ PONDUSDT: A Trade Not Taken Is Better Than a Losing One
💼 STMXUSDT: 2 Buying Areas
🐢 TURBOUSDT: Buy Zones and Buyer Presence
🌍 ICPUSDT.P: Massive Upside Potential | Check the Trade Update For Seeing Results
🟠 IDEXUSDT: Spot Buy Area | %26 Profit if You Trade with MSB
📌 USUALUSDT: Buyers Are Active + %70 Profit in Total
🌟 FORTHUSDT: Sniper Entry +%26 Reaction
🐳 QKCUSDT: Sniper Entry +%57 Reaction
I stopped adding to the list because it's kinda tiring to add 5-10 charts in every move but you can check my profile and see that it goes on..

ETH is backETH says: Hey you there! I am still alive.
ETH.D bounced off a multi-year top. The altseason is inevitable. Fasten your seat belts ...

BTC.D is started to melting downThe MARKETSCOM:BITCOIN dominance bounced off a very critical level. It seems that the altseason is just started. The upcoming altseason will be face melting. Fill your bags with valuable alts ...

WIF/USDT - Fresh meme coin. Trading setup in chanal. Popular fresh meme coin – Dogwifhat
📊 CoinMarketCap Rank: #102
🐦 Twitter (X) : 152K followers
💬 Telegram : 50K members
✅ Highly liquid meme coin – traded on many major exchanges, including Binance.
After the hype phase , the coin is now declining along with the overall crypto market —no exceptions. Essentially, it broke below multiple channel supports , and the price is now sitting at the support of the outer channel.
I also notice a non-textbook Head & Shoulders pattern, which suggests a potential -64% breakdown . The last squeeze happened around this level.
Currently, we are seeing consolidation with increased volume , along with high-wick price action in this zone.
I've marked potential downside support zones as well as upside resistance targets on the chart. Consider this in your trading strategy!
