Bitcoin Dominance - the two scenarios!Bitcoin dominance continues to rise after breaking out of a rising wedge pattern on the weekly chart. It has now also broken through the 0.786 Fibonacci level.
Next stop is Rectangle 1, where Bitcoin dominance is expected to reach 68% — and most likely, this will mark the top of dominance before it starts to drop, triggering a historic altcoin season.
Scenario 2:
Dominance keeps pushing higher toward Rectangle 2, potentially surpassing 70%. At that point, many altcoins may form new lows, and weak projects could get wiped out.
Fear in the market will hit extreme levels —
but that could signal the beginning of an altseason and the collapse of BTC dominance.
Best regards Ceciliones 🎯
Altseason

TOTAL2 + TOTAL3 + OTHERSALTSEASON is the essence of the market and is inevitable!
TOTAL2 + TOTAL3 + OTHERS 💹

XTZ Secondary Trend. Channel. Wedge. Capitulation Zone. 07 05 20Logarithm. Time frame 1 week (less is not necessary).
The secondary trend has formed a horizontal channel for several years, with repeating wedge-shaped formations, the third time we entered under the support of this channel not by squeezes to collect long stop-loss, but by full candles and the structure of a descending wedge. It looks more vertical. The corrective movement to this semi-vertical wedge, quite possibly, will similarly have an aggressive character. The wedge is almost in the final phase of its formation. I showed percentages for clarity to the key reversal zones, for orientation for your money management and setting the first medium-term, and possibly local targets.
The main trend of this previously hyped cryptocurrency since 2017
XTZ/USD Main Trend. Descending Channel 01 2023

XRP on the Brink: Hold $2.11 or Break to $2.36+? Massive move incoming — if XRP holds $2.11, $2.19 is next. Break that and we could hit $2.36 before the real moonshot. But drop below $2.11? Expect a test of $2.00 before a rebound to $2.30+.
Kris/Mindbloome Exchange
Trade Smarter Live Better

PEPE | BULLSH | ALT can +150%PEPE seems to have bottomed out after flashing bullish signs on the chart.
Once we close ABOVE the 50 day moving averages (green line) in the weekly timeframe, that's when we'll know the bullish action is full steam:
Make sure you don't miss the update on BTC here:
______________________
BINANCE:PEPEUSDT

$BTC support zoneCRYPTOCAP:BTC has broken out of a falling wedge and is now consolidating above the key $91K support zone.
- Eyes are now on the All-Time High at $ 109 K.
- Once that breaks, a price discovery rally toward $ 120k+
It is highly likely. 🧠
- The chart looks.
DYRO, NFA

TOTAL2 - Daily Rounded TopA Rounded Top structure
these patterns usually break out to the bullish side once completed as shown with the arrow
Right now this structure has perched itself above an MA and is looking to move higher
Good buy into alts right now in hopes of an altseason

Did Small Cap Altcoins Bottomed In?Hello, Skyrexians!
It's not a secret that we are waiting for Bitcoin dominance drop to at least 62% right now, but after that we expect the final shakeout to 67%, but the CRYPTOCAP:OTHERS.D gave us a hint that may be this shakeout will not affect on low cap alts that much like on top-10.
Let's take a look at the 12h time frame to see the waves in details. After a large wave 3 we have seen the triangle correction in wave 4, after that price showed the impulsive structure in wave 5. Subwaves 3 and 5 formed divergence with the Awesome Oscillator. Yesterday's dump looks like the deep wave 2 inside new impulse to the upside. Green dot was formed on the Bullish/Bearish Reversal Bar Indicator which confirms the further growth scenario.
Best regards,
Ivan Skyrexio
___________________________________________________________
Please, boost this article and subscribe our page if you like analysis!

APE Main trend. Channel. Wedge. Reversal zones 05 05 2025Logarithm. Time frame 1 week.
1️⃣ Decline from the maximum by -98% , which is acceptable for assets of such liquidity and capitalization, after that either a trend reversal (main), or a complete scam.
2️⃣X (twitter) of this crypto project has 473 thousand subscribers . This army will be sent to pump this cryptocurrency at the right time in the so-called 3rd alt season of this cycle.
🟣And now work with a breakout of the descending wedge, and the price movement to the resistance of the descending channel. The percentage locally - medium-term showed for clarity from two zones - scenarios.
3️⃣The third plus is that this cryptocurrency is traded on 4 liquid exchanges: binance, bybit, okx, and most importantly Coinbase.
Line chart (trend direction and liquidity).

BTC.D(based on NEo wave)I changed my idea about midterm but not about longterm!
Altseason will make a heavy downtrend for this in a few months later which I call it wave E

WHY WILL IT GO HIGH?Reasons indicating strong potential:
- Large and active community on social media
- High scammer activity
- Trap for inexperienced users: selling on DEX at 3x lower price than on CEX due to low DEX liquidity
Let me know if you'd like it even more formal or formatted for a report.

$BR/USDT just broke out$BR/USDT just broke out of a major resistance zone after weeks of compression inside an ascending triangle 📈
Now holding above the breakout level, with a clean 100% upside potential mapped.
If the Bulls defend this zone, the next leg could be explosive.

ALERT: ALT SEASON INCOMING? 🚨 ALERT: ALT SEASON INCOMING? 🚨
Take a close look at the BTC/ETH chart — we’re seeing early signs of a major rotation out of Bitcoin and into Ethereum and altcoins. Historically, when the BTC/ETH ratio starts to fall, it's a clear signal that capital is flowing into altcoins, marking the beginning of alt season.
🔍 The ratio is showing bearish divergence and approaching a key support zone. If this level breaks, ETH is likely to outperform BTC significantly — and we all know what follows: altcoins explode.
📉 BTC dominance is stalling, ETH gaining strength, and altcoins are waking up. The market is shifting. Don't get caught late.
🚀 Get ready. The alt season might just be starting now.
#AltSeason #Crypto #BTC #ETH #TradingView #CryptoTrends

Bitcoin dominance and the altseasonIn this chart, you can see the Bitcoin dominance from 2017 till now.
The depth of the altseason was 35.14% and for the bear market we went up, up to 73.02.
If we take a Fibonacci retrace level, we can see during 2021 altseason we were only retraced 0.893 or 89.3% what we lost during bear market.
It was something new and for the first time, Bitcoin Dominance didn't make the new all time low.
Following the same fact, I decided to find the possible levels for bitcoin dominance to top. we are getting closing the the 0.786, this level usually the last level that we could be bearish in any chart, however remember that last altseason we passed 0.786 but rejected at 0.893.
My opinion would be we are reaching to the top of Bitcoin dominance sooner than later, I can easily see Alts are reversing from bearish in short term and BTC Dominace Maxing in stoch RSI.
When you stay longer than usual in max excitation in stoch RSI you will be doing longer in opposite direction as well
Max BTC dominance can reach 66.2%
However, worse case scenario I am expecting at least BTC Dominace during altseason drop to 49.14% which is a historical support and also resistance during BTC season and Alt Season.
Ideally, we should go down up to 45.30% as it would be the 0.786 of the range from 39.9% to 66.2%
However, if we are able to make a new All time low in BTC dominance first idea place to see rejection or reaction would be 32.38%

$SIGN Waking Up — Breakout Looks CleanSIX:SIGN is waking up 👀
It broke out of the downtrend clean move above $0.09
That old resistance? Now acting as support. That’s a good sign.
Price is holding above the MA, buyers are in control.
Next stop? $0.105 to $0.12 range.
This could be just the beginning.
Keep it on your radar.
#ALTSEASON #GEM

Is going as it shouldEverything is going according to plan. We are just waiting for the moment of a sharp upward leap...

Beyond FOMO: Strategic Analysis of BTC.D and Market ProspectsLet's begin by examining CRYPTOCAP:BTC.D on the monthly timeframe. Here we see the old EXP model, which formed in December 2020. This model reflected the decrease in bitcoin dominance during 2020-2021. For our current analysis, we're interested in the level of the first point — 73.02%.
On the weekly timeframe, we see an AMEXP model that formed in January 2023 and effectively describes the entire current upward trend.
Note the price reaction from the model levels of 51.7% and 59.64%. Within this model, we have two more upper levels: 68.9% and 90.36%.
The dominance level of 90.36% seems unrealistic from a common sense perspective: such a scenario is only possible with a total collapse of the entire crypto market, when all assets (including bitcoin) would depreciate to the point where bitcoin's capitalization would constitute 90% of the entire market. I hope we never see these values. However, reaching the 68.9% level seems quite likely.
Most likely, the price will try to break through the 68.9% level (we may see a bounce from this level, which might be mistakenly perceived as the beginning of a new alt season). After that, the price will likely make a new maximum and rise above the 73.2% level. And only then will we finally see the formation of a downward trend in bitcoin dominance.
What might be happening in the market if our bitcoin dominance analysis proves correct?
Let's look at the #BTC chart, where the expansion model was validated on the weekly timeframe (green model):
According to the model levels, we can expect growth to at least $109,354, and at maximum — to a new all-time high (ATH) with targets of $115,116, $116,757, and even $152,723 or $174,102 (although the probability of reaching the last two targets, despite their presence in the model, is relatively low).
If we look at CRYPTO:ETHUSD , the picture looks significantly worse — the asset is in a deep bearish phase.
Against the backdrop of general positive sentiment, CRYPTO:ETHUSD may grow to $2 059 or even to $2 626, but we will consider this merely as a bounce. We can only talk about a real trend change when the price moves beyond the yellow model.
Everyone is waiting for the reversal of bitcoin dominance (we have only calculated the most probable reversal point), as its exponential growth should be replaced by the long-awaited alt season.
However, few consider a possible negative scenario: the correction of bitcoin dominance may occur against the backdrop of a general market decline, where bitcoin will fall faster than altcoins. Against the background of growing macroeconomic uncertainty (problems in the global economy have not disappeared, they continue to accumulate, and no matter how they try to "postpone" them — this will not pass without a trace), we consider the negative scenario to be the main one.
For the past year, everyone has been saying that bitcoin is a super-reliable asset, and if something goes wrong — you need to buy bitcoin. Most retail investors love bitcoin and hate altcoins — largely because they have many unprofitable altcoins in their portfolio and no bitcoin. Each time, missing the moment to buy bitcoin, they succumbed to FOMO. Now, as bitcoin moves toward a new maximum, everyone is rushing to buy it again.
At the same time, we have a market where 80-90% of participants are in large losses. For most assets to just break even (not to mention profits), they need to grow by 300-400%.
Of course, we're not saying everything will necessarily be bad, but we prefer to stick to a strategy that primarily takes into account the negative scenario. For now, we will refrain from investment positions and give preference exclusively to speculative ones.

Altcoin Breakout or Breakdown? Key Levels Ahead🤔📉📈 Altcoin Breakout or Breakdown? Key Levels Ahead 🚨🧠
Hey Traders! Let’s talk about what’s really going on in the altcoin scene 👀
We’re still in a heavy Bitcoin-dominated market (BTC.D at 64%), but TOTAL3—the market cap for altcoins excluding BTC and ETH—is setting up for something big.
📊 We’re currently trading in a tight range between $740B support and $779B resistance—both key Fibonacci levels. Sound familiar? That’s because we were in the exact same range back on Nov 24, right before a major move! 🌀
➡️ A confirmed breakout above $780B could send TOTAL3 surging toward the next major resistance at $929B.
⬅️ But if $740B breaks, we’re eyeing a move down to $641B, where crucial trendline support comes into play.
Zooming out, altcoins are still licking their wounds from the trillion-dollar highs. The space has been wild: Trump tokens, meme coin madness, the OM token collapse—volatility is the name of the game. But are you still bullish on real, utility-driven projects?
💬 Let’s discuss:
Are you riding this altcoin wave, or sitting on the sidelines until the storm passes?
Do you have faith in 'Crypto' and can the good projects make history, or will the market suffer indefinitely from Presidents launching meme tokens, Fartcoins and Pumpfuns dominating a space with no ethics or loyalty?
🔗 Check the chart and share your thoughts below.
One Love,
The FXPROFESSOR 💙

CHILLGUY Looks Super Bullish (1D)Note: This is a highly volatile meme coin. Risk management and capital management should not be forgotten.
It appears that a large-scale corrective wave has ended, and the price has entered a bullish wave of the same degree.
Recently, we observed a bullish CH (Change of Character) and a clean break above a resistance zone on the chart. Currently, the price is approaching a supply zone, and a significant amount of sell orders have entered CHILLGUY. A short-term correction is expected, after which the bullish move is likely to continue.
If the price reaches our marked entry points, we will enter a buy position in spot.
Targets are indicated on the chart.
The closure of a daily candle below the invalidation level will negate this outlook.
For risk management, please don't forget stop loss and capital management
When we reach the first target, save some profit and then change the stop to entry
Comment if you have any questions
Thank You

ZK Secondary trend.-82% Wedge. Reversal zones. 01 05 2025Logarithm. Time frame 3 days. Decrease from listing about -82%. For cryptocurrencies of such liquidity and capitalization, this is not the maximum decrease (-90-96%). But sometimes from such values as now (-82-85%), taking into account the news hype during the listing "whales $ 458 million", a reversal and strong pumping can occur under the market as a whole. For example, like another hype project of "hanging noodles" - Flare (distributed to XRP holders). Decrease by -82% and then pumping slightly above the listing price under the next alt season of the cycle + 560%.
This does not necessarily mean that this will happen, this is an example of what happens from such values of decline with such liquidity and hype. In some ways, not only in the structure of the TA formation, but in the hype and disappointment of "investors", the projects are identical.
Main trend , and the previously shown zone, in which the price is now.
ZkSync Main trend. L2 for ETH. $458 million funds 21 02 2025
Main trend now in the moment (full trading history).
There is no need to guess the minimums and maximums. It is important to know these zones and have an acceptable average price, from the position of the trend and its potential. It is regulated by the distributed entry volume (in advance) at potential reversal zones.

others dominance altcoins Others Dominance #Altcoins 🌊
✅Rally 1
✅Rally 2
⏳ RALLY 3!
ALTS generally started its run with a double bottom before the previous rally phases and is currently confirmed with a double bottom

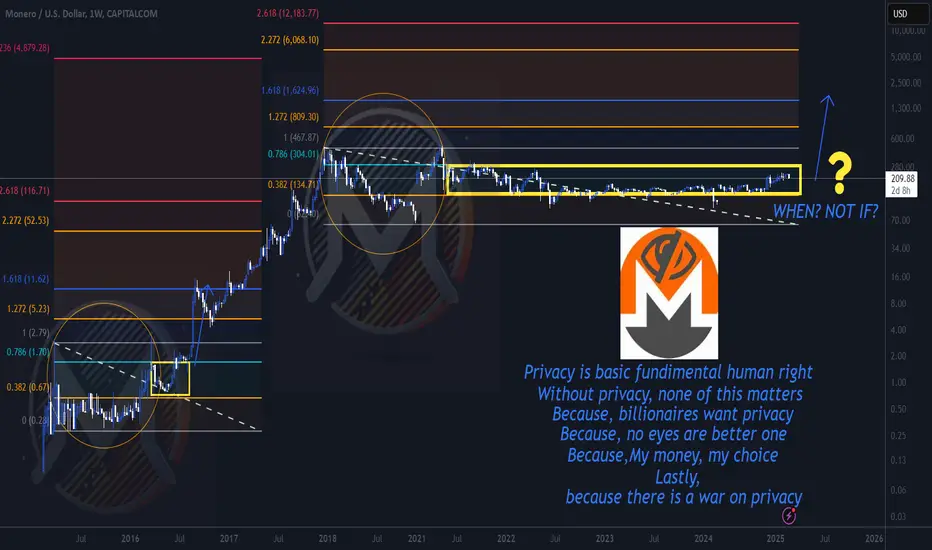
Privacy matters, and it will cost you in the futureGood day Investor and traders,
When the criminals run show, they definitely don't want you to know it.
Privacy is a double edged sword. However, just because criminals use it doesn't mean it should shunned upon. Criminals also wear clothes and use curtains. Both are fashion statement second, but serve as privacy first. Enough of my opinion, the chart speaks for its self.
Other than my additions, this is a naked chart of XRM on the weekly. It shows a very distinct patterns of how it moves.
XMR is another coin that was in my thesis from a couple years back in the bear market of 2022 that was the "lengthening or alternating" altcoin cycles. Another cycle that looks like it want to repeat, just much more drawn out. I do believe it will repeat, it might take 10-20 years or so to do so. The next big phase of privacy might have to have people getting a taste of CBDC or UBI, before they realize how much it will, or most likely could infringe upon their privacy. The chart shows early investors already knew this. Look at that move from 2016 to 2017 25 cents to $480 dollars. WOW, that rivaled XRP's big move!!! The key pattern here is the initial move then the big correction, the retest (double top) and how it moves with the fib levels. I have highlighted this in the chart with the Monero XMR logo and and a circle then with the yellow rectangle. Its the same pattern just waaaay drawn out. So, after this double top M then correction, marks the key before price explosion. IMO, I don't think it's and "IF" it happens, but "WHEN" it happens. These types patterns are what sparked my original thesis on these coins. IMO there is a reason other than just profits, early investor recognized the eventual use case, just like in Bitcoin.
Let me know what you think in the comments.
Kind regards,
WeAreSat0shi
$ALT Breaks 136-Day Resistance — Big Rally Loading?#ALT has officially broken above the 136-day-long resistance.
Price is now consolidating above the breakout zone, showing strength.
If momentum continues, a major rally could be ahead.
Watching closely for confirmation of the next move.
NASDAQ:ALT BINANCE:ALTUSDT
