SUI | Sui Network - Swing Long Idea - Altcoin
📊 Market Sentiment
Market sentiment remains bullish, supported by expectations of a 0.25% rate cut at the upcoming FOMC meeting. The weakening USD and rising risk appetite across global markets are favoring crypto assets in particular.
📈 Technical Analysis
SUI recently gained bullish momentum, largely following Bitcoin's strength.
We’re now seeing a healthy retracement, which is expected after a strong move.
The break of the LTF bullish trendline suggests potential for a deeper pullback toward HTF confluence zones.
📌 Game Plan
I'm eyeing the HTF demand zone around $3.06, which aligns with the 0.5 Fibonacci retracement—a key discount zone.
Just below this, we also have a higher time frame bullish trendline, which could offer dynamic support.
These overlapping levels provide a strong confluence for a swing long idea.
🎯 Setup Trigger
I’ll wait for a 4H bullish break of structure and the formation of an LTF demand zone before entering.
📋 Trade Management
Stoploss: Below 4H demand swing low
Target: Up to $4.44
I’ll trail my stop to lock in profits aggressively along the way.
💬 Like, follow, and comment if this breakdown supports your trading!
More setups and market insights coming soon — stay connected!
Altseason

SUI’s Next Big Move? Key Levels You Must WatchHey friends, it’s Skeptic 🩵
In this video, I’m diving into the current setup on SUI – whether to long or short, plus an update on market context and risk zones.
I broke down key levels, previous triggers, and what price action is hinting at next.
This one’s packed with insights, especially if you're in futures or looking for an entry on spot.
⚠️ Don’t forget about risk management – chasing pumps is a recipe for FOMO and mistakes.
💬 Let me know your thoughts on SUI in the comments, and let’s talk setups.

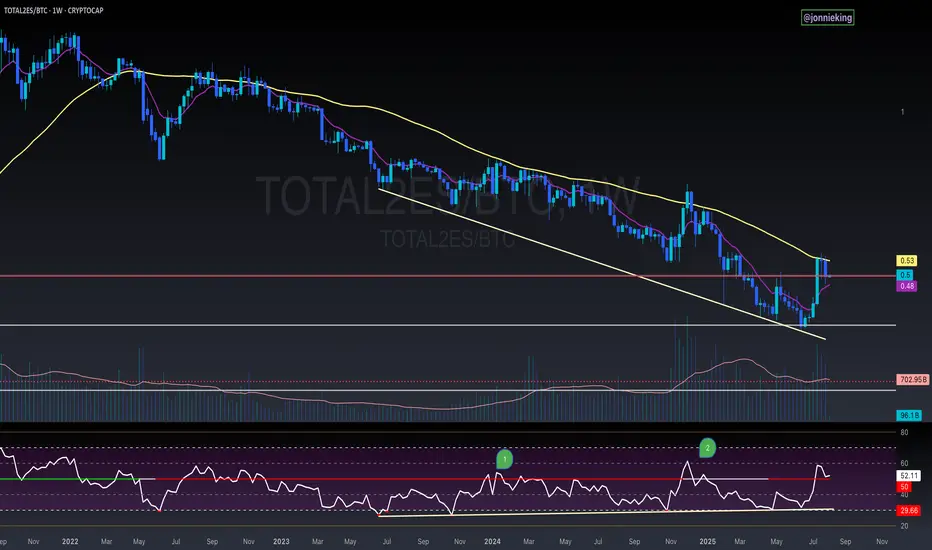
$TOTAL2ES/BTC Weekly Close AlertA bit concerning seeing CRYPTOCAP:TOTAL2 get rejected at the 50WMA and close below it for the 3rd consecutive week against CRYPTOCAP:BTC
Also flirting below the neckline breakout.
PA is still above the EMA9, which needs to hold to keep momentum.
Saving grace is the bullish divergence on the RSI.
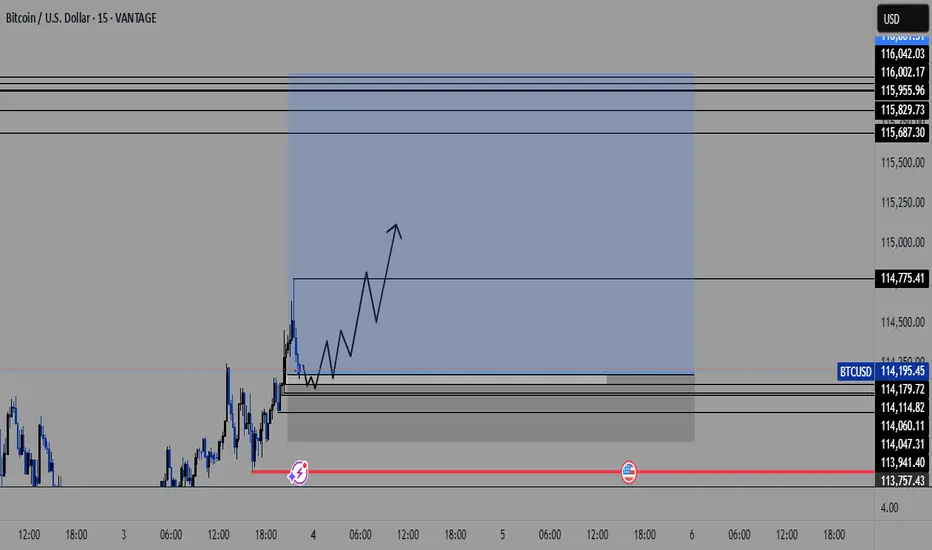
Bitcoin to $116K in a Week? Here's the Case Everyone's IgnoringI know it sounds wild — but hear me out.
BTC is primed for something massive, and the ingredients are all on the table:
✅ ETF inflows are quietly stacking
✅ Supply shock post-halving is still underestimated
✅ DXY weakening = flight to hard assets
✅ Global uncertainty = Bitcoin safety bid
✅ Technicals pointing to a breakout above ATH with no resistance until $100K+
We're seeing the early signs of parabolic structure forming — and if volume confirms, this could move fast. Everyone thinks a 2x in a week is impossible... until it isn't.
Not saying it’s guaranteed — but if you've been around long enough, you know BTC doesn’t move linearly.
👀 Watch the $72K breakout zone closely. If it flips with conviction and volume, $116K is not out of the question.
Drop your charts. Agree or disagree?
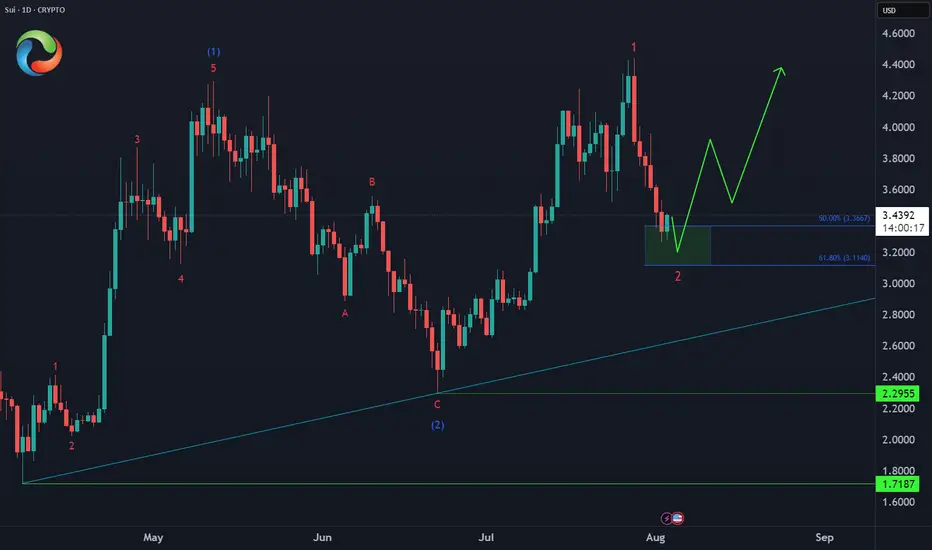
SUI Bullish Setup Ahead🚀 After breaking above its May peak, CRYPTO:SUIUSD has confirmed a higher high sequence, signaling bullish momentum. The current price action suggests it's now working on a higher low, likely forming around the 50%–61.8% Fibonacci retracement zone between $3.36 and $3.11 before resuming its rally.
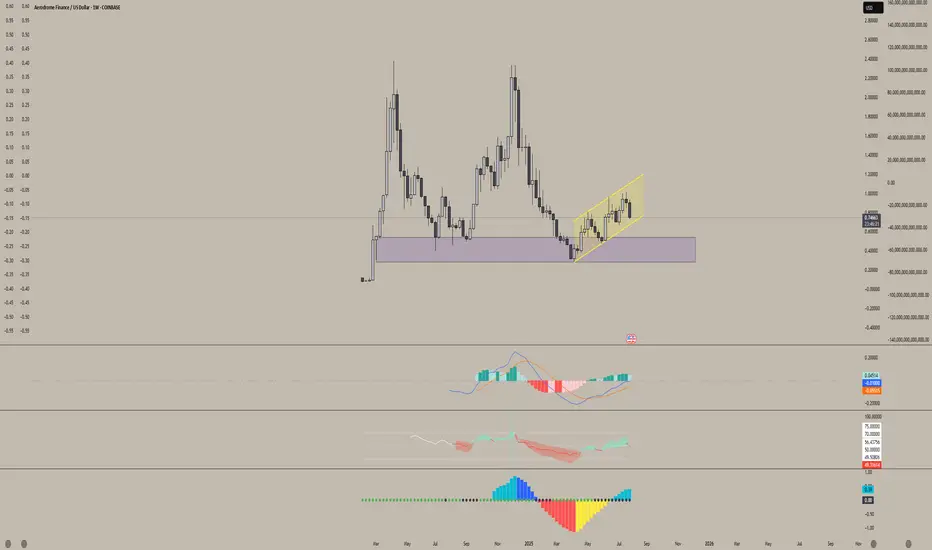
Aerodrome Finance (AERO)Aerodrome (AERO) is showing strong signs of accumulation.
We've been trading within this parallel channel for nearly three months, and it's repeatedly respected both the upper and lower bounds. As we approach the bottom of this range again, it looks like an ideal accumulation zone for long-term holders.
I'm very bullish on this project. Aerodrome is the leading DEX on Base — Coinbase’s Layer 2 network — and with no native Base token currently, AERO is in a prime position to claim that top spot. There's a vacant throne on Base, and AERO is well-positioned to sit on it.
LIVE TRADEHello friends🙌
Given the good trend we had, now that we have had a price correction, we can enter the trade with risk and capital management and move towards the specified goals.
🔥Follow us for more signals🔥
*Trade safely with us*
ERA : Risky but profitableHello friends🙌
Given the high that has been made and the price has returned, there is a possibility that the price will correct to the middle of the move, which is why we have provided two buying levels for you, which you can buy with risk and capital management and move towards the specified goals.
🔥Follow us for more signals🔥
*Trade safely with us*

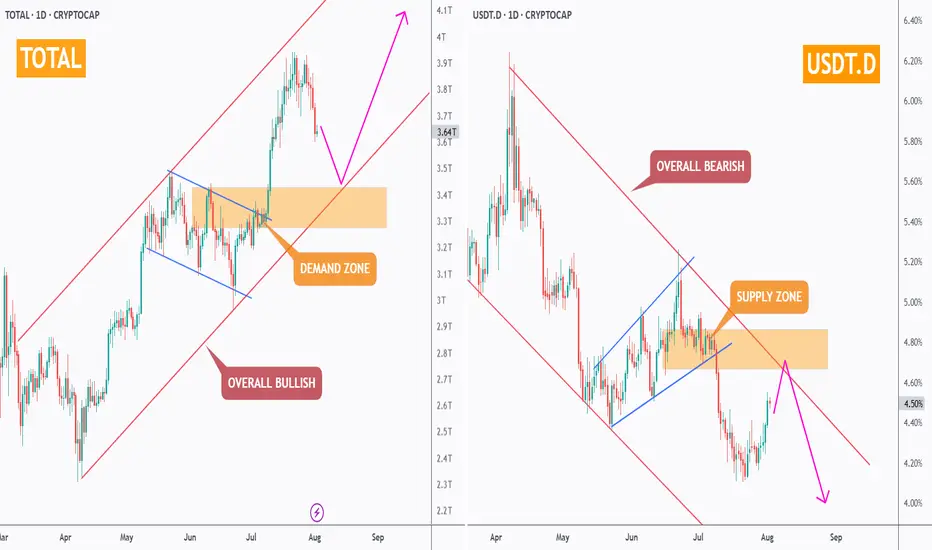
Don’t Panic — It’s Just a Healthy Crypto Correction!While the crypto market has seen some red this week, the bigger picture remains intact. Let’s zoom out and make sense of the current correction.
🔸 TOTAL Market Cap (left chart)
The structure remains overall bullish, trading inside the red rising channel.
After a solid rally, the market is currently pulling back toward a strong demand zone – perfectly aligned with the lower trendline. This area is likely to act as a major support, from which the next bullish impulse could kick off.
🔸 USDT Dominance (right chart)
USDT.D remains overall bearish, trading inside the red falling channel.
It’s currently pushing higher toward a well-defined supply zone, which also intersects with the upper red trendline. As long as this area holds, we expect sellers to take over again — giving altcoins the space they need to bounce back.
📌 In simple terms:
The market is in a healthy correction. Don’t let short-term dips shake your long-term view. The trend is still your friend.
➡️ As always, speak with your financial advisor and do your own research before making any investment decisions.
📚 Always follow your trading plan => including entry, risk management, and trade execution.
Good luck!
All strategies are good, if managed properly.
~ Richard Nasr
The Loudmouth Pattern: It Yells, We Trade!
On the 30-minute chart, ETH is forming a classic Broadening Formation – or as some traders like to call it, “The Big Mouth Pattern” 😄. It’s noisy, unpredictable at first glance, but when it speaks, you’d better listen.
Right now, price is moving through the bullish leg of this setup, and if momentum holds, we’re eyeing the $4,000 psychological level, followed by the $4,120 – $4,170 supply zone.
🔹 Bullish Scenario (our expected outlook):
🎯 Target 1: $4,000
🟩 Main Resistance: $4,120 – $4,170
❌ Invalidation: Confirmed close below $2,946
If price breaks and holds below that red support zone, this setup gets thrown out the window.
📊 Risk Management:
Scale in on pullbacks – if structure remains valid
No chasing without confirmation
Keep risk under 1% of total capital
📈 The market’s big mouth is open – and until it closes below $2,946, we’re listening for bullish signals. 🤑

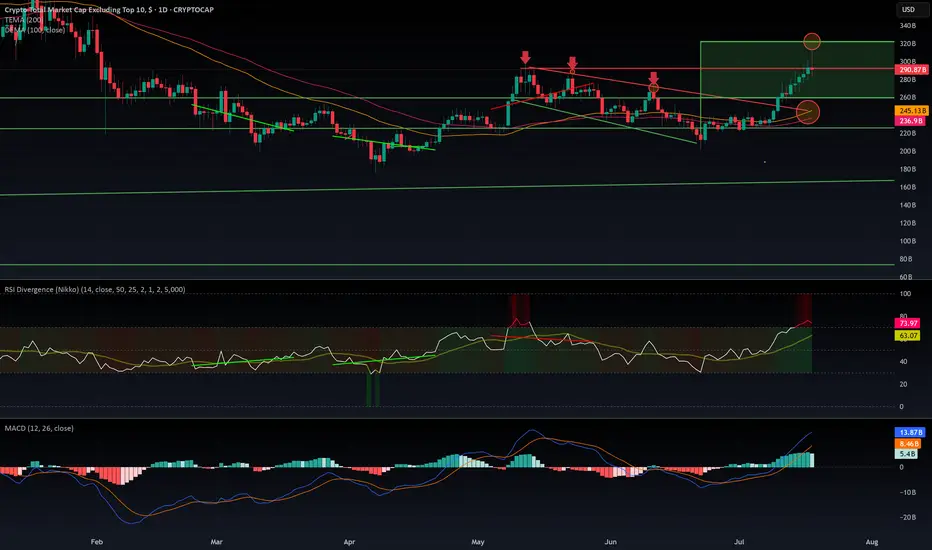
$OTHERS rejected from $320 B resistance. What is next?CRYPTOCAP:OTHERS Rejected at $320B: Is the Altseason on Pause?
CRYPTOCAP:OTHERS just got rejected at the $320B resistance after a decent pump — the kind that usually signals the start of an altseason. But if we dig into the indicators, warning signs are flashing:
- MACD is sitting in overbought territory.
- RSI is heavily extended, signaling potential exhaustion.
- EMA 100 & 200 are colliding with the top of a previous downtrend channel — a zone that historically acted as strong resistance.
The rejection was sharp. So what's next? Are we entering a range between $320B and $260B? It's quite possible. The aIf you wantltcoin market now sits at a decision point: either it keeps pushing higher or takes a breather — potentially pausing the rally until September.
Historically, August is a slow month in the West. People go on vacation, volumes drop, and markets tend to cool off. This seasonal pattern supports the idea of a consolidation phase before a stronger second leg of altseason kicks off in mid-September and carries into Q4.
I’m not posting too many ideas lately because the market landscape has changed. The new players aren’t just trading — they’re manipulating flows with massive capital to hunt retail liquidity.
They’re also using far more sophisticated tools than our classic MACD and RSI — including AI-powered indicators and multi-layered analytics that are beyond retail reach.
In this new environment, predictions are harder and risk is higher.
🧠 Do Your Own Research (DYOR), stay sharp, and don’t blindly trust social influencers.
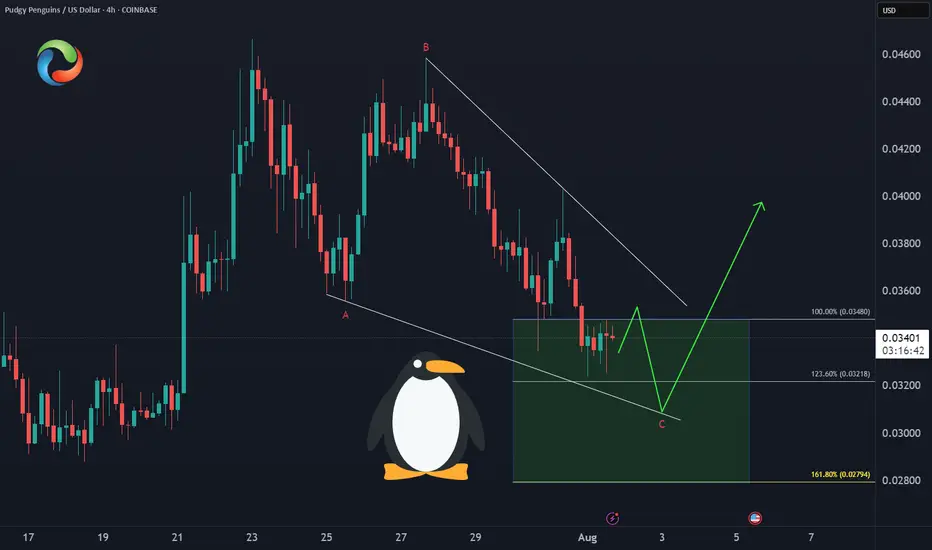
PENGU Enters Demand ZoneCOINBASE:PENGUUSD 🐧Price has developed a clean A-B-C correction into the equal legs support zone at $0.034-$0.028, offering:
✅ Optimal risk/reward entry
✅ Wave structure confirmation
✅ Higher low potential
This is the technical sweet spot for the next rally leg.
Solana coin Long setupIn this video I go through the current price action and talk about how the 126$ target level was recently reached for a clean long entry and on the daily timeframe we printed a higher low .
I expand on my thoughts for a continuation to the upside and to retest some higher levels of resistance 180$s and time will tell if we print a higher high at the 180$s before retesting the $200 zone .

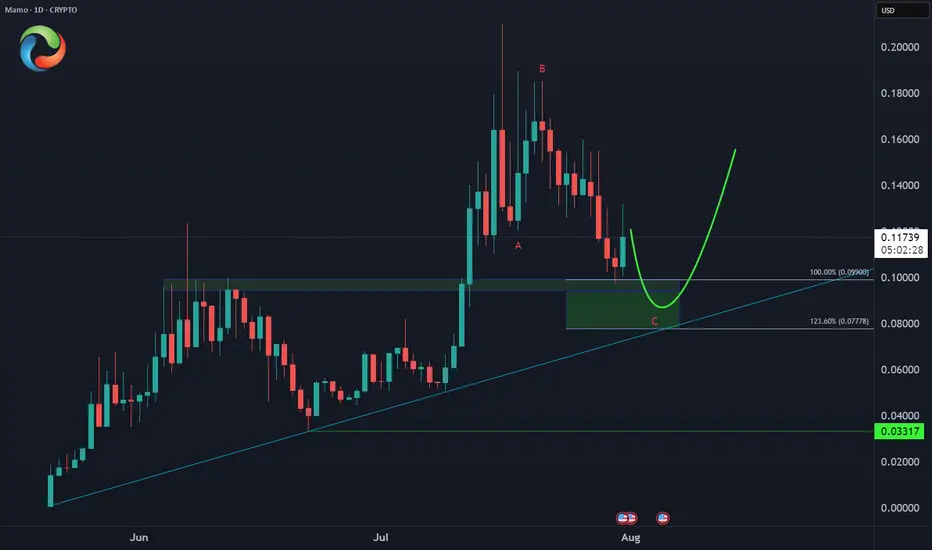
MAMO Buying Opportunity🤑 CRYPTO:MAMOUSD did 3 waves pullback into extreme area $0.099 - $0.077 and as long as it holds the trendline from May low then Bulls will be looking for more upside to take place from here!
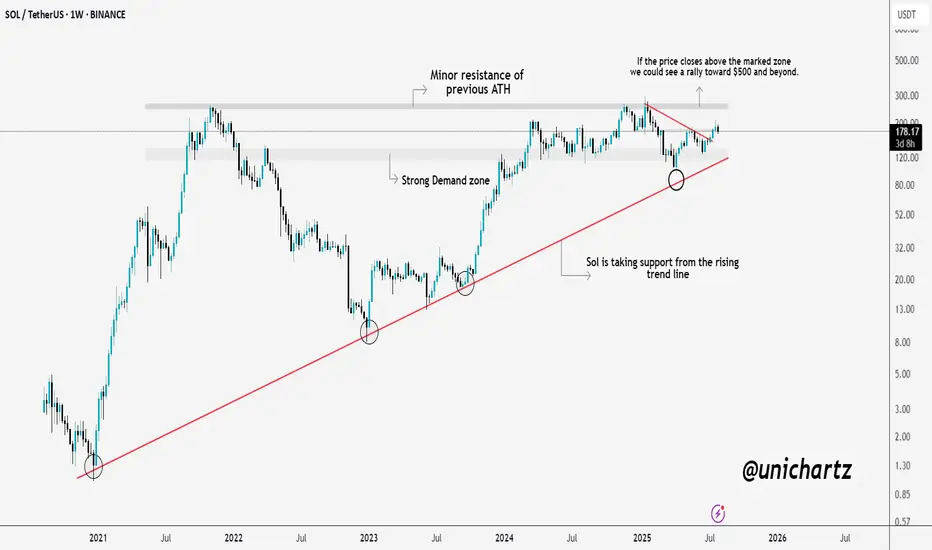
Massive Move Loading? $SOL Prepping for a BreakoutSolana is showing real strength here.
CRYPTOCAP:SOL consistently taking support from the long-term rising trendline, a sign that buyers are defending key levels. We're also approaching a critical resistance zone, which was the previous ATH area.
If SOL manages to close above this zone, we could witness a strong rally towards $500 and beyond. Until then, it’s a crucial level to watch, a breakout here could set the stage for the next leg up.
DYOR, NFA
MEW : A meme coin that hasn't grown yetHello friends🙌
Given the decline we had, you can see that buyers entered the specified support area and entered the price into the ascending channel. That is why we can buy with risk and capital management and stay with it until the specified targets.
🔥Follow us for more signals🔥
*Trade safely with us*

BTC:LIVE TRADEHello friends🙌
📉Given the decline we had, we now had a good price rebound in the specified support area, which shows the power of buyers. Now, with capital and risk management, we can buy at the specified points in a stepwise manner and move to the specified targets.
🔥Follow us for more signals🔥
*Trade safely with us*

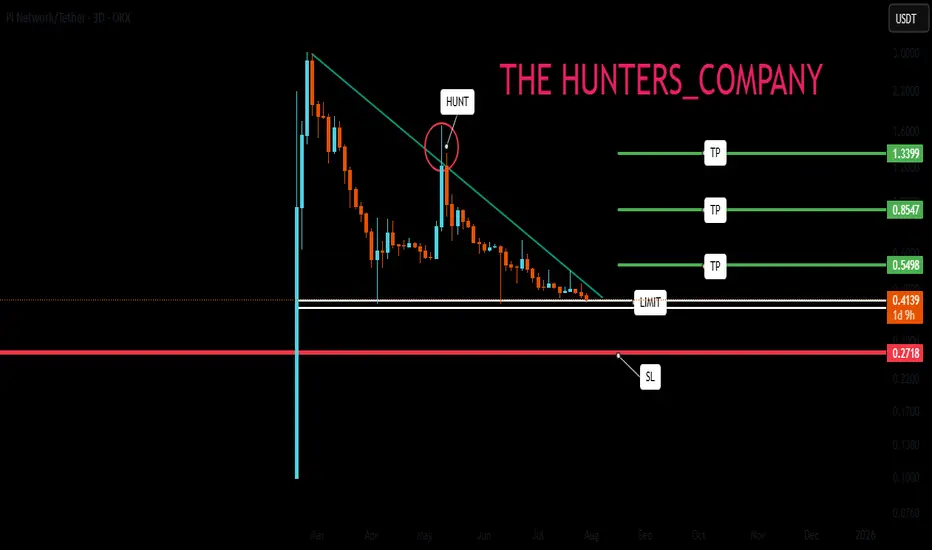
PI NETWORK : Will it finally be pumped?Hello friends🙌
👀According to the decline we had, you can see that the price has reached an important area and has formed a floor in this area. Considering the classic ego that is forming on support, you can enter the trade by breaking the resistance, of course, by managing risk and capital and moving with it to the specified goals.
🔥Follow us for more signals🔥
*Trade safely with us*
RUNE : Ready to pump?Hello friends🙌
👀According to the price drop, you can see that the price has reached an important area, which, according to the pattern formed, if the specified resistance is broken, we can enter with risk and capital management and move to the specified targets.
🔥Follow us for more signals🔥
*Trade safely with us*

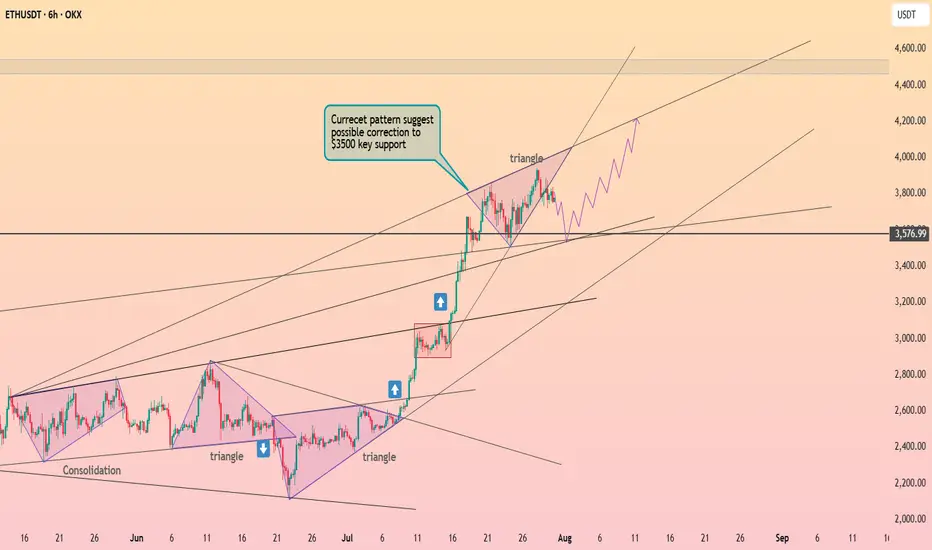
Ethereum is holding the $3700 level ┆ HolderStatOKX:ETHUSDT rallied from multiple triangle breakouts to test 4,400+ before pulling back. It’s now approaching key support at 3,576, which coincides with a major horizontal and trendline intersection. If this zone holds, the next leg up may target 4,600–4,800. Structure remains bullish above 3,500.
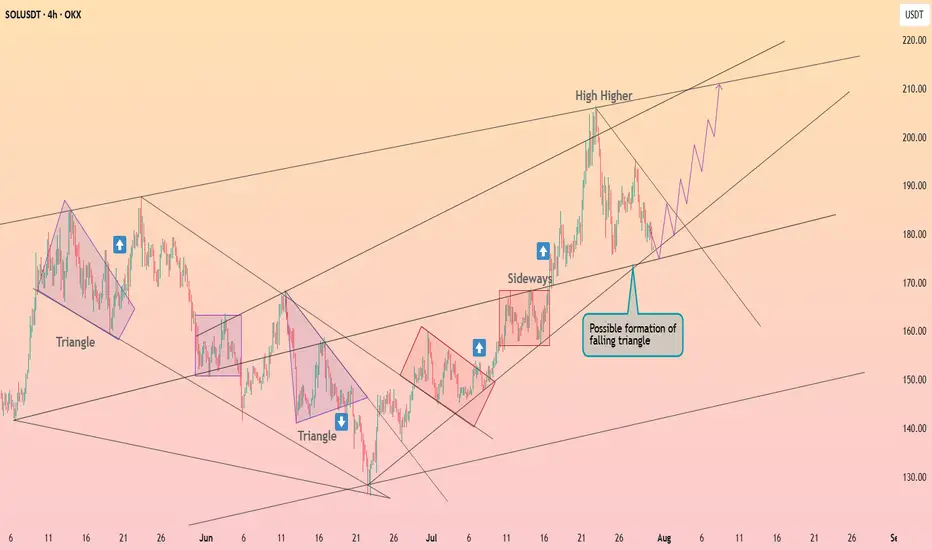
Solana is forming the falling triangle ┆ HolderStatOKX:SOLUSDT is compressing into a possible falling triangle, with support around 180–185 and upward projections pointing toward 210+. The chart has repeatedly shown triangle breakouts into strong rallies. As long as the lower trendline holds, the upside setup remains valid.
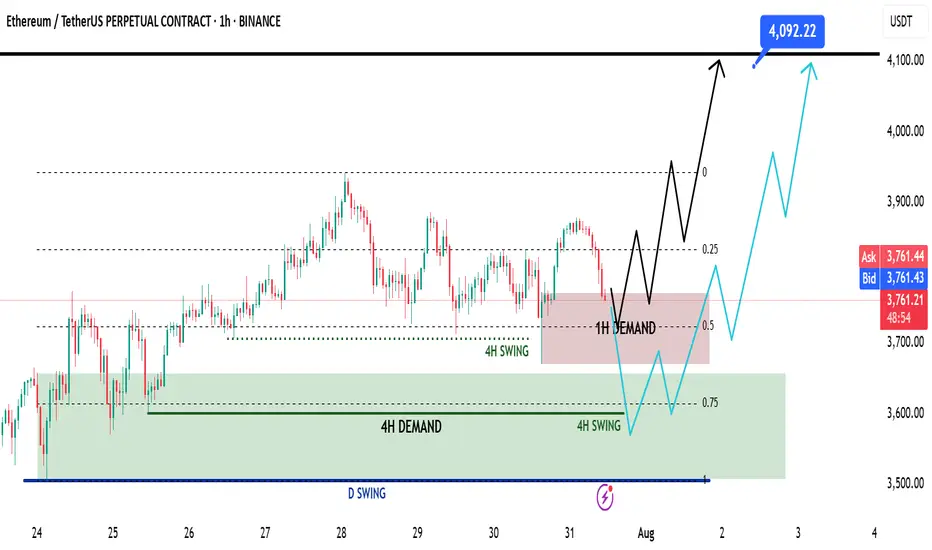
Ethereum Mid Week Update - Swing Long Idea📈 Market Context:
ETH remains in a healthy bullish structure. Despite the recent retracement, price action is still supported by strong demand zones on higher timeframes. No change in the overall sentiment from earlier this week.
🧾 Weekly Recap:
• Price rejected from the Fibonacci 0.5 EQ level — a discounted zone in my model.
• While doing so, it also ran 4H swing liquidity.
• After taking liquidity, ETH formed a 1H demand zone — a sign to look for lower timeframe confirmations for long setups.
📌 Technical Outlook:
→ Price has already tapped into the 1H demand zone.
→ From here, we have two possible scenarios:
Black scenario (ideal):
• Wait for 15M bullish break of structure (BOS).
• Enter after confirmation for long setups from 1H demand.
Blue scenario (deeper retrace):
• If no bounce from 1H demand, expect price to dip toward 0.75 Fib level (max discount).
• Watch for another liquidity run & 1H–4H demand formation.
🎯 Setup Trigger:
✅ 15M bullish BOS inside 1H or 4H demand zones
→ This would be the entry confirmation trigger for longs.
📋 Trade Management:
• Stoploss: Below the swing low of the 15M BOS
• Target: 4090$
💬 Like, follow, and drop a comment if this outlook helped — and stay tuned for more setups each week!
BONK : Best of luck to you...Hello friends🙌
👀Considering the decline we had, you can see that the price was supported by buyers and broke the specified resistance. Now, in the price correction, there is a good opportunity to buy with risk and capital management and in steps and be patient until the specified targets are reached.
🔥Follow us for more signals🔥
*Trade safely with us*
