$ETH why is it cancelled? Things you porobably need to know.There are several reasons why CRYPTOCAP:ETH is being sidelined—some obvious, others you may not have considered. Here's my analysis.
Let’s be clear: something is wrong in this cycle, and the ETF providers are at the heart of the problem.
The famous line, *"there is no second best"*, rings true—because they ensure no one overshadows their main asset: $BTC.
They’ve already tried to destroy crypto outright—really hard—and failed. The elites are 100% devoted to the USD; it’s their lifeblood. Crypto, especially stablecoins like USDT or USDC, became a competitor, and they did everything possible to wreck the market. When direct attacks didn’t work, they turned to a new strategy: controlling it from the inside.
They embraced crypto, and now they’re making billions off crypto enthusiasts who mistakenly believe these players are here for their benefit. This won’t last forever, but that’s a topic for another day.
Now, let’s address why Ethereum is underperforming—and why it’s likely to continue.
### 1. **Corruption in the Proof-of-Stake System**
All PoS systems rely on staking: the more you stake, the more rewards you earn. Typical staking rewards in crypto average about 10% APR, significantly higher than traditional bank interest rates.
But here’s the catch: these rewards are minted, creating inflation because more coins are constantly being dumped into the market. This results in a class of "retired" investors who stake massive amounts, live off their staking rewards, and sell them without ever touching their capital. This creates constant sell pressure on PoS coins.
The Ethereum Foundation controls how much staking is rewarded. Because it’s run by the same people staking, their vested interest is to keep APRs high, even though this fuels inflation. Ironically, Ethereum’s inflation rivals the USD—a troubling reality for a crypto meant to outperform traditional finance.
### 2. **Ethereum’s Ripple Effect on the Market**
Most altcoins rely on Solidity smart contracts, meaning Ethereum’s performance directly impacts the broader altcoin market. When Ethereum underperforms, it drags down Layer 2 solutions, DeFi projects, and the entire altcoin ecosystem.
Knowing this, why did ETF providers rush to approve ETH ETFs? Simple: *“There is no second best.”*
By taming Ethereum, ETF providers manipulate the market to keep Bitcoin afloat, cancel bear markets, and kill any chance of an altseason. On-chain data shows their strategy: when they buy Bitcoin, they sell Ethereum. This frustrates altcoin holders, pushing them to dump their bags and pivot toward—guess what—Bitcoin.
### 3. **The ETF Trojan Horse**
Ethereum, with its corrupt foundation, is the perfect tool for entities like BlackRock to maintain Bitcoin dominance. By doing so, they effectively prevent bear markets and suppress altseasons.
But this strategy has an endpoint. ETFs will milk the crypto space for as much profit as possible. Once they’ve extracted enough, they’ll dump their holdings, funneling all that capital back into USD. This has been their plan all along.
When that happens, the crypto market—including Bitcoin—will crash. Ethereum’s role has essentially been to funnel cash into Bitcoin, making it easier for institutions to accumulate wealth before transferring it all back into USD.
---
In short, Ethereum is being used as a tool in the ETF providers' larger scheme. It’s not about creating a thriving ecosystem but about maintaining dominance, controlling markets, and ultimately cashing out into the USD.
Altseason

Chart Breakdown: Gold, Bitcoin, SPX ComparisonThis chart compares the price action of Gold (candles), Bitcoin (purple line), and the S&P 500 Index (red line) over a multi-year period. Several key phases and correlations are highlighted:
🟢 Key Observations:
1. Gold Bull Run (2019–2020):
Gold experienced a strong upward trend starting in mid-2019.
This bull run led to a peak in August 2020, right before the final phase of the Bitcoin bull market.
2. Bitcoin Bull Run (Highlighted in Blue):
After Gold peaked, Bitcoin entered its final bull run phase, accelerating dramatically.
The vertical yellow line (August 3, 2020) seems to mark the transition point where capital started rotating from Gold into Bitcoin.
3. Gold Correction + SPX Correction (Post 2020):
As Bitcoin surged, Gold corrected downward, reflecting a rotation of capital or risk preference.
At the same time, the S&P 500 also experienced a temporary correction, possibly reflecting macroeconomic uncertainty or shifting investor sentiment.
🟡 Current Market Structure (2024–2025):
4. Gold Potential Peak Again?
A similar structure appears to be forming now: Gold is peaking again, just as Bitcoin and equities are at critical levels.
The chart raises the question: "Is Gold topping again, just like it did in 2020?"
5. Possible Repeat Cycle:
If history repeats, we could be seeing the early stages of a new Bitcoin bull phase, following Gold’s strength and peaking pattern.
SPX appears to be climbing steadily, indicating a risk-on environment—similar to what happened during the last crypto surge.
🔁 Macro Interpretation:
Gold → Bitcoin Rotation: Historically, a peak in gold has preceded a sharp upside move in Bitcoin.
Risk Shift Timing: Both gold corrections and SPX slowdowns tend to coincide with the start of aggressive crypto bull phases.
This could suggest that a new Bitcoin leg up is near, especially if gold starts to decline again from current highs.
📌 Conclusion:
Your chart reflects a macro rotational pattern:
Gold strength → Peak → Bitcoin acceleration → Gold/SPX correction.
If this cycle plays out again, the current peak in gold could signal a new phase of momentum for Bitcoin, just as it did post-2020.

FIFA WORLD CUP HISTORIC ROARING 20s QE Restart ScenarioBenjamin Cowen has been truly amazing with his analysis. As per monetary policy it's definitely too early to call the start of QE but we're on the right track.
it almost feels like the true Altseason will start when the FIFA World Cup starts. Every single scenario matches that theory. If you also pay attention to Algorand for instance, it's mimicking the early days of XRP. XRP is also mimicking the early years of Apple.
Can you imagine a scenario where XRP hits 120 dollars and Algorand 1200 dollars? I know I know the market caps etc. But so far it does feel like the markets are brewing for a truly historic roaring 20s scenario that could last for years.
Big question is, who has the first mover's advantage now and needs to catch up in the mean time?
I'm looking at tiny caps like Metastrike, and institutional coins like VeChain. China has already started QE so you may want to play around with VET while the entire market is boring.
JasmyCoin I can't tell yet, it could be but it has that annoying monitoring tag and in my case I've already survived 7 delistings already (dock, ooki, troy, gifto, gemie, kingdomverse, dreamsquest), so not touching it for now.
Looks very promising to be honest. Gotta have a long term vision here.

BTC - Slight Distribution After Nearly 10xMorning my fellow traders, and happy new year!
I hope you do not have a hangover right now. But if you do, get a tea going, it usually does the trick for me!
I can't deny the possibilities for another rally to take out the highs, but I'm thinking what the market makers are planning is a simple inverted Adam & Eve pattern that will lead us to new opportunities within the next month or so.
Keep in mind that for sometime now Alts have not been giving, and I believe that after this next Alt season (which I believe we will still get), they will keep giving less and less.
I sold near $100k for probably a couple weeks now. Did not get a perfect $108k sale, which is fine. Now I'll focus on a reentry if this plays out.
Trade thirsty, my friends!

WOW, I can see ALTSEASON of 2025 what about you?USDT.D can show me as a big sign of starting ALTSEASON. also if break the line.

BTCUSDT WEEKLY : BEARMarket Will be start Hi Guys , Good day,
Be carefully, I think bull market is finish ,
I think the bull market may be over. Be very careful with your trades. Check the charts and see where we are at a sensitive point.
SecondChanceCrypto
⏰ 6/april/26
⛔️DYOR
Always do your research.
If you have any questions, you can write them in the comments below and I will answer them.
And please don't forget to support this idea with your likes and comments.

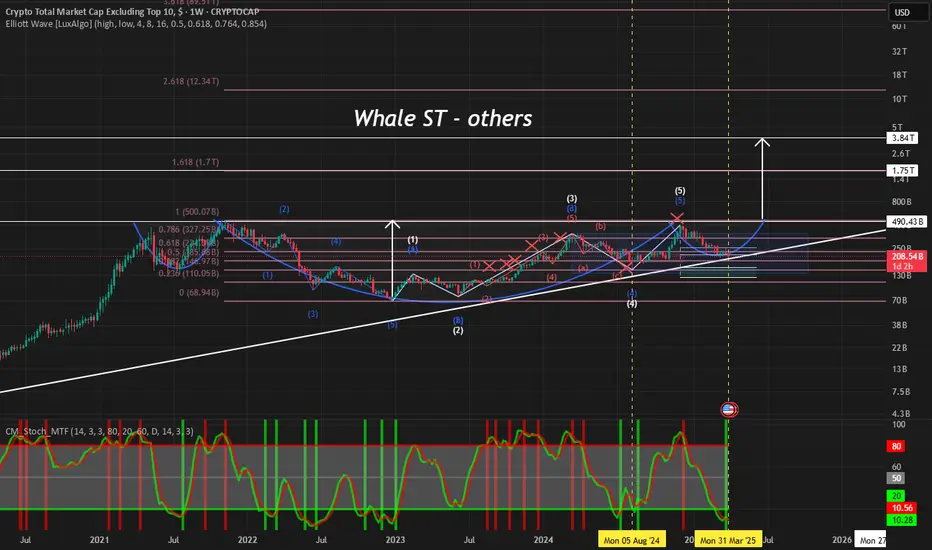
$others @whalest_The Others chart has not yet seen its old peak. I think the big rise will start soon. This chart represents other altcoins except for big projects. There will be exciting times soon.
Breaking: $BERA coin Dips 14% Today The price of BIST:BERA coin saw a 14% nosedived today amidst general crypto and stock market bloodbath that saw over $2.85 trillion wiped out from the US stock market today.
All this irregularities came as result of Donald Trump's Tax Tariff rates on Crypto currencies and stock shares.
For BIST:BERA , the RSI already hints at a weaker trend channel but BIST:BERA is bouncing off of the 78.6% Fibonacci retracement level that is acting as a support point for $BERA. However, should extreme selling pressure emerge, the 1-month low s will be force to act as support point for $BERA.
About Berachain
Berachain is an EVM-identical Layer 1 blockchain that introduces Proof of Liquidity (PoL), a novel consensus mechanism aligning network security with liquidity provision. The protocol operates on a unique two-token model: BERA (gas and staking token) and BGT (non-transferable governance and rewards token).
Berachain Price Live Data
The live Berachain price today is $5.93 USD with a 24-hour trading volume of $175,431,304 USD. Berachain is down 16.38% in the last 24 hours, with a live market cap of $637,052,141 USD. It has a circulating supply of 107,480,000 BERA coins and the max. supply is not available.

HolderStat | BTC daily digestBitcoin price today ~ FWB:83K (-5% 24h). BTC futures open interest down ~7%, funding +0.006% 📉
Wider market 🌐: Altcoins fell too (ETH -6%, SOL -12%). Sentiment is split – some shout #BuyTheDip, others urge caution.
📰 CoinDesk: Tariff news spooked crypto markets, fueling BTC’s drop. Meanwhile, whales (big holders) bought this dip 🐳 – a bullish sign.
🔍 Analysis: Traders remain cautious, but whale dip-buying shows big players bullish. Expect crypto bulls 🐂 and bears 🐻 to battle it out for now.
_____________________
📊 Want more useful analytics? Like and subscribe to stay up to date with the most relevant trading ideas!
Always DYOR! 🔬

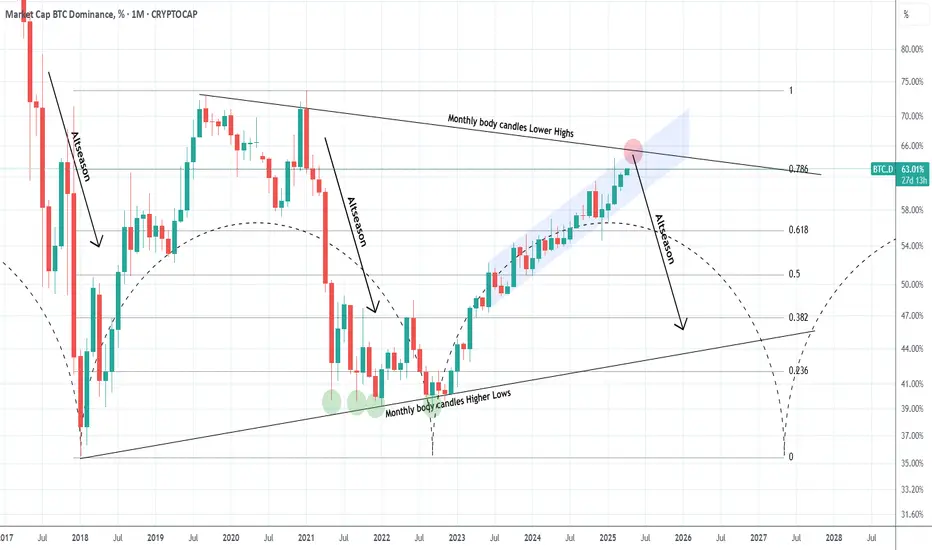
Is BTC Dominance about to reverse and start an Altseason?Well its undoubtedly what the crypto investor wants and what the market would have technically given in February if it wasn't for the tariffs trade war. Bitcoin's Dominance (BTC.D) is trading within a Triangle and February's test of the 0.786 Fibonacci retracement level was the technical level that should have given a rejection.
That rejection technically starts the Altseason which was dominant via a Bearish Leg both in 2017 and 2021. So far though both February's and March's 1M candles closed below the 0.786 Fib and April has an opportunity to even test the monthly body candles Lower Highs, which is the top of the Triangle. This is the last level that a rejection can be technically given.
Can this start an Altseason?
-------------------------------------------------------------------------------
** Please LIKE 👍, FOLLOW ✅, SHARE 🙌 and COMMENT ✍ if you enjoy this idea! Also share your ideas and charts in the comments section below! This is best way to keep it relevant, support us, keep the content here free and allow the idea to reach as many people as possible. **
-------------------------------------------------------------------------------
💸💸💸💸💸💸
👇 👇 👇 👇 👇 👇
AAVE Trying To Bottom 🚨AAVE is looking beautiful 🚨, very interesting chart for more upside
and is now into support and trying to bottom
Do not miss out on AAVE as this is a great opportunity
Watch video for more details

Alt Season Alert?Bitcoin dominance looks to be reaching its bounds and with all the talk about Bitcoin dominance gaining even more it seems we are at the top of Bitcoin dominance.

ALTCOINS has already started the new parabolic rally.Altcoins (excluding top 10) are repeating the 2015-2017 market structure.
Based on the 1week RSI we are at levels similar to July 2017 when the market kickstarted the final parabolic rally of the Cycle.
We expect the market to reach the $1 Trillion market cap mark before the end of 2025 and peak the Cycle there.
Follow us, like the idea and leave a comment below!!

Alt DominanceThis chart represent all the altcoins against btc. Basically its alt dominance. The true alt season is lined up to happen very soon. All you need to do is buy when price tags the green descending trend support. Once the falling wedge runs out of space we go parabolic.

sui usdt ready to lead ALTS?Looking to long SUI as close to 2.4 as possible
Reclaimed key support level after forming A&E pattern
Above 50 level on both 4h and 12h rsi
Was the fastest horse of the market when the market started its trend in 2024. Should lead again
Broke out of the trendline after the fakeout. Usually fakeout --> retest support --> real breakout occurs

BTC Dominance Breaks Out Altcoins Set to Bleed, Be CautiousHey everyone, let’s dive into this BTC Dominance chart on the 4H timeframe. As you can see, BTC Dominance has just broken out to the upside from a descending triangle pattern, which is a bullish signal for dominance. Currently sitting at 62.633%, it’s testing a key resistance zone around 62.71% (the recent high). If this level holds as support, we could see BTC Dominance push higher toward the next resistance around 64-65%, a zone that aligns with the upper trendline of the longer-term ascending channel.
What does this mean for altcoins ?
When BTC Dominance rises, it typically signals that Bitcoin is outperforming altcoins, often leading to altcoins bleeding in value relative to BTC. The breakout suggests capital is flowing into Bitcoin, likely due to market uncertainty or a flight to safety within crypto. Altcoins could face downward pressure in the short term, especially if BTC Dominance confirms this breakout with a strong close above 62.71%.
Key Levels to Watch
Support: 62.62% (recent breakout level) – if this fails, we might see a retest of 61.5%.
Resistance: 64-65% – a break above this could accelerate altcoin underperformance.
Invalidation: A drop below 61.5% would negate the bullish setup for BTC Dominance and could signal a potential altcoin rally.
Altcoin Outlook
Altcoins are likely to struggle in the near term as BTC sucks up market liquidity. However, keep an eye on major altcoins like ETH, BNB, or SOL for relative strength – if they hold key support levels despite this dominance move, they might be the first to recover when BTC Dominance cools off.
Final Thoughts
This BTC Dominance breakout is a warning sign for altcoin holders. Consider tightening stops on altcoin positions or hedging with BTC exposure. Also don't forget this is NFP Week as well. Let’s see how this plays out over the next few days – stay nimble and trade safe!

K.I.S.S => ETHHello TradingView Family / Fellow Traders. This is Richard, also known as theSignalyst.
📉 ETH Market Update – Keeping It Simple 📉
Since breaking below its last major low in December 2024, Ethereum (ETH) has been stuck in a bearish trend.
But don’t lose hope, bulls! 🐂
For the long-awaited altseason to kick off, ETH needs to flip the script and break above its last major high — currently sitting at $2,100.📈
Until then, patience is key. 🧘♂️
📚 Always follow your trading plan regarding entry, risk management, and trade management.
Good luck!
All Strategies Are Good; If Managed Properly!
~Rich

SNTUSDT Analysis: Avoid Getting Stuck in Mid-RangesI don’t want you to get lost in the mid-range areas . For SNTUSDT, I believe the blue box is a high-value demand zone . Given that overall market conditions are weak , I’ve identified a lower entry point that aligns with a safer and more strategic approach.
The blue box holds significance from multiple perspectives . I used heatmap , cumulative volume delta (CVD) , and volume footprint techniques to determine this precise demand region where buyers could potentially regain control.
Key Points:
Avoid Mid-Ranges: Focus on clear demand zones to avoid indecision.
Blue Box: A critical demand zone identified as a potential buyer area.
Techniques Used: Heatmap, CVD, and volume footprint for accuracy and precision.
If you'd like to learn how I use these tools to pinpoint such precise demand zones, just DM me!
If you think this analysis helps you, please don't forget to boost and comment on this. These motivate me to share more insights with you!
I keep my charts clean and simple because I believe clarity leads to better decisions.
My approach is built on years of experience and a solid track record. I don’t claim to know it all, but I’m confident in my ability to spot high-probability setups.
If you would like to learn how to use the heatmap, cumulative volume delta and volume footprint techniques that I use below to determine very accurate demand regions, you can send me a private message. I help anyone who wants it completely free of charge.
My Previous Analysis
🐶 DOGEUSDT.P: Next Move
🎨 RENDERUSDT.P: Opportunity of the Month
💎 ETHUSDT.P: Where to Retrace
🟢 BNBUSDT.P: Potential Surge
📊 BTC Dominance: Reaction Zone
🌊 WAVESUSDT.P: Demand Zone Potential
🟣 UNIUSDT.P: Long-Term Trade
🔵 XRPUSDT.P: Entry Zones
🔗 LINKUSDT.P: Follow The River
📈 BTCUSDT.P: Two Key Demand Zones
🟩 POLUSDT: Bullish Momentum
🌟 PENDLEUSDT.P: Where Opportunity Meets Precision
🔥 BTCUSDT.P: Liquidation of Highly Leveraged Longs
🌊 SOLUSDT.P: SOL's Dip - Your Opportunity
🐸 1000PEPEUSDT.P: Prime Bounce Zone Unlocked
🚀 ETHUSDT.P: Set to Explode - Don't Miss This Game Changer
🤖 IQUSDT: Smart Plan
⚡️ PONDUSDT: A Trade Not Taken Is Better Than a Losing One
💼 STMXUSDT: 2 Buying Areas
🐢 TURBOUSDT: Buy Zones and Buyer Presence
🌍 ICPUSDT.P: Massive Upside Potential | Check the Trade Update For Seeing Results
🟠 IDEXUSDT: Spot Buy Area | %26 Profit if You Trade with MSB
📌 USUALUSDT: Buyers Are Active + %70 Profit in Total
🌟 FORTHUSDT: Sniper Entry +%26 Reaction
🐳 QKCUSDT: Sniper Entry +%57 Reaction
I stopped adding to the list because it's kinda tiring to add 5-10 charts in every move but you can check my profile and see that it goes on..

First blood baths, then money baths.It is always useful to look at charts over the longest possible period.
* What i share here is not an investment advice. Please do your own research before investing in any asset.
* Never take my personal opinions as investment advice, you may lose all your money.

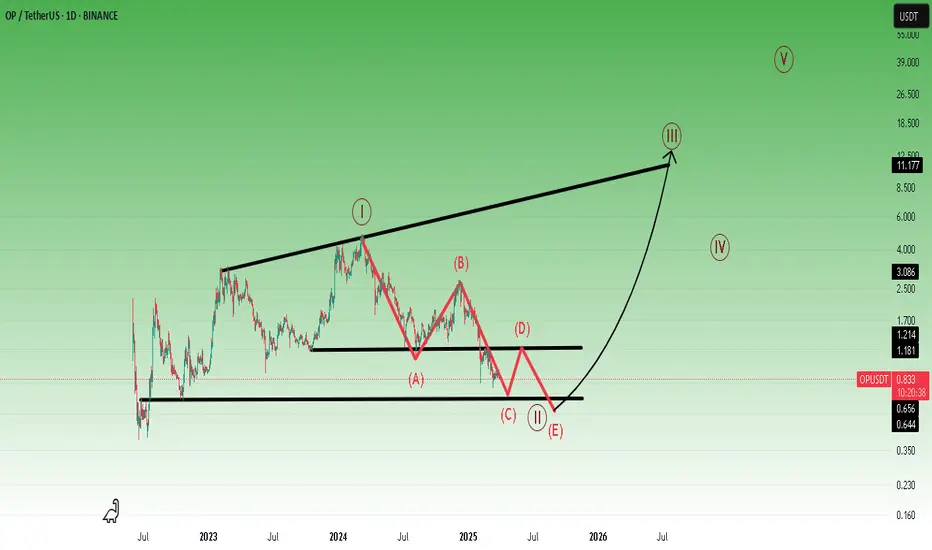
Think simple.In such falling channels, the 3rd bottom point is the ideal buy point for me for bullmarket portfolio
* What i share here is not an investment advice. Please do your own research before investing in any asset.
* Never take my personal opinions as investment advice, you may lose all your money.
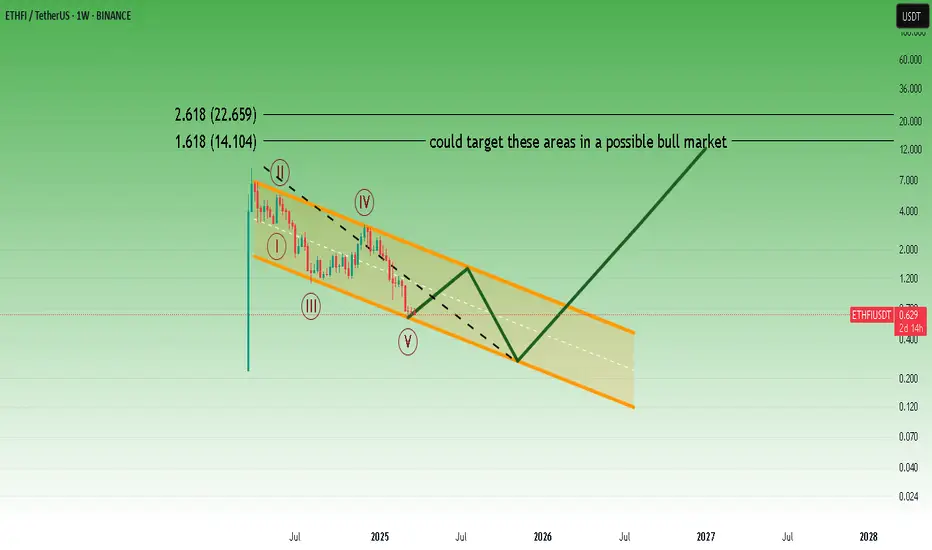
I am very optimistic about Optimisim in the long term.But first, let's go a little deeper.
* What i share here is not an investment advice. Please do your own research before investing in any asset.
* Never take my personal opinions as investment advice, you may lose all your money.
Breaking: Aavegotchi ($GHST) Coin Gearing Up for 100% SurgeBuild and integrated into the Ethereum chain, Aavegotchi ( OTC:GHST ) Coin is setting the stage for a for 100% rally amidst breaking out of a Falling Wedge.
After losing about 50% of market value as per February 3rd, 2025 last month, Aavegotchi ( OTC:GHST ) Coin regained momentum surging 30% for the past 24 hours. The asset is simultaneously forming a support point and also gearing for the next leg up.
With the Relative Strength Index (RSI) at 67.77, Aavegotchi ( OTC:GHST ) Coin is well position for a continuation of current trend.
What Is Aavegotchi (GHST)?
Aavegotchi ( OTC:GHST ) is the governance token of the Aavegotchi NFT Gaming protocol. GHST token holders receive voting power in the AavegotchiDAO, which oversees all aspects of the protocol, Aavegotchi’s flagship game the Gotchiverse, and Aavegotchi NFTs.
Aavegotchis themselves are pixelated ghosts backed by the ERC-721 token standard. The Aavegotchi NFTs have dynamic metadata that changes over time through user interaction.
Aavegotchi Price Live Data
The live Aavegotchi price today is $0.583848 USD with a 24-hour trading volume of $14,186,737 USD. Aavegotchi is down 1.77% in the last 24 hours, with a live market cap of $30,796,717 USD. It has a circulating supply of 52,747,801 GHST coins and the max. supply is not available.

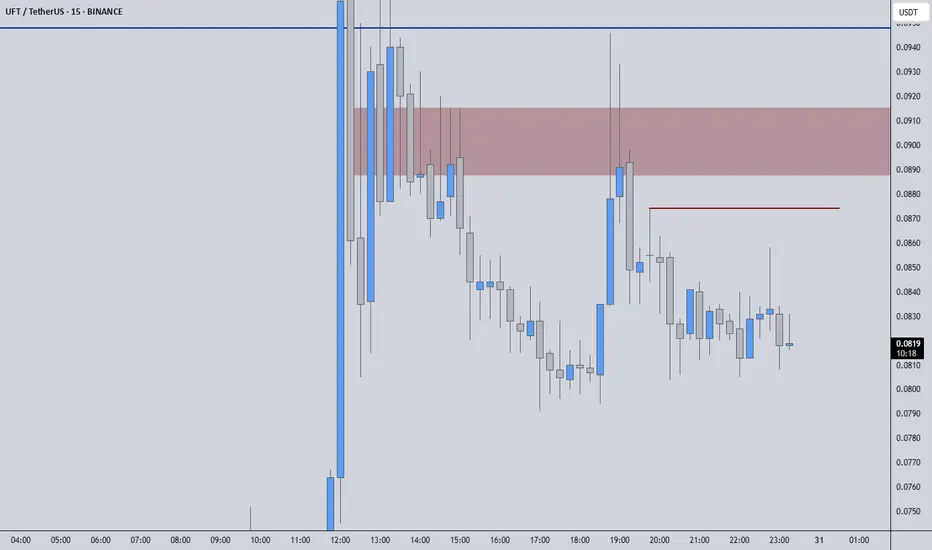
UFTUSDT – High-Precision Short Opportunities!UFTUSDT has faced a sharp decline, confirming the accuracy of our pre-identified key levels. Now, we focus on the red box and red line as prime shorting zones. This is not guesswork—these levels are carefully selected using Volume Footprint & Time Price Opportunities, tools that most traders don’t even understand.
🔥 Key Trading Strategy:
✅ Red Box & Above Red Line = Short Opportunities
These areas have historically acted as strong resistance, and without a breakout with volume, they are ideal for potential reversals.
✅ Risk Tolerance Matters
For a more conservative approach, wait for a rejection at resistance. If you prefer more aggressive entries, every downward breakout from key levels could be an additional opportunity.
✅ Confirmation is Everything
Blind entries are amateur moves. Every position should be backed by CDV analysis, volume profile validation, and LTF breakdowns. That’s how professionals trade.
📌 Why My Analysis Stands Out
This is not just charting, it’s high-level trading backed by data and years of expertise. My levels are not random lines; they are calculated, tested, and used with high precision. You can check my high success rate from my profile. Most traders don’t have access to these techniques, and that’s why they struggle.
Don’t trade like the crowd, trade with an edge. Follow the plan, follow the data, and dominate the market.
📌I keep my charts clean and simple because I believe clarity leads to better decisions.
📌My approach is built on years of experience and a solid track record. I don’t claim to know it all but I’m confident in my ability to spot high-probability setups.
📌If you would like to learn how to use the heatmap, cumulative volume delta and volume footprint techniques that I use below to determine very accurate demand regions, you can send me a private message. I help anyone who wants it completely free of charge.
🔑I have a long list of my proven technique below:
🎯 ZENUSDT.P: Patience & Profitability | %230 Reaction from the Sniper Entry
🐶 DOGEUSDT.P: Next Move
🎨 RENDERUSDT.P: Opportunity of the Month
💎 ETHUSDT.P: Where to Retrace
🟢 BNBUSDT.P: Potential Surge
📊 BTC Dominance: Reaction Zone
🌊 WAVESUSDT.P: Demand Zone Potential
🟣 UNIUSDT.P: Long-Term Trade
🔵 XRPUSDT.P: Entry Zones
🔗 LINKUSDT.P: Follow The River
📈 BTCUSDT.P: Two Key Demand Zones
🟩 POLUSDT: Bullish Momentum
🌟 PENDLEUSDT.P: Where Opportunity Meets Precision
🔥 BTCUSDT.P: Liquidation of Highly Leveraged Longs
🌊 SOLUSDT.P: SOL's Dip - Your Opportunity
🐸 1000PEPEUSDT.P: Prime Bounce Zone Unlocked
🚀 ETHUSDT.P: Set to Explode - Don't Miss This Game Changer
🤖 IQUSDT: Smart Plan
⚡️ PONDUSDT: A Trade Not Taken Is Better Than a Losing One
💼 STMXUSDT: 2 Buying Areas
🐢 TURBOUSDT: Buy Zones and Buyer Presence
🌍 ICPUSDT.P: Massive Upside Potential | Check the Trade Update For Seeing Results
🟠 IDEXUSDT: Spot Buy Area | %26 Profit if You Trade with MSB
📌 USUALUSDT: Buyers Are Active + %70 Profit in Total
🌟 FORTHUSDT: Sniper Entry +%26 Reaction
🐳 QKCUSDT: Sniper Entry +%57 Reaction
📊 BTC.D: Retest of Key Area Highly Likely
📊 XNOUSDT %80 Reaction with a Simple Blue Box!
📊 BELUSDT Amazing %120 Reaction!
I stopped adding to the list because it's kinda tiring to add 5-10 charts in every move but you can check my profile and see that it goes on..