Altseason

Cardano ADA headed for more volatility!!Looking for current buy sequence to reach 0.85-0.92 by early March timeframe. To be followed by one final sell wave as low as .45 area before continuation back to the highs.
Next buy-side targets will be
TP1 @ 3.00
TP2 @ 7.00

TOTAL2: When I’ll Deploy My Stables Back Into the MarketTiming the market perfectly is impossible, but using TOTAL2 and RSI, we can identify high-probability opportunities. Here’s my approach for the coming years.
I bought during the last dip, but my exposure is still less than what I sold before the crash. Here’s why.
Key Signals for Tops & Bottoms
RSI Patterns:
- Market Tops: Weekly RSI above 85 signals overheated conditions but does not always lead to an immediate reversal.
- Market Bottoms: Weekly RSI near 30 has historically marked strong accumulation zones.
- In the last seven years, RSI hit 30 only twice—2018 and 2022. I expect this level again within the next 24 months.
My plan:
I will deploy capital heavily when RSI approaches 30 again, securing long-term positions.
TOTAL 2 Scenarios: What Comes Next?
Scenario 1: Price Discovery
- If TOTAL 2 flips 2021 highs, ETH and altcoins will likely reach new all-time highs.
- Weekly RSI could exceed 85, potentially reaching 95, indicating extreme overbought conditions.
- I will take profits aggressively at this stage while also using a DCA strategy, as precise timing is never certain.
Scenario 2: Lower Highs Persist
- If RSI fails to reach overbought levels, this cycle may be weaker than expected.
- The 50 RSI zone is critical—if it aligns with oversold conditions on daily or 3-day RSI, it may present a selective buying opportunity.
- I have already taken partial profits since November 2024 to manage risk in case of this scenario.
Scenario 3: RSI Drop to 30
- This scenario appears likely within the next 24 months and would mark a bear market low.
- If BTC, ETH, and TOTAL 2 all hit 30 RSI, I will fully deploy stables with high conviction, considering it a generational buying opportunity.
Final Thoughts
Summary: I will increase exposure once RSI confirms strong long-term buy zones, but I am managing risk in the meantime.
What’s your take? Do you expect RSI to revisit 30?

When Alt-Season? Here's the Key FactorAlt-Season = BTC.D going down, but liquidity is king.
Right now, I don’t believe we’ll see a true alt-season until the Fed starts QE.
At the last FOMC meeting, Powell confirmed that QT will continue, meaning there is no reason to expect QE soon.
For QE to return, something needs to break—whether in the stock market or the broader economy.
Right now:
- Stock indices are at all-time highs
- The economy remains resilient
But cracks could form later this year
Possible triggers for QE:
- A stock market correction
- A credit event (bank failures, debt crisis)
- A sudden economic downturn
Why QE Matters for Crypto
- QE (Quantitative Easing) = Fed buys assets → Lowers interest rates → Pumps risk assets.
- QT (Quantitative Tightening) = Fed sells assets → Raises interest rates → Drains liquidity.
Crypto thrives in QE environments—that’s why we had the last alt-season in 2021, during extreme money printing.
In the chart, BTC.D is overlaid with Total Fed Assets.
- When the Fed’s balance sheet expands (QE) → BTC.D drops → Alts pump.
- When the Fed’s balance sheet contracts (QT) → BTC.D rises → BTC dominance increases.
Bottom Line:
For altcoins to outperform, we likely need another QE cycle. Without it, liquidity remains tight, and BTC.D stays high.
What’s your take? Will QE return in 2024, or will the Fed hold the line?

DOGE About to Moon? Yes, But Watch for One Last dump!Since 2013, CRYPTOCAP:DOGE has been following a massive long-term ascending channel.
Every major pump and dump has played out within this channel.
Right now, BINANCE:DOGEUSDT is forming a similar pattern to the one before its last bull run.
In both cases, you can draw a downtrend line from the previous cycle’s peak.
Before the real breakout (purple arrow), there was always a failed breakout attempt (light blue arrow) followed by a sharp correction.
💥 Last cycle’s correction: -61%
💥 This cycle’s correction so far: -64%
After the first correction, DOGE broke the downtrend line (purple arrow) but then had another 56% pullback, retesting the lower boundary of the descending channel.
If DOGE follows this same script, we’ve already seen a 57% drop as of 2/3.
But is the correction over? Not sure yet.
If there’s one last dip before the real pump, it could drop to the lower boundary of the descending channel.
Based on past support/resistance levels, the buy zone could be between $0.215 - $0.151.
Then comes the dawn after the coldest night—
The party will start suddenly, so hold on tight.
🔴 [ Follow me ] for more future script "guesses" like this!
🔥 I've dropped another 2 analyses for the 2025 altseason on the right hand side if you're using computer, and scroll down a bit to see the link if you're using mobile.

Will PEPE Pump or Dump Next?PEPE is mirroring its pre-pump structure from last year:
1️⃣ Both times, it spent months forming a large symmetrical triangle.
2️⃣ It followed the exact same 1-7 point structure.
3️⃣ After breaking out, both saw a major pullback.
4️⃣ The drop went below the Fibonacci 1.272 retracement level.
The recent crash perfectly touched the triangle’s upper boundary (descending trendline).
Now, we’re watching to see if the 1.272 level holds.
A retest of the descending trendline is possible, shaking out weak hands and cleaning up liquidity.
If BINANCE:PEPEUSDT bounces off the descending trendline, it could be a solid entry point.
But as always, set a stop-loss in case the drop continues.
If history repeats, the last cycle saw about a 3x pump—that’s the visible potential upside.
Honestly, in crypto, a 3x isn’t eye-catching.
But considering PEPE is one of the few meme coins that reached mainstream attention, its liquidity-grabbing power in an altcoin bull run could be massive.
🔴 for more future script "guesses" like this!
🔥 I've dropped another 2 analyses for the 2025 altseason on the right hand side if you're using computer, and scroll down a bit to see the link if you're using mobile.

When Will the 2025 Altcoin Season Arrive? Patterns Reveal !OTHERS.D is copying the same script as the last two altcoin seasons.
I’ve marked points 1-8 in the structure.
Each time, it formed a triangle consolidation before breaking into a bull run.
In the last two cycles, point 8 was the final low before the rally.
Right now, it's retesting point 8, which is the lower boundary of the triangle.
Will it repeat the script and break out, or is this time different?
Could we see a new scenario, or is it possible that altcoin season won’t come at all?
If the altcoin season does happen, CRYPTOCAP:OTHERS could 2x from here.
What do you think?
Do you believe we’ll see a crazy 2025 altseason?
🔴 for more future script "guesses" like this!
🔥 I've dropped another 2 analyses for the 2025 altseason on the right hand side if you're using computer, and scroll down a bit to see the link if you're using mobile.

Is Altcoin Season STILL About to Begin in 2025?Looking at CRYPTOCAP:BTC.D , before the 2021 altseason kicked off, there were 3 key stages:
▍Stage 1: A steep rounded top formed.
▍Stage 2: Along the neckline of the rounded top, a rounded bottom developed.
▍Stage 3: BTC.D dropped sharply, triggering a crazy altseason.
For 2025, it seems we're about to enter Stage 3:
▍Stage 1: Again, a steep rounded top formed.
▍Stage 2: Just like before, a rounded bottom appeared along the neckline.
What’s different this time?
BTC.D just retested the neckline resistance zone for the second time yesterday.
After touching it, BTC.D formed a long lower wick, signaling strong rejection.
Now, it's all about watching the next moves.
If BTC.D mirrors Stage 3 from the last cycle, we could see a sharp drop soon.
And if that happens, the crazy altseason might start before anyone is ready.
🔴 for more future script "guesses" like this!
🔥 I've dropped another 2 analyses for the 2025 altseason on the right hand side if you're using computer, and scroll down a bit to see the link if you're using mobile.

$TOTAL Close Lackluster - What This MeansCrypto CRYPTOCAP:TOTAL Market Cap closes another day in its lower range $3.1T, failing to break the 9DEMA.
The TOTAL chart is not given enough credit because most do not understand it.
It’s best used to let us know how much money is sloshing around from narrative to narrative.
Once it definitively breaks that $3.7T range, then a rising tide raises all ships and it's ALTSEASON folks 🚀

v e l o d r o m egood evening.
haven’t posted publicly about velodrome in a while.
privately?
plenty.
last private post:
---
tonight marks day one of alt season.
most were waiting for this moment, hoping for it, convinced they were ready,,, until they weren’t. until the rug was pulled right before it began. they watched it slip through their fingers.
and that feeling will haunt them. every green candle, every new high, every alt that explodes without them. they will tell themselves they’ll buy back in, that they’ll catch the next dip, that they’ll get another chance.
but they won’t.
because by the time they realize what’s happening,
we’ll already be too high, too far gone, too deep in the run.
---
confession:
we pulled the rug.
for a reason.
for the future of velodrome.
now that we hold all of the supply,
there are no interruptions.
nobody left to sell.
nobody standing in our way.
the top forms,
when we decide it forms.
until then,
enjoy the ride.
#superchain
🌙

TradeCityPro | BTC.D The Best Way to Find Alt Season!👋 Welcome to TradeCityPro Channel!
Let's go together to one of my favorite charts, which is actually a topic that has made the crypto market easier, and if it weren't for these dominances, I would probably go to analyze Forex together.
🌐 Overview Bitcoin
Before starting the analysis, I want to remind you again that we moved the Bitcoin analysis section from the analysis section to a separate analysis at your request, so that we can discuss the status of Bitcoin in more detail every day and analyze its charts and dominances together.
This is the general analysis of Bitcoin dominance, which we promised you in the analysis to analyze separately and analyze it for you in longer time frames.
📊 Weekly Timeframe
In the weekly time frame, Bitcoin dominance has had a very good upward trend and after the 39.40 to 47 percent box exit, this upward trend has begun, and I must also say that supply and demand There is no demand for this chart and many lines cannot be interpreted in it
After the resistance level of 54.20 was broken, we were bullish the entire time and this chart was practically telling us that it is better to go and pay attention to Bitcoin itself than to be involved in buying baskets and other things and Bitcoin itself is going to give more profit during this period
And another argument arises that if you pay attention, most altcoins are at their bottoms, while Bitcoin is completely above its ceiling of $69,000 compared to previous bull runs and only altcoins that were in a good position compared to Bitcoin were profitable, such as solbtc, and this shows that the time for strange profits for most altcoins has not yet come
When will this happen? When the market is bullish, Bitcoin dominance starts to fall and money flows from Bitcoin itself into other altcoins, and that is when altcoins are just starting to come alive and make a good move, like in 2021.
See the chart above, there is a chart that shows the fall of Bitcoin dominance in the weekly time frame, while the market has made a short correction and is going to record a new high again, and now the reaction of altcoins in this space is interesting.
Now we have the chart of this event. We see that during the fall of Bitcoin dominance, it was the time when the majority of the charts started to move, and altcoins experienced a Sharpe rise, and money flowed from Bitcoin into altcoins, and the btc altcoin pair became bullish, and this shows that we are witnessing alt season.
Now what happens? On the chart, I would say that we have entered the alt season? Weekly engulfing of Bitcoin dominance or a sharp decline and rest. On the other hand, I think we are at the end of the uptrend because there is really more money on altcoins and other events, and this money is staked, so we probably won't see any other numbers. On the other hand, when we reach 40%, we can say that our alt season is over!
📝 Final Thoughts
Stay calm, trade wisely, and let's capture the market's best opportunities!
This analysis reflects our opinions and is not financial advice.
Share your thoughts in the comments, and don’t forget to share this analysis with your friends! ❤️

This Coin Is A POWERHOUSE MartyBoots here , I have been trading for 17 years and sharing my thoughts on AAVE here.
AAVE is looking beautiful , very strong chart for more upside
Very similar to XRO which mooned from this structure
Do not miss out on AAVE as this is a great opportunity
Watch video for more details

FET | ALTCOINS | Fetch.AI - GREAT Re-Accumulation ZoneFET was one of my top altcoins for 2024, and it did not disappoint after a 500%+ increase early last year.
FET has since been trading in a major corrective cycle, with near-term bounces (also called mid-cycles or mini-cycles).
A great re-accumulation zone is approaching, and it's possible that FET may trade range before making another push for the upside.
Make sure you don't miss yesterday's update on another great alt, ARKM:
______________
BINANCE:FETUSDT

BTC Breakout soonBitcoin’s tightening wedge on the 4H chart hints at a bullish breakout.
Break above $102K towards $117K +20%

BTC.D Update = What happened to the ALT SEASON?I had this possibility on the back of my mind but didn't think it'd play out since things are much different this time
I obviously missed the last downward movement (even though I had it marked on USDT.D + some alts)
PS. Trust me, BS news you see is just an excuse. It's almost always in the chart (in this case, tariffs) = This is how I was able to predict 5th August bottom (in that case, it was the Japanese Yen news but in reality, it's all in the chart but I missed it this time and I'll accept it, I was too busy so never looked at it.. the reason I stopped posting after November)
It would be wonderful if you guys interact and keep things on your panel too!

USDT.D (how to find local reversals? no alt season this cycle?) sorry I forgot to post it here a week ago after the crash
I had that shit marked (small green box for a powerful reversal), which hit in the first week of December, but I forgot to check it out—lol, was too busy with other things = can anyone at least remind me or everyone's a lazy ass like me, these days?
Anyway, it was a perfect local top indication (USDT.D along with other macro charts are the best possible indicators for local top/bottom. One must capture these beautiful reversals where you have at least 80% of confidence, to accumulate more and more of your favorite tokens)
Trust me, BS news you see is just an excuse. It's almost always in the chart (in this case, tariffs) = This is how I was able to predict 5th August bottom (in that case, it was the Japanese Yen news but in reality, it's all in the chart but I missed it this time and I'll accept it, I was to busy so never looked at it.. the reason I stopped posting after November)
Good thing we still haven't reclaimed the macro trendline.
and look what happens after such long wicks into resistances ... (5th August one, 22nd Jan, and last year's)
and CT getting bearish? I get it that normie retails are fearful but good big CTs ???
This cycle really is different...
LOWER it now !!! (obviously there are many other confluences I've found but I'm too lazy to mention all that here)
PS. Yes, there will be an alt season and it will catch many off guard since most have lost hope and capitulated already.
It would be wonderful if you guys interact and keep things on your panel too, so we don't miss any market movements!!! I don't Trade full time, it's just 1/4 of my gigs

$ZRO Structure changed but I'm obviously still bullish
we're going way higher (next post on clarification of what happened? sorry I forgot to post here earlier... my bad)

Altcoin Season - 2017 vs 2021 vs 2025OTHERS/BTC is a good barometer for "Altcoin Season"
OTHERS charts the total market cap of every crypto excluding the Top 10 by market cap tokens
BTC is charting BTC by market cap
It's obvious we are in 4 year cycles, and obvious this season starts after BTC breaks all-time high.
The idea is simple - BTC breaking all-time high increases awareness from the public. People then enter into BTC. After they enter into BTC, they look further down the risk curve (altcoins). 2017, then 2021, now 2025. The "Altcoin Season" typically lasts for ~1 year.
Everyone in the crypto world is freaking out right now, calling for the cycle to be over with and that "altcoins are dead" --- this happens at this point every cycle. If you have been here for 8+ years, you will notice the same pattern repeating in people's emotions/psychology.
Steady Lads, "Altcoin Season" is coming soon.
- CURB (@CryptoCurb)

CELO LONGCelo has bounced every time it touched the lower range around $0.40, usually reaching at least $0.25.However, given the current market conditions, I expect either more downside or a sideways movement in the next few days.
The Stoch RSI is gearing up for a bullish cross on the weekly, but historically, the first cross is often followed by a negative one, before a second bullish cross that truly pushes the price higher. So while we might see some short-term upside, we should also be prepared for lower prices before a more significant rally kicks in.

This Breakout Will Trigger Massive Altseason!Hello, Skyrexians!
According to your activity we noticed that you are interested in Bitcoin and CRYPTOCAP:OTHERS.D analysis. This is not a top secret because everyone wants to know when altseason will be started. In our recent we warned you about drop for altcoins dominance below the support level and it happened next day. Now we have the potentially reversal signal, be need to wait for it's confirmation.
On the weekly chart we can count the previous massive altseason as the wave 3. Previously we considered corrective wave 4 as the triangle shaped, but now it looks like classical ABC. If this is correct, dump on dominance can continue, but the potential reversal signal has been flashed by the Bullish/Bearish Reversal Bar Indicator . This signal still has not been confirmed, but if candles will break 9% the huge rally in wave 5 is incoming - true altseason.
Best regards,
Skyrexio Team
___________________________________________________________
Please, boost this article and subscribe our page if you like analysis!

ARKM | ALTCOINS | Is another 400% Increase Possible??ARKM is an altcoin that has great upside potential, and it's approaching a key support zone - the opening levels.
The good news, is that the corrective pattern (in the macro timeframe) is nearly over. However, there are large bounces possible between these zones that look "small" in the weekly timeframe:
_____________________
BINANCE:ARKMUSDT

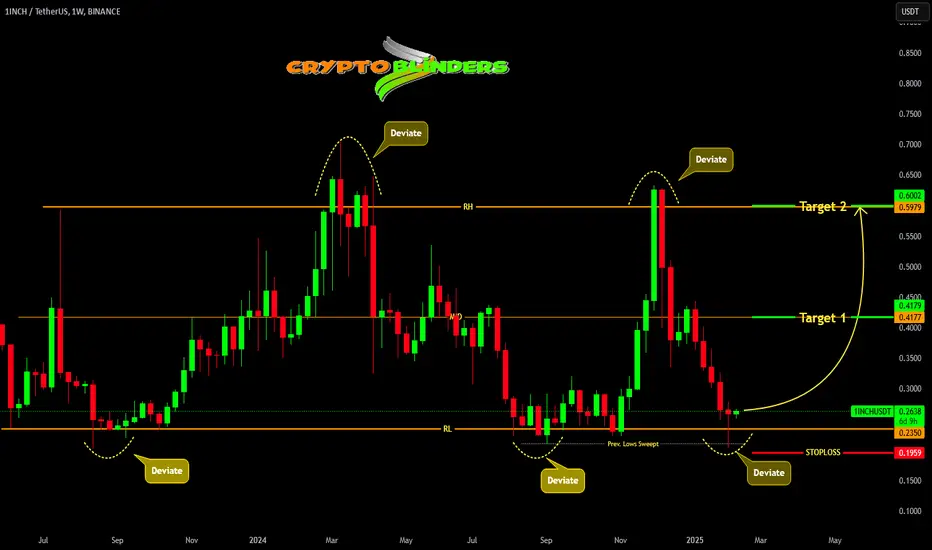
1INCH ABOUT TO MAKE A BIG MOVE !!!1inchusdt been trading in a range, had recently swept previous lows and deviated range low and reclaimed it. It signs a strength and we can expect targets of mid range and range high putting stops below recent low.
The End of Bitcoin ( Alt started Great Rotation )BTC dominance is ending, marking the start of the great rotation. Targeting a 40% shift, equivalent to $800B in capital flows at the current market cap. Happy to see Alts great rotation.
