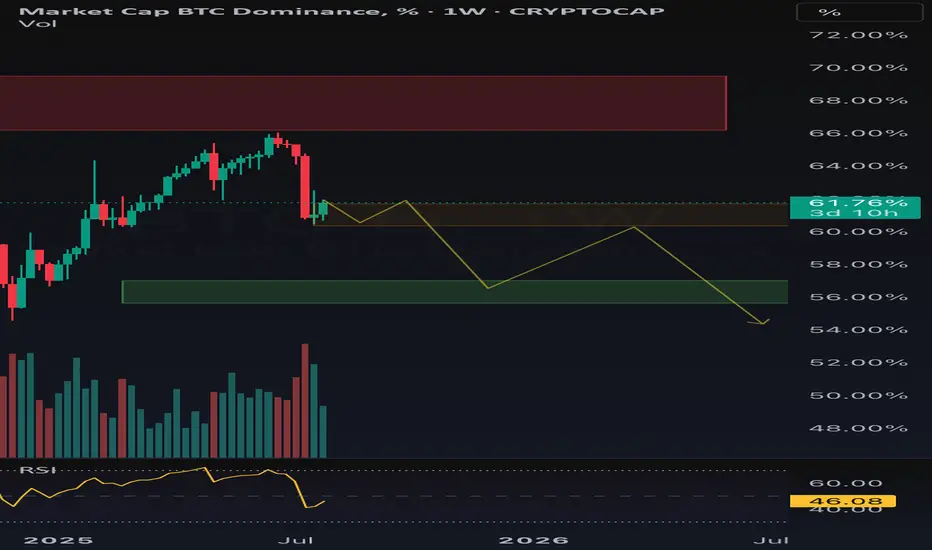
$BTC.D WeeklyConsidering that from the red zone, there has been a strong pullback accompanied by volume, I will continue my projection where these are the weekly targets for CRYPTOCAP:BTC.D
All these points have been calculated using FIB
Altseason
Opening A Small Position In FARTCOIN HereGood Morning Trading Family,
I may be a little early here, but at $1.00, I can't resist. I am picking up a small position in FARTCOIN here. I have three targets above. Each will eventually be hit IMO, but for now, I will only be shooting for TARGET #1. I may sell half at that point and let the rest ride.
Now, here are the technical reasons for making my entry here without waiting for my indicator to signal.
First of all, there are three trendlines, all significant, all converging at this one particular point, making this a powerful area of confluence!
Secondly, we broke to the topside of that descending trendline but never really came back to kiss mamma goodbye. Today we are doing that! This is a patent technical move that indicates healthy price fluctuation and is exactly what I have been waiting for.
Third, the VRVP indicates a ton of volume in this area (mostly buyer), which will be tough to break below without significant FUD, which, of course, is always a possibility.
Finally, all of my lower indicators show this thing is starting to get oversold: RSI, MACD, Chalkin MF, HA.
If we do dip lower, I will simply increase my position unless I hit my SL first. My SL is around .78 with my projected first target at 1.66 for a nice 1:3 rrr.
Good luck, all!
✌️Stew

Crypto market review: Bitcoin, ETH, and Altcoins Setting Up for Prepared a new in-depth crypto market video update covering BTC, Ethereum, and key altcoins. Here’s a quick summary of the current landscape and what I’m tracking in the charts:
We’ll begin with Bitcoin. After the Fed’s decision, BTC showed a constructive shakeout and has been consolidating tightly around the same range for three weeks. I previously anticipated resistance near the 1.23 area and expected a sideways phase within the 1.15–1.13 support zone. That’s exactly what we’re seeing—shakeouts and quick recoveries. As long as we stay above 1.13 structurally, and especially above yesterday’s highs short-term, I expect BTC to push higher toward the 1.26–1.30 resistance zone.
Institutional buying during the post-Fed dip has been significant. Volume on Coinbase and Binance indicates strong participation, and Bitcoin treasuries have been accumulating. This bolsters confidence in the underlying trend structure.
I wrote in mid-July about BTC’s broader macro structure—this resistance region may trigger a prolonged consolidation, but ideally without breaking June lows. Short-term bias remains bullish.
Ethereum remains the strongest large-cap altcoin. It has respected the 8EMA on pullbacks and shows strength to target 4300–5100 in the coming weeks. It continues to lead risk-on sentiment.
XRP has been deep in consolidation, but we may be seeing a higher low forming. Any rally in BTC and ETH could lift XRP toward 3.30–4.60 levels, possibly even 5.00.
Solana showed strong action through late July, pulling back into mid-term support. As long as this structure holds, I expect upside toward 220–230 and potentially reclaiming ATH zones.
Hyperliquid has been a laggard but held its key macro support. If yesterday marked a bottom, I’ll be watching for higher lows and a move toward 55–60.
Other notable setups:
Brett: Both showing impulsive structures from April lows. Brett in particular looks poised for 74–77, potentially retesting May highs around 95.
ONDO: Recovering key zones and shaping a potential bottoming pattern.
SUI: Leading structure from July lows. After a likely wave-one completion, it could extend toward 5.15–7.70 before topping.
RENDER: Looks to have finished its correction. Potential long-term upside beyond May highs; the macro uptrend might already be underway.
SUPER: Since July breakout, forming a strong trend structure. If it holds the higher low, could reach 1.20–1.46 in coming weeks.
TON: Slow mover, but the macro pattern suggests a bottom with potential toward 4.60 short-term.
LINK: Hasn’t finished its move. Watching for 21–22 as a next target.
FET / Fetch.AI: Macro structure looks great. Watching for recovery from June lows with potential for strong continuation if structure holds.
Trump Coin: In a diagonal pattern post-failed impulsive breakout. If higher lows hold, watch for rally toward 13–14.
LTC: Linear and clean structure. Looks ready to push toward 130–145 before potential base-building.
UNI: Targeting 14–18+ in wave continuation if structure holds.
Let me know in the comments if there’s a specific coin you’d like me to go over. I’ll include it in future updates or make a quick standalone video.
Thanks for watching, and I wish you a successful trading week ahead. Let’s see how far this rally can go through the rest of the summer!

BTC.D FIB Lvl RejectionI'm liking the recent pullback in Bitcoin dominance - we're finally getting a taste of those altcoin gains we last saw around December. Each time dominance hits a key level on the Fibonacci retracement, we tend to see a pullback, and this recent rejection near the 0.786 level is no exception. It's a recurring pattern worth keeping an eye on.
That said, I still believe there’s a chance for one final rally in Bitcoin dominance - a potential shakeout before the real altseason begins. Historically, when Bitcoin breaks out of consolidation and pushes to new all-time highs with strong displacement, dominance tends to dip shortly after. So if BTCUSD continues to range at these current levels, I wouldn’t be surprised to see dominance spike again before we get the real altcoin momentum everyone’s waiting for.
This can also relate to what I've been reviewing in my previous charts published on my page

Healthy Retest After Explosive Move – XRP Eyes More UpsideCRYPTOCAP:XRP broke out of a long accumulation range and is now coming back to retest that breakout level, a classic and healthy move.
If this retest holds, we could see the next leg up kick off soon.
Accumulated. Broke out. Now confirming.
DYOR, NFA

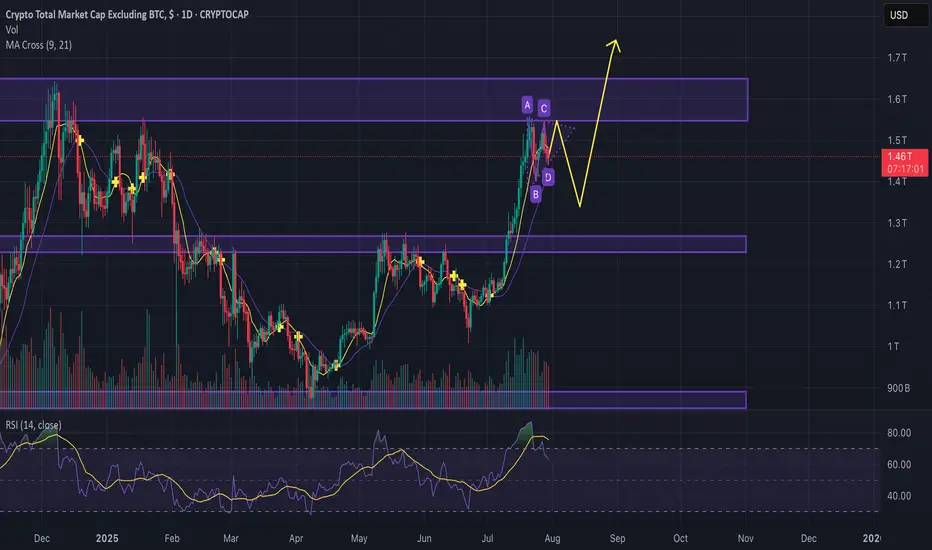
Is altcoin season over before it even started?Guys,
Gonna break down the situation on the chart to see where we can go next with the altcoins.
We see the key resistance levels and now we moving in kinda bullish pennant, but considering descending volumes we can easily test the support line and go back to the 1.25T. (maybe even lower)
After that, seems like we can try to go back and break the 1.64T resistance zone and previous ATH.
Anyway current market is going to be way more different from previous cycles, because huge institutions can feel nice only in hyper volatile, so divide your strategy between short, mid and long term investments to take profits.
Good trades and share your thoughts down to see what others think.
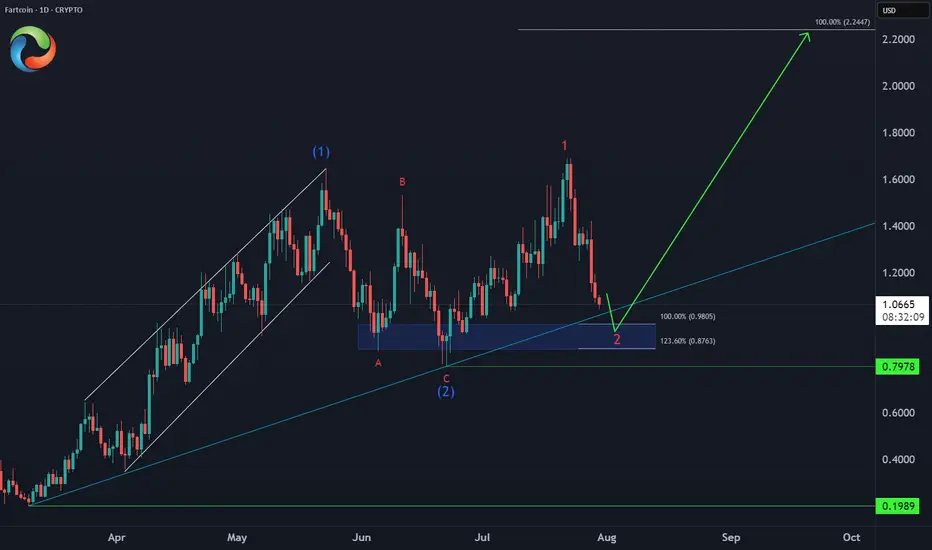
FARTCOIN Bullish Setup 📈 CRYPTO:FARTCOINUSD Entering an extreme buying area:
✅ Key support zone: $0.98-$0.87 (April trendline + equal legs)
⛔ Invalidation: $0.79
🎯 Target: $2.20 (124% upside)
This is how explosive meme setups look before liftoff.
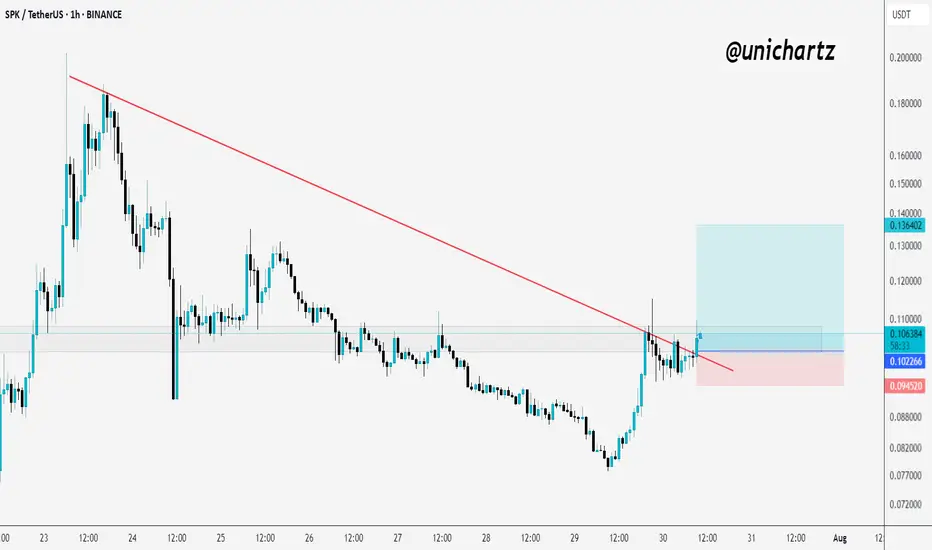
SPK Breaks Trendline – Long Setup with R:R 5.7INDEX:SPK Breaking the Downtrend – Long Setup in Play
SPK has finally broken out of its falling trendline after days of compression. Price is now testing the breakout zone with a small consolidation — a classic sign of strength building.
If momentum continues, we could see a solid upside push.
✅Trade Setup (Long):
Entry: 0.1009
Stop Loss: 0.0945
Target (TP1): 0.1364
DYOR, NFA
[Deep Dive] SUSHI – Edition 3: Accumulate. Anticipate. Accelerat🧠 Cycle Anatomy: What the Chart Is Telling Us
📉 Phase 1: Markdown
The bears dominated, slicing price downward into key historical support around the $0.50 mark — the same level that anchored the previous accumulation zone.
📦 Phase 2: Accumulation
Both accumulation phases (mid-2023 and Q2 2025) occurred near identical support zones, with rounded bases and sideways chop — signaling strong hands quietly absorbing supply.
📈 Phase 3: Markup Incoming?
Following breakout point “1” and retest point “2,” the current structure aligns remarkably well with the previous markup phase — which propelled SUSHI from ~$0.50 to over $3 in just weeks. While past performance isn’t a guarantee, this fractal deserves attention.
🔥 Why Fundamentals May Support This Move
- SushiSwap v3 continues rolling out on multiple chains, optimizing capital efficiency and fee structure for LPs.
- Governance has stabilized after the rough patches of 2022–2023, with more transparent treasury and development direction.
- Cross-chain expansion and integrations with major aggregators (like 1inch, Matcha, and DeBank) are boosting SUSHI’s visibility in the broader DeFi flow.
Additionally, a surge in TVL and DEX activity on low-fee chains could redirect volume back to SushiSwap — a platform known for its cross-chain capabilities.
📍 What to Watch Next
- A confirmed breakout above $1.00 would validate the “markup” thesis.
- A dip toward the $0.65–$0.70 zone could offer a high-risk/reward entry aligned with point “2.”
- Failure to hold the $0.50 level would invalidate the structure.
For now, the rhythm is clear: markdown → accumulation → markup. And if the pattern holds, SUSHI might just be preparing for its third vertical.
💬 Do you think this is just another fakeout — or is SUSHI gearing up for a DeFi comeback?
🔔 Disclaimer: This post is for educational and informational purposes only. It does not constitute financial advice. Always do your own research and manage risk carefully.
📚 Always follow your trading plan => including entry, risk management, and trade execution.
Good luck!
All strategies are good, if managed properly.
~ Richard Nasr

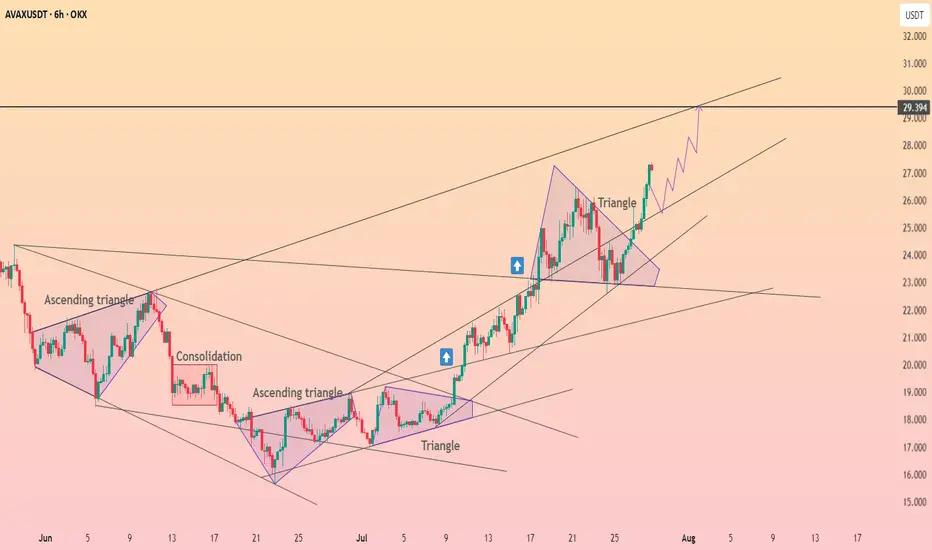
Avalanche broke through the $26 level ┆ HolderStatBINANCE:AVAXUSDT is consolidating just beneath the $33 resistance after reclaiming a prior range high. Price action is forming a classic bull flag while higher lows continue to support the structure. A breakout above $33 could confirm bullish continuation toward $35 and $36. Momentum remains strong as long as the $31.5 support holds, making AVAX one of the key watchlists this week.
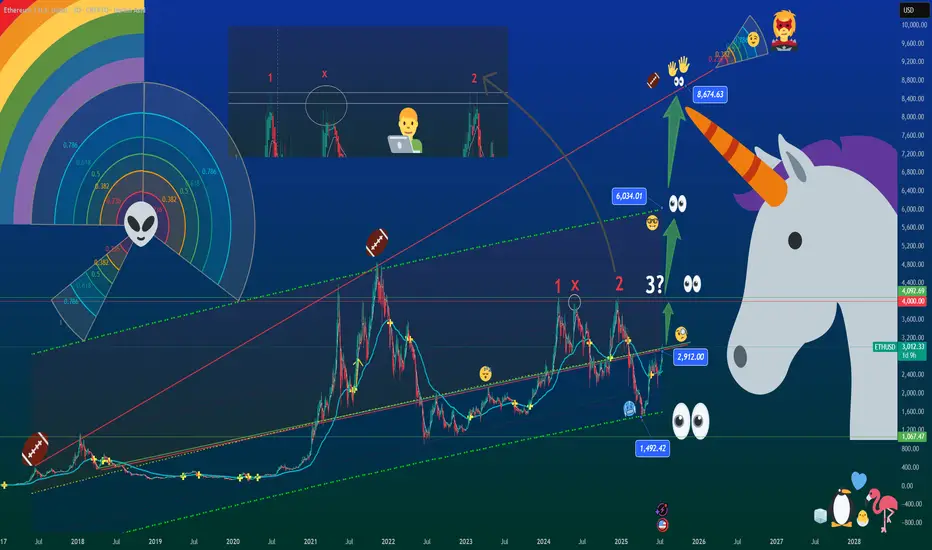
The Unicorn Breakout – Regression, Madness & Meme Math🦄 The Unicorn Breakout – Regression, Madness & Meme Math
FX_Professor | July 14, 2025
🎨 Welcome to my world…
Some draw straight lines.
I draw quadratic regression channels, alien spirals, and unicorns.
Because sometimes, the market is not just math — it’s emotion, storytelling, and madness therapy.
This chart isn’t just analysis. It’s a prophecy. It’s a canvas.
It’s for the traders who still feel.
📈 What are we looking at?
🧠 The Setup:
- Quadratic Regression Channel: Anchored from the 2018 top, respected for over 7 years. ETH is bouncing off the midline like it heard destiny calling.
- Major Resistance: The $2,900–$3,100 zone is our historic ceiling. Marked as 1 – X – 2… and next, not maybe but SURELY the decisive number3? 🚨 (X stands for 'no touch' ie 'close but no cigar' - Look at my recent BTC 1-2-3 breakout posts!)
- My Golden Cross: Quietly forming support. Check that xx/Xxx Secret EMA crossover. Setup reserved as a little family secret destined to be passed on to my sons (and some of you!).
- Alien Spiral (not Fib 😉 ): A colorful vortex leading us toward areas of re-accumulation and expansion. ETH is now riding the 0.382 arc — and you know what that means...
🚀 Targets:
- $4,000 — First milestone and zone of psychological resistance
- $6,034 — Mid-regression line + historical extension
- $8,674 — Unicorn Target Zone. Meme ATH + Euphoric breakout + Regression logic
👽 The Floor:
$1,067 – $1,492 — Alien Support Range™. If we nuke, that’s where we land, in pain. That's when we apply for jobs at Taco Bell (at least i love the food there, i am prepared for that scenario too).
🦇✨ Ethereum Community — this might be your time.
Dear ETH fam...
This isn't hopium.
This is regression math meeting Breakout Structure.
ETH has reclaimed key levels, rotated capital is flowing, and Bitcoin dominance is peaking. . WAIT FOR MY ETHBTC ANALYSIS (ON SUPPORT AND REBOUNDING)
The Unicorn doesn't knock twice.
If Ethereum Season is real — this chart might age beautifully.
🤹 Why the chaos?
Because markets are art.
Because crypto is culture. (and yes it's also 90% shit, you will hear a lot about that when that time comes).
Because every emoji here has meaning:
🦄 = Imagination
👀 = Momentum watchers
👽 = Alternative thinking
🏈 = Painful resistances, mental and physical toughness builds champions. Patience Wins!
🥶 = Cold accumulation
🧑💻 = Professor mode
🐧❤️🔥🐤🦩 = Read below…
🧊 The Penguin Message
Bottom right, you’ll see a penguin family :
A penguin, a flamingo, a baby chick, and a blue heart.
That’s not just decoration — it’s the real alpha.
💙 The best blockchain is YOU.
👶 The best altcoins are your CHILDREN.
🧊 The best staking is your FAMILY.
Trade smart. Build cool stuff. But don’t forget to be a good human.
The charts will wait. But your people won’t.
Spend time wisely: Learn skills, invest in YOURSELF, enjoy moments with loved ones, make others smile, be that change in the world.... and if you don't have kids then what on earth are you doing?? Go get laid, now! You are ready, stop thinking, just Do It (disclaimer: unless you have 5 already, in that case pls invest in condoms)
Share this with someone who needs to see this. Or just save it as 'ETH season'.
FX Professor — out.
🦄📈👁️
#ETH #Ethereum #UnicornBreakout #CryptoArt #QuadraticRegression #Altseason #TradingView #ChartTherapy #BeAGoodHuman
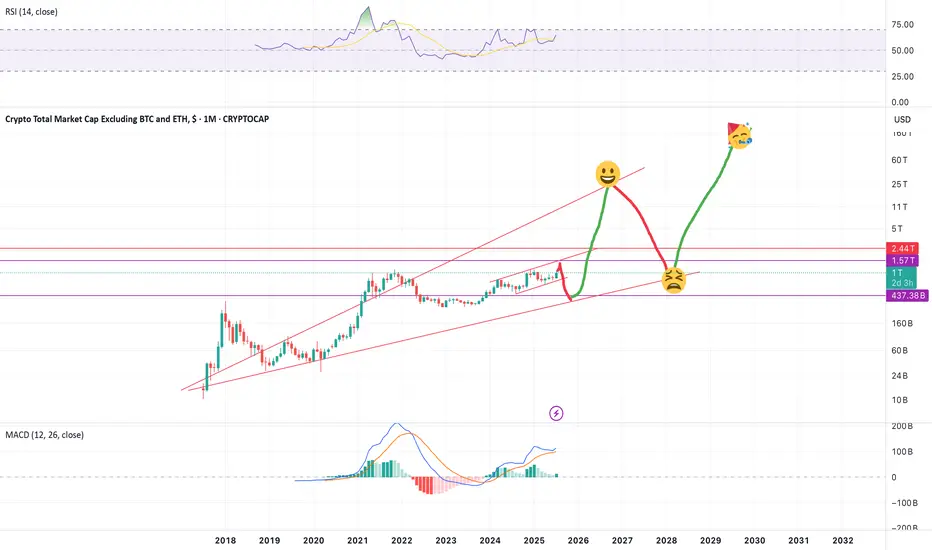
Total3 Wild ride, will make Millionaires and reck Millionaires this is not a financial advise but this is how i'm playing it
an investment of $10,000 can make you millions if played right.
buckle up
AITECH Main trend Channel Wedge. Reversal zones. AI. 30 07 2025Logarithm. Time frame 1 week. Main trend. Huge pumps for hype. The price is driven up on dexes, and profits are realized on centralized medium and low liquid exchanges. Important. Twitter (X) of the project has 560 thousand subscribers. That is, at the right time there will be a flow of positive news for subscribers who are former holders, or potential buyers (there are most of them, they buy only very expensive ones) and pumping as before, but by a smaller percentage.
And while in the ascending channel, the decline phase forms a descending wedge in the secondary trend. A triangular formation has formed in the local trend. The logic of the reversal zones is shown with arrows.
What is it. From the marketplace:
Solidus AI Tech is building one of Europe's first Web3-based AI infrastructures, powered by a state-of-the-art, green HPC data center. The $AITECH token powers an ecosystem of products that combine AI utilities, scalable computing, and Web3 tools, empowering developers, enterprises, and institutions to easily build, deploy, and scale AI solutions.
With the support of major partners including NVIDIA, IBM, Fetch.ai, Tron, BNBChain, Binance Wallet, Trustwallet, and many more, Solidus AI Tech is becoming one of the most advanced and adaptable Web3 AI token projects, positioning itself among industry leaders.

SEI : The best future belongs to this coin.Hello friends🙌
Given the rapid growth that this coin has had and I think it will continue, now that the price is correcting, there is a good opportunity to buy in stages with risk and capital management and move with it to the specified goals.
🔥Follow us for more signals🔥
*Trade safely with us*

PHA Main trend since 2020. Hype Web3 AI 07 2025Cryptocurrency as an example. This applies to all similar assets by liquidity. Logarithm main trend. Time frame 1 week (smaller time frame, to understand the shown and described, is not necessary). Cryptocurrency is an imitation of utility with a good legend, which is traded on liquid exchanges (in the decline phase in the next cycle) most likely there will be delists, if they do not make a “restart” (rebranding). A big plus in the crypto legend of this project is that it is mentioned as the basis of the legend of Web3 and AI.
What is it. Phala Network is an execution layer for Web3 AI. By allowing AI to understand blockchains and interact with them, it removes the barrier for the first billion users joining Web3.
Phala Network's multi-security system is a solution to the problem of AI execution. Based on Phala Network, you can easily create hack-proof and unstoppable AI agents tightly integrated with on-chain smart contracts using AI-Agent Contract.
Agentize smart contracts: create AI agents for smart contracts using natural and programming languages.
End of participation phase. Created a project at the end of the participation phase in 2020 09 before entering the distribution zone of the last cycle with the highs of 2021.
Market distribution . Then, under the hype of alts, very aggressive convincing marketing and pumping over +1500%. Long distribution (more than 9 months) with price retention at a huge profit and publication of convincing fairy tales-news for “pouring” fresh fuel (mass pipel) through info wires in the market distribution zone of 2021.
Phase of decline to the recruitment zone. (partial change of hands, those who created, they do not need it). Phase of decline from the sales zone (advertisement is good), to the purchase zone (no advertising, no activity) -93%. That is, the “fresh fuel” money of investors turned into “dust” on the spot (conditionally $ 1000 of super promising next "shit", in $ 50-100), on futures still in the distribution zone “disappeared”.
Phase of accumulation (use of many short alt seasons to shake the price and “shake out”). Upon reaching the recruitment zone, — reverse. They made a reversal, pump-buyout of liquidity (their heavy orders) by a large % (+580%), which served as the starting points for the formation of the horizontal pump / dump channel range, that is, conditional accumulation.
Now another wedge is being formed locally in the horizontal channel — its breakthrough, the beginning of the pumping and another altseason, which can develop into the participation phase.
It is worth noting that they can enter the long stop loss and long liquidation zone when forming a wedge (this often happens). Take this into account in your money management in advance. Accept risks, or distribute entry money when implementing force majeure in advance, even if you do not lie that this is possible. The capitulation phase (part of accumulation, liquidity collection), that is, “dumping passengers” and the final liquidation of their faith, does not always happen, which is logical.
On weak assets (very old, low liquidity), outright scams that have "outlived their usefulness", the capitulation phase sometimes ends in a complete scam.
Alt-seasons of accumulation and capitulation zones . During this time, there were 3 average alt seasons, which naturally affected the price of this cryptocurrency (3 pumping waves in the channel +580%, +300%, +650% (average gain/drop conditionally in half), price movements in the median zone of a large trend channel.
Participation phase — most likely, there will be a series of pumps with sticks under the market trend as a whole, and most importantly, the hype of everything related to AI.
Distribution phase — most likely will be shorter in time than before, and still I would exit mostly under the mirror zone of the previous distribution, as the project is “old”, the hype "the chart remembers the deceived investors". Then two options, the development of the paths of which depends on the market as a whole, and not on this candy wrapper.
a) Consolidation and exit from it to the second zone of the final distribution ("the hamster is not scared", "it will grow forever").
b) Transition to the decline phase, then the fading of marketing, the final loss of liquidity (supporting the project with money), and a gradual (delists, regulation, norms) or sharp scam (hacking, etc.).
It does not matter which path we take in the distribution phase, the final path, like everything similar created under the hype, is the loss of liquidity, oblivion and scam. Therefore, do not forget to sell such (99.999% of the crypto market) at high prices, despite the positive news deception creeping into the mind through the ears and eyes.
Rebranding. Restart. Resetting price charts. If they do it like EOS and similar "old" scams — rebranding (preparing for a new market hype in advance), and remove all charts from exchanges, so that for the new market hype as a whole, the project would be “fresh” according to the chart, new, that is, the previous scam of "few experienced investors" would not be visible, then pumping up more than +1000% is possible, but this is irrational... As you need to spend a lot of money, it is easier to create a new imitation of something useful...
The market phases are clearly visible on the chart. I also described everything in detail.

AVVE IS TIME TO BUYHello friends🙌
Given the good growth we had, now in a correction there is a good opportunity for the price to reach our high volume range or even lower and we can buy in steps and with risk and capital management.
🔥Follow us for more signals🔥
*Trade safely with us*

Price floor: The opportunity to buy has arrived.Hello friends🙌
According to the decline we had, you can see that the price has reached its historical low, which has given good profits whenever it reaches this low. Now, with capital and risk management, we can buy within the limits of the low and move with it to the specified targets.
🔥Follow us for more signals🔥
*Trade safely with us*

The meme coin you must haveHello friends🙌
Given the decline we had, you can see that the price has exited the descending channel and entered the ascending channel. Now we can buy in steps with capital and risk management.
Follow us for more signals🔥
*Trade safely with us*

Memecoin is risky but profitable...Hello friends🙌
Given the channel's failure on the weekly time frame, there is now a good opportunity to buy in the price reversal or price correction, of course, with capital and risk management.
🔥Follow us for more signals🔥
*Trade safely with us*

Memecoin with potential for purchase.Hello friends🙌
Considering the decline we had in the weekly timeframe, you can now see that with the good growth we had, it gives us a good signal to buy, of course in a stepwise manner and with capital and risk management.
🔥Follow us for more signals🔥
*Trade safely with us*

Solana maintains its upward structure ┆ HolderStatBINANCE:SOLUSDT is bouncing from the $170–172 zone, building higher lows just below resistance at $180. The structure is shaping into a rounded bottom with signs of accumulation. If SOL clears $180 with volume, targets lie at $188 and beyond. Trend remains bullish as long as price stays above the local demand zone.

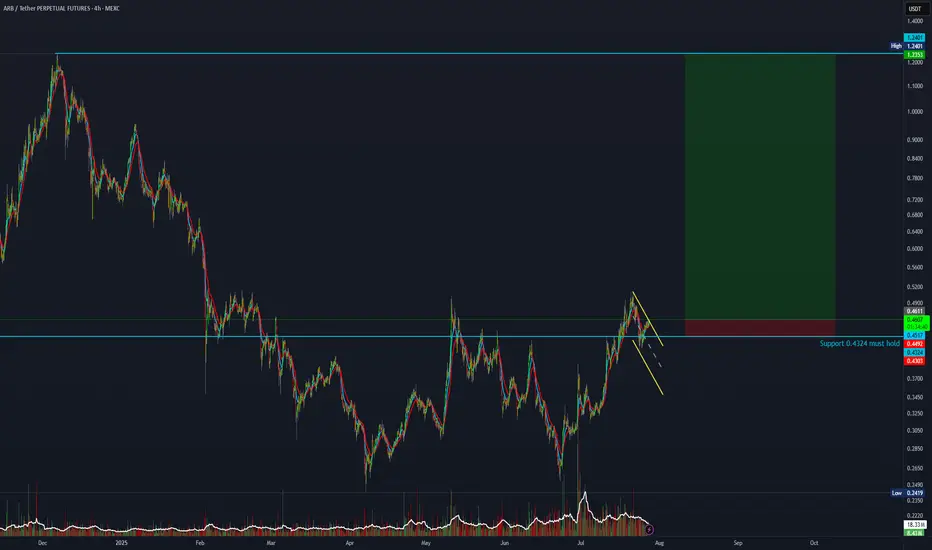
25:1 R:R trade setup on ArbitrumThis is it — a high-risk trade setup with a 25:1 R:R.
Entry: 0.4611
Stop Loss: 0.4303
Target: 1.2300
Not financial advice. Risk only 1% of your portfolio.
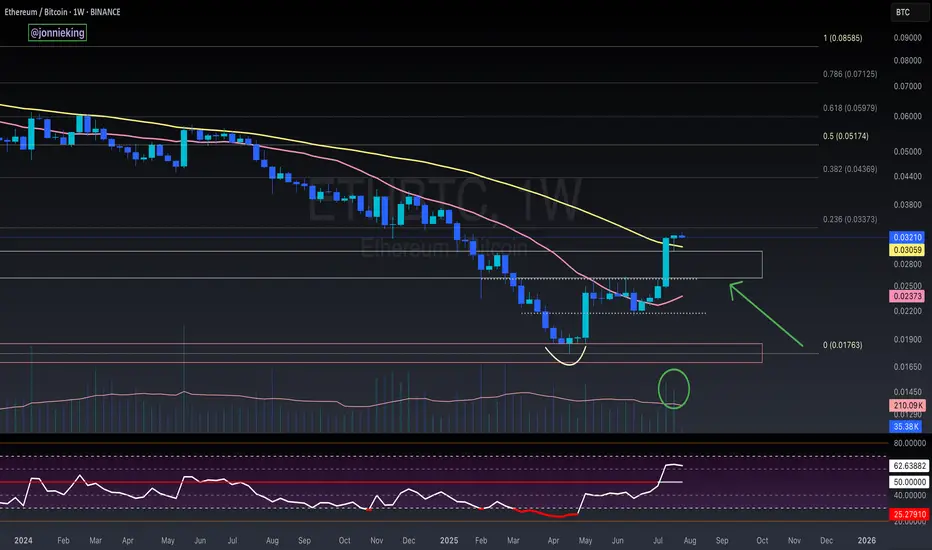
$ETH 2nd Weekly Close Above 50MA = Alt Season2nd Consecutive Weekly Close
above the 50MA for CRYPTOCAP:ETH
✅ Volume to confirm the breakout.
✅ RSI has bottomed.
WHAT TO WATCH 👀
┛Bullish Cross on the 20/50MA to confirm the next leg up.
┛Approaching some resistance ahead at the .236 Fib
┛Expect a small pullback in the next week or two so make sure to get your bids in.
Remember the rotation:
✅ BTC > ✅ ETH > Large Caps > Mid Caps > Micro Caps.