From Rejections to Breakout? CAKE Faces Key TrendlineNASDAQ:CAKE has been stuck in a long-term downtrend, constantly getting rejected from that falling red trendline.
But things are starting to shift...
After bouncing off the major support zone, price is once again pushing toward that trendline, and this time, momentum looks stronger.
If CAKE can break and hold above this level, we could finally see a powerful move toward the $5+ resistance zone.
Just a heads-up: it’s been rejected here before, so let the breakout confirm before getting too excited.
DYOR, NFA
Altseason

THETA Bounces Off Key Support – Eyes on Resistance!After months of holding above the key support zone, MYX:THETA is finally showing some strength.
Price is bouncing off the lows and heading toward a minor S/R zone.
If the bulls can break through this level, there’s a good chance we’ll see a move all the way up to the upper resistance line.
DYOR, NFA

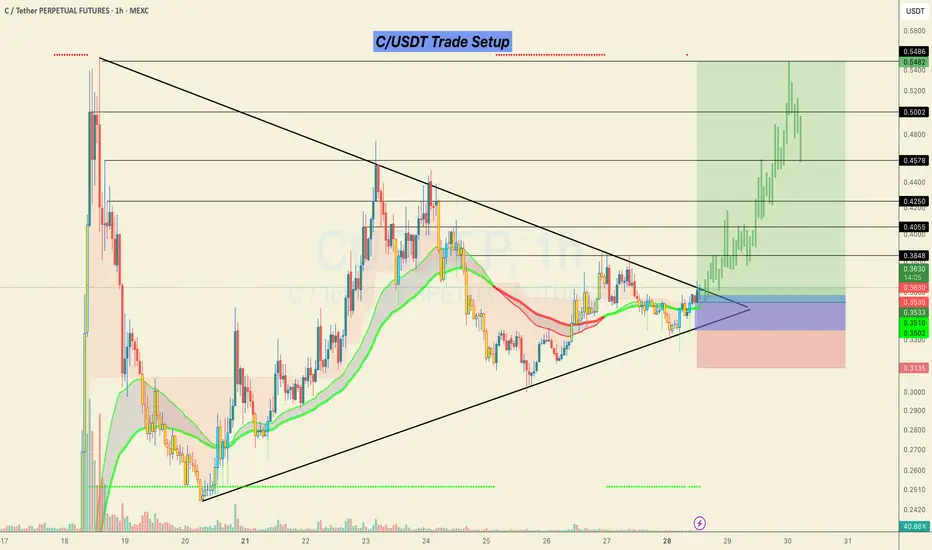
#C/USDT Looks ready for a 50% bullish move.C/USDT Trade Setup 📉
Currently forming a strong breakout structure after a long consolidation inside the triangle.
📌 Accumulation Zone:
0.3350 – 0.3580
🎯 Targets (Black Horizontal Levels):
0.4055
0.4250
0.4578
0.5002
0.5486
🛑 SL: Below 0.3135 (previous structural low)
Price broke out with solid momentum and retested the breakout zone. As long as we hold above the EMAs and the structure remains intact, continuation toward higher levels is likely.
This is a low-risk, high-reward setup as long as the risk is managed properly.
> Not financial advice. Trade at your own risk.
Do hit the like button if you want me to post more of these setups here.
Thank you
#PEACE
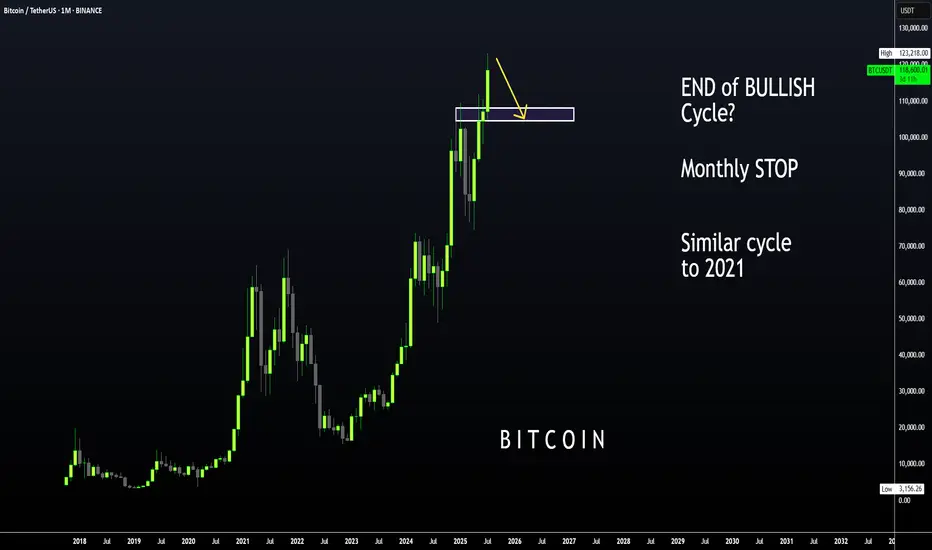
BTC | ALT Season, then BEARISH CYCLE BeginsBitcoin is likely moving in to the beginning of a bearish cycle.
I'm not saying this is immediate, we first need to see altseason - however, if BTC increases it may not go any higher than the last high of $123k. We could easily see the price hover around this zone with a few small increases and decreases for the next few weeks as alts make their respective moves.
I have been talking about the 2021 fractal for a couple of months, where BTC took its time to correct and then made another ATH which was only slightly higher.
We already see a similar pattern playing out in the monthly timeframe if we overlay bars pattern from 2021:
Although Bonce zone 3 may only be in several months, these are the major support zones where BTC could bounce from. Ideal for a swing:
____________________
BINANCE:BTCUSDT
From Hype to Hesitation: What’s Next for Pump Fun ($PUMP)?Today, I want to break down the recent developments and fundamentals of Pump fun ( BYBIT:PUMPUSDT ) and its token PUMP — a project that initially launched with strong hype but is now facing serious investor concerns .
What is Pump fun?
Pump fun is a memecoin launchpad that allows users to launch and trade memecoins in a gamified, simplified environment. The idea was to create a frictionless way for anyone to generate and speculate on meme tokens, leveraging viral growth and community culture.
Its native token, PUMP , was introduced via an ICO priced at $0.004, with 12.5% of the total 1 trillion supply offered during the sale.
Latest Updates – Past 24 Hours Recap
PUMP Crashes Over 50% After ICO :
The token initially spiked to $0.0068 on launch day (July 16) , but has now dropped over 50%.
This is roughly 14% below its ICO price , creating concerns for short-term investors.
Founder Confirms No Airdrop Anytime Soon:
In a livestream with ThreadGuy , project founder Alon Cohen confirmed:
“ The airdrop is not going to be taking place in the immediate future. ”
While the team still plans to deliver an airdrop, Alon emphasized it must be well-executed and meaningful, not rushed for hype.
The current focus is on long-term growth and ecosystem sustainability, not short-term incentives.
Mixed Investor Sentiment:
High-profile trader Machi Big Brother ( Jeffrey Huang ) reportedly increased his long position in PUMP — even though he’s down over $5.8M on his position.
Meanwhile, two wallets linked to private sale investors dumped over 1.2B PUMP at $0.003 , taking a combined loss of $1.19M.
Declining Volume and Market Cap:
Trading volume has dropped significantly.
PUMP has lost over 40% of its value in the past 7 days.
Short-term holders appear uncertain, while the project team asks for patience and long-term vision.
Fundamental Outlook:
Pump fun’s future now heavily depends on:
The real utility of the platform as a meme coin incubator.
The team’s ability to regain trust after delaying the airdrop.
Whether new features or hype can revive volume and user engagement.
-------------------------------
Now, let's examine the PUMP token from a technical analysis perspective
From the outset, I must say that due to the small number of candlesticks that create the PUMP token, technical analysis may be a bit difficult , but we will use technical analysis tools to analyze this token.
The PUMP token seems to be moving in a descending channel since the beginning of its correction (over -50%) until now, we need a second price bottom to confirm the descending channel.
I expect the PUMP token to rise from the Potential Reversal Zone(PRZ) and near the Support lines to $0.0029(+15%) . PUMP Token increase can also be from the bottom of the ascending channel .
Second target: the upper line of the ascending channel.
Cumulative Long Liquidation Leverage: $0.002810-$0.002530
Cumulative Short Liquidation Leverage: $0.003498-$0.00327
Note: Stop Loss(SL): $0.002391
Please respect each other's ideas and express them politely if you agree or disagree.
Pump fun Analyze (PUMPUSDT), 1-hour time frame.
Be sure to follow the updated ideas.
Do not forget to put a Stop loss for your positions (For every position you want to open).
Please follow your strategy and updates; this is just my Idea, and I will gladly see your ideas in this post.
Please do not forget the ✅' like '✅ button 🙏😊 & Share it with your friends; thanks, and Trade safe.

6/ Altseason: Live - Is this really the Altseason?12day Result I know this is the exact question you're asking yourselves as you look at your portfolios. "What altseason? Everything is flat."
Maybe I was wrong two weeks ago when I said it had already started. But, as they say, the result speaks for itself.
12 days ago, as part of the Altseason Live challenge, I started with $10k . Today, the account is at $35k .
Let's break down what's really happening, and why your feeling of having missed out is an illusion.
You are absolutely right in your observations. If we look at most coins, we'll see that they are still at the very bottom. They haven't even begun their main move yet.
Below are random strong projects of the industry
Here is the visual proof. This isn't a "dumping" market. This is a market that is accumulating energy. And that's the best possible news for anyone who thinks they've missed out. The main, most powerful wave of growth that will lift all these coins hasn't even started.
My result wasn't achieved through general market hype, but through surgical, precise trades. I used my coin-picking strategy (which I wrote about in Post 2/ Altseason: Live - My Coin-Picking Strategy) -focusing on projects that play by their own rules. I continue to do deep research and enter every position with surgical precision.
Why August Will Be Incredible. The Calm Before the Storm.
What we are seeing now is the classic calm before the storm. Most market participants don't understand what's happening and are in a state of confusion. But if you look closely, you can see that many projects have already completed their accumulation phase. An immense amount of power is building up under the hood of the market.
I believe that August will be the month when this energy is unleashed. It will be the month that kicks off the explosive, broad movement that everyone is waiting for. And that is exactly why now is the most crucial time. It's not a time for FOMO, but for level-headed preparation.
So, knowing all this, what do we do next?
First, we don't panic. We understand that the main train is still at the station.
We keep hunting for strength. My strategy of finding strong projects remains unchanged.
We use every correction as a gift. Any 15-25% dip on a promising asset is an opportunity, not a catastrophe.
We prepare for August. The next month could be the defining one for this entire cycle.
My result proves that opportunities always exist, even in a "sleeping" market. And for complete transparency, all proof of my trades is broadcasted on streaming platforms. The real fun, the altseason we are all waiting for, is still ahead. Stay focused.
Best regards EXCAVO

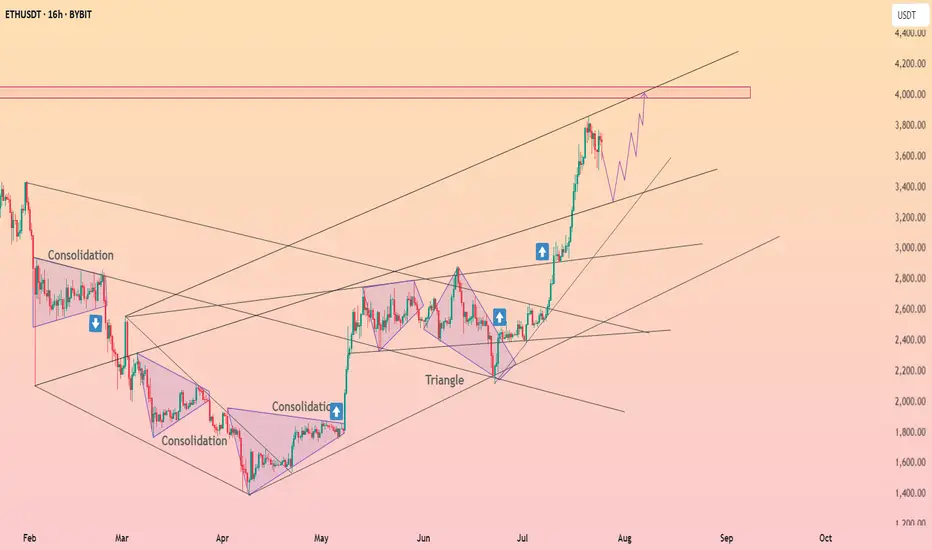
Ethereum Weekly Recap & Gameplan | 27.07.2025📈 Market Context:
ETH followed the broader crypto market momentum led by Bitcoin, supported by institutional demand and positive macro policies in the U.S.
Last week’s plan played out cleanly — we saw strong gains from the 1H demand zone.
🧾 Weekly Recap:
• Price swept 4H swing liquidity and formed a 1H bullish BOS
• Created a solid 1H demand zone, from which price bounced strongly
• Momentum remained bullish as forecasted in last week’s post
📌 Technical Outlook:
→ Expecting a short retracement into 4H liquidity levels around 3761$ or 3702$
→ Then a continuation move towards ATH zone
🎯 Setup Trigger:
What I’m watching:
✅ Sweep of 4H liquidity
✅ Bullish BOS on 15M–30M
→ This will serve as the confirmation for long entries
📋 Trade Management:
• Stoploss: Below the confirmation swing low
• Target: 4100$
💬 If you found this helpful, don’t forget to like, comment, and follow — I share setups like this every week!

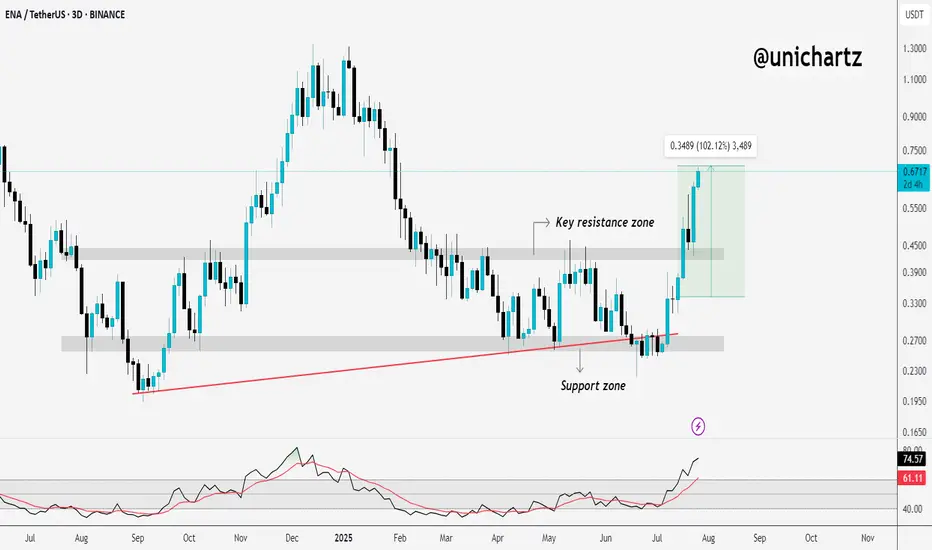
ENA Explodes After Breakout – What’s Next?
ENA Exploded 100%+ After Our Post 🚀
Just days ago, we highlighted ENA as one to watch — and it delivered.
Since then, price has nearly doubled, breaking past key resistance with strong volume and momentum.
This is why timing + conviction matters. When the setup is clean, the move speaks for itself.
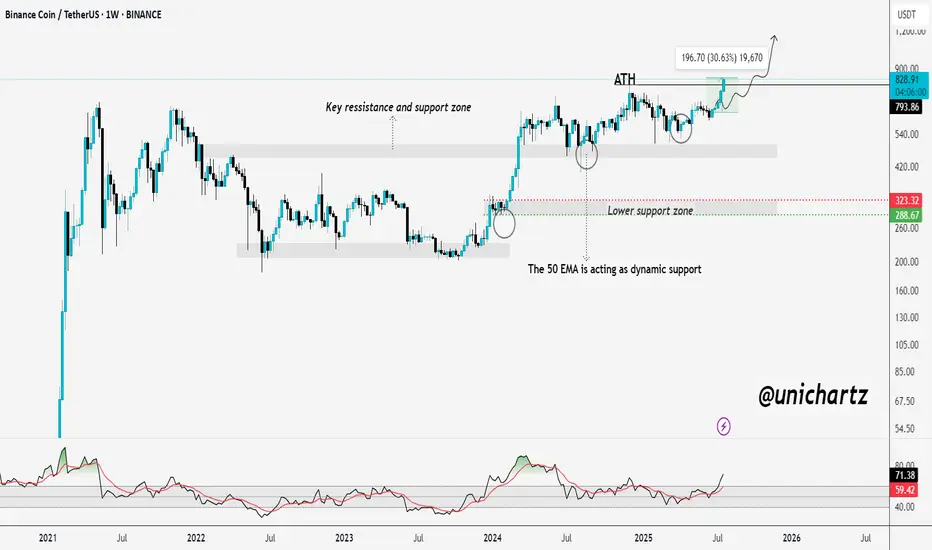
BNB Breaks ATH – Just Like I PredictedBNB ATH Breakout – Just As Predicted 🚀
A few days ago, I said it loud and clear:
"Mark my words — BNB will not only retest its ATH but break it and go beyond before the year ends."
Well... today, it happened.
BNB just smashed through its previous ATH and printed a new all-time high, exactly as charted.
Strong structure ✅
EMA support held ✅
Momentum built up ✅
Bulls showed up ✅
This is what conviction backed by TA looks like.
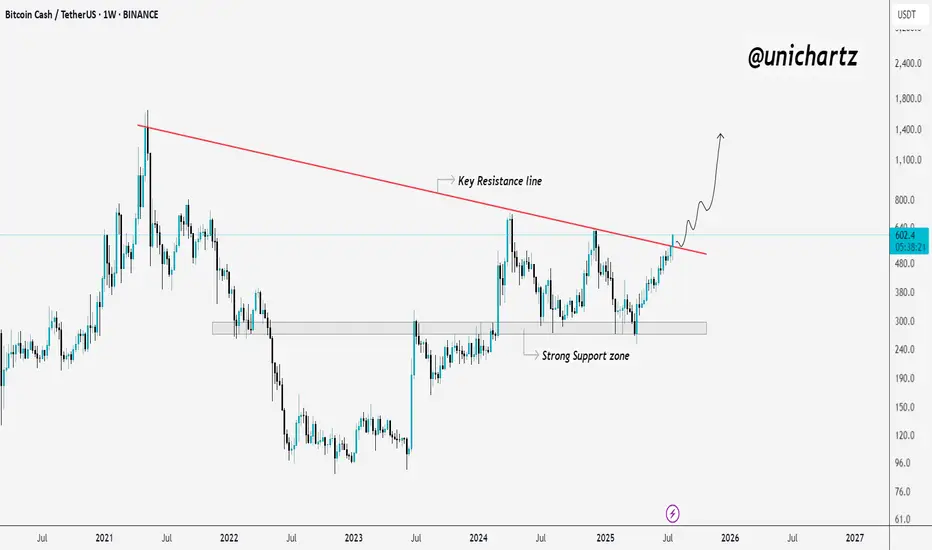
Bitcoin Cash Reclaims Momentum – Explosive Move Ahead?CRYPTOCAP:BCH Weekly Breakout 🚨
Bitcoin Cash just broke above a key multi-year resistance line, and that’s a big deal.
After months of consolidation above strong support, this breakout could trigger a powerful upside move.
If momentum holds, BCH might be gearing up for a run toward $800 and beyond.
Looks like the real move is just getting started.
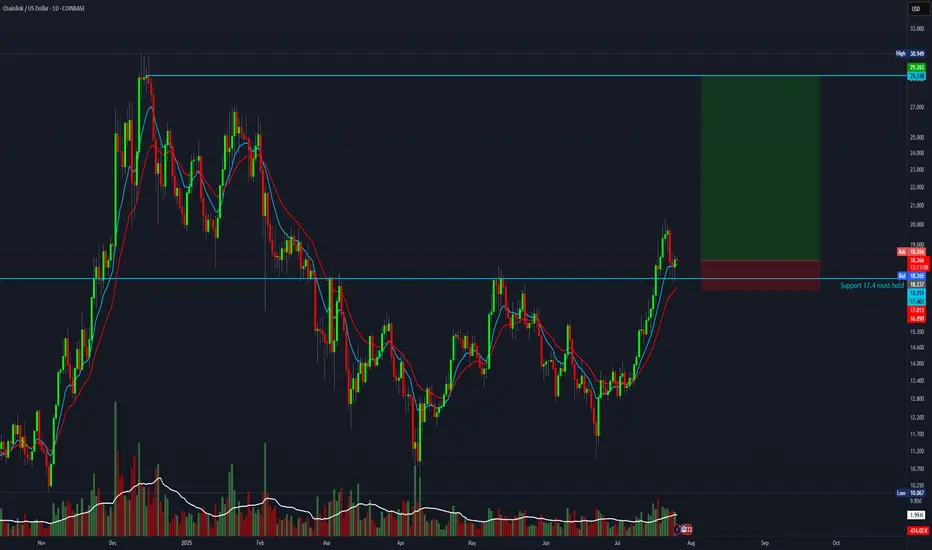
8 R setup for ChainlinkBTC is about to flip upwards. This is the chance to take a high-reward trade with an 8:1 risk-to-reward ratio.
Entry: 18.23
Stop-loss: 16.8
Target: 29
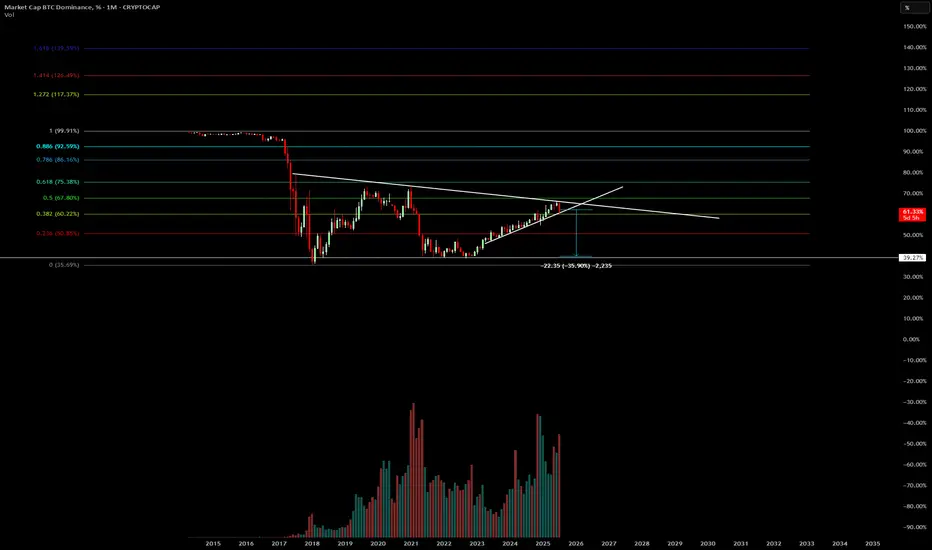
Bitcoin Dominance Topping Out? Bitcoin dominance ( CRYPTOCAP:BTC.D ) may be hitting a cycle top, signaling a potential major shift in capital rotation across the crypto markets.
Historically, when Bitcoin dominance peaks, we tend to see:
🔄 A rotation of capital into altcoins
🚀 Explosive rallies in ETH, SOL, and mid-cap alts
💰 Increased retail speculation and trading volume across DeFi and meme coins
Previous cycle tops in BTC dominance (e.g., 2017, 2021) preceded major altcoin seasons, with dominance falling sharply while total crypto market cap continued to grow.
⚠️ A rejection at key resistance (like the 200-week MA or golden fib levels) could confirm a reversal, hinting that altseason is around the corner.
💡 Keep an eye on:
ETH/BTC breakout potential
Total3 (crypto excluding BTC & ETH) trends
Risk-on sentiment and social metrics
Will history repeat? Or is this cycle different?
📈 Chart shows confluence of horizontal resistance, weakening RSI, and declining momentum on BTC.D.
Not financial advice. Always DYOR. Use proper risk management.
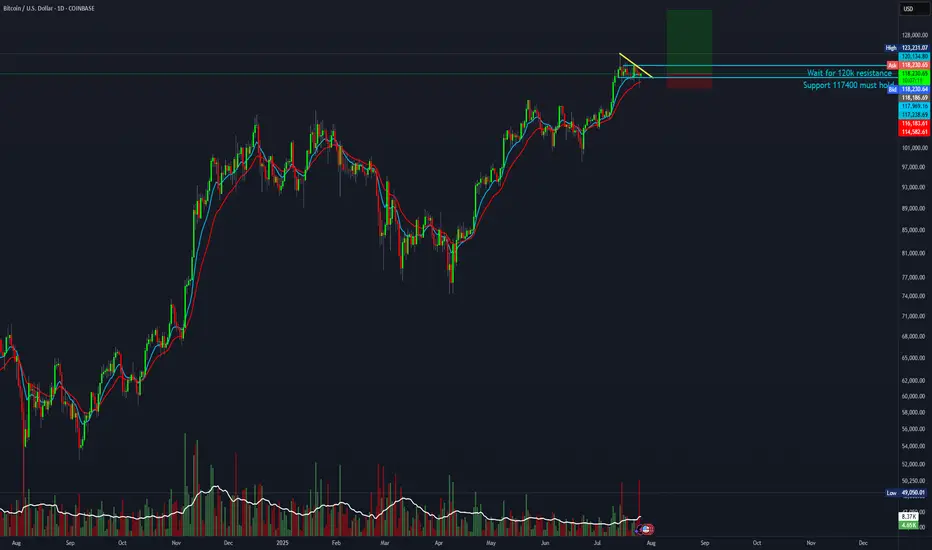
4:1 R:R for BTCBulls are likely to send it higher before the 120K breakout. This early setup is worth a try.
Entry: 118,200
Stop-loss: 115,000
Target: 135,000
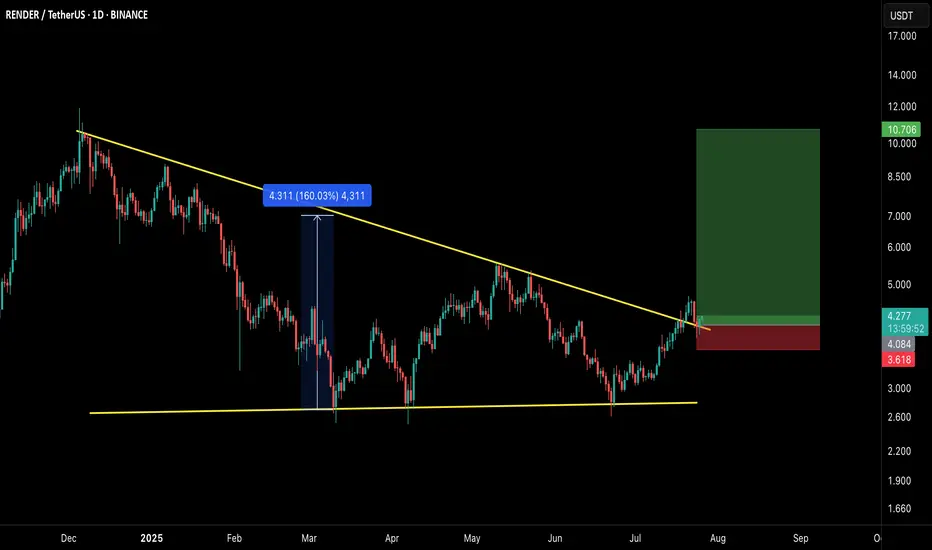
$RNDR/USDT – Breakout Setup Alert!RNDR has officially broken out of the long-standing descending trendline, confirming a bullish reversal structure. This breakout comes after a sustained consolidation phase and successful retest, indicating strength in buyer momentum.
🔍 Technical Breakdown:
Descending triangle breakout confirmed
Previous breakout from similar structure yielded a massive 160% rally
Currently retesting the breakout zone, providing a high R:R long entry opportunity
Clear invalidation point below the recent local support
🟢 LONG Setup:
Entry Zone: $4.00–$4.30
Stop Loss: $3.60 (below breakout retest & structure)
Targets:
TP1: $6.00
TP2: $8.00
TP3: $10.70+ (full breakout projection zone)
🧠 Strategy Insight:
This setup aligns with a broader bullish market structure across multiple altcoins. If momentum continues, this could mirror the prior explosive leg. Always manage risk accordingly.
⚠️ This is not financial advice. DYOR and use proper risk management.
💬 Let me know your thoughts or if you’re riding this wave!
BTC setup looks good for 5R.Looks like BTC is about to make another leg up toward 135K. Playing a 5:1 R:R on this setup
Entry: 119,000
Stop Loss: 116,000
Target: 135,000

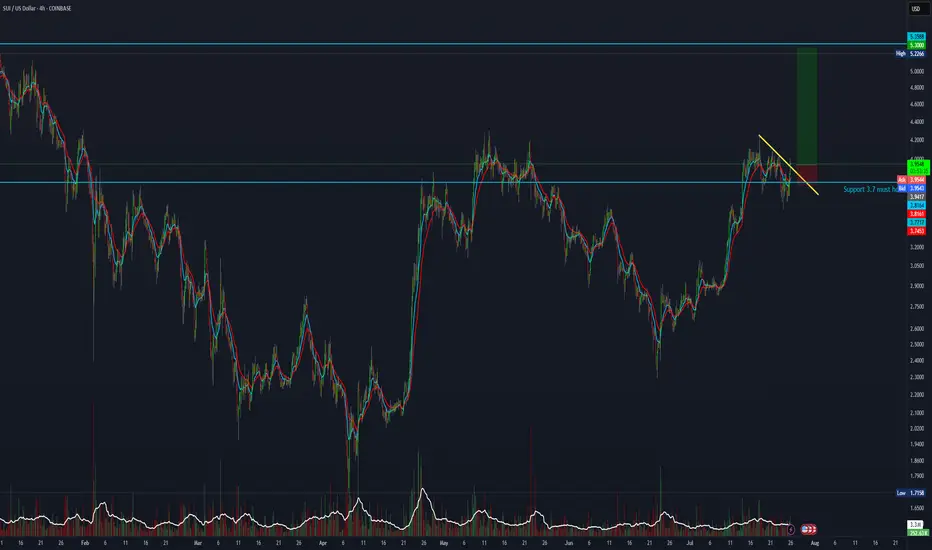
6:1 R:R trade setup for SUIAnother attempt at a 6:1 R:R setup with a target at the all-time high of 5.3.
Entry: 3.9417
Stop Loss: 3.745
Target: 5.3
2025 BTC.D to %44 then retrace to %56 - 2026 real Altseasonthe drop in bitcoin dominance from now till end on August to %44 will send some Alts 5 to 10 X then all the market will dump till the end of the year and the dump will be brutal
Brutal means : bitcoin down %65 and altcoins %90 from the upcoming August mini Altseason run. which actually Alts prices will be cheaper than now ( today )
eventually BTC.D going down to %20
Not a financial advice

Ethereum Charts Aligning for a Major BreakoutI analyzed Ethereum on both the monthly and 2-week timeframes, and the structure looks strong.
On the right side, we have the monthly chart, where ETH has printed a bullish Morning Star pattern right off the key support trendline.
This is a classic reversal signal, and price is now approaching the upper resistance zone. A breakout from here could trigger a major rally, similar to what we saw in 2020.
On the left side, the 2-week chart shows CRYPTOCAP:ETH pressing into a critical resistance zone after a strong bounce. If price breaks and holds above this zone, it could open the doors to $6K–$8K targets in the coming months.
ETH is showing strength, now we wait for confirmation from the breakout.
Thanks for reading!

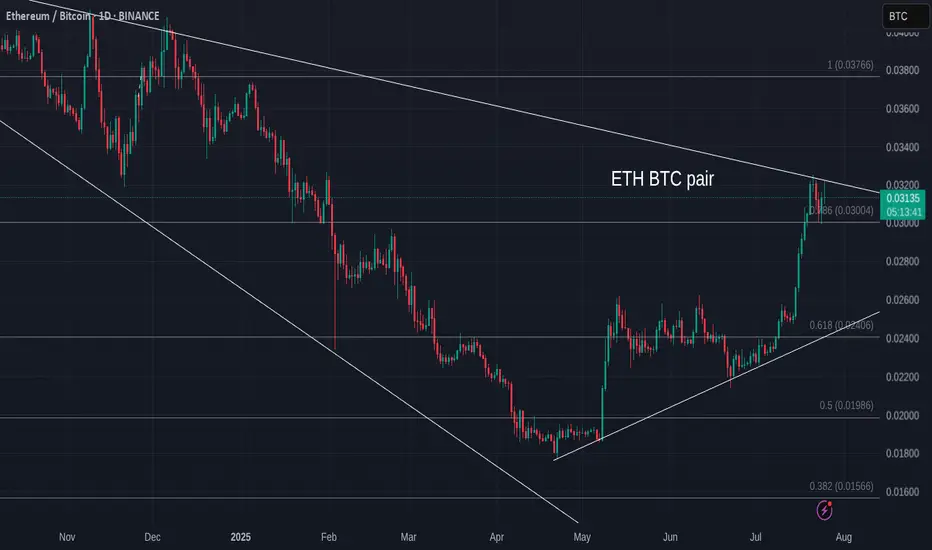
ETH Versus BTC - Daily Update - Bitcoin still winning
As mentioned yesterday, ETH has hit long term resistance and got rejected....and it is happening again
ETH seems unable to find the moemntum just yet.
The MACD Daily is still turning Bearish
The Daily RSI is also up high and likely to fall
The weekly RSI is also high though the Weekly MACD has still yet to rise above Neutral
All in All, for me, it is NOT the time....Though we can see that ALTS are running Hot though not a full ALT season as we have seen in the past.
It is fragile...please remain CAUTIOUS
Bitcoin Dominance – Critical Breakdown on the Horizon
Bitcoin dominance is currently testing a major long-term resistance zone formed by the upper boundary of a multi-year wedge. After months of steady climb, the structure is now showing the first signs of exhaustion
If dominance loses the key 60% support zone, that would mark a major structural shift — historically followed by downtrends in dominance and strong capital rotation into altcoins.
Until dominance reclaims the upper trendline or regains bullish momentum, the risk-reward now favors altcoins. Momentum is shifting. Altseason might just be around the corner.

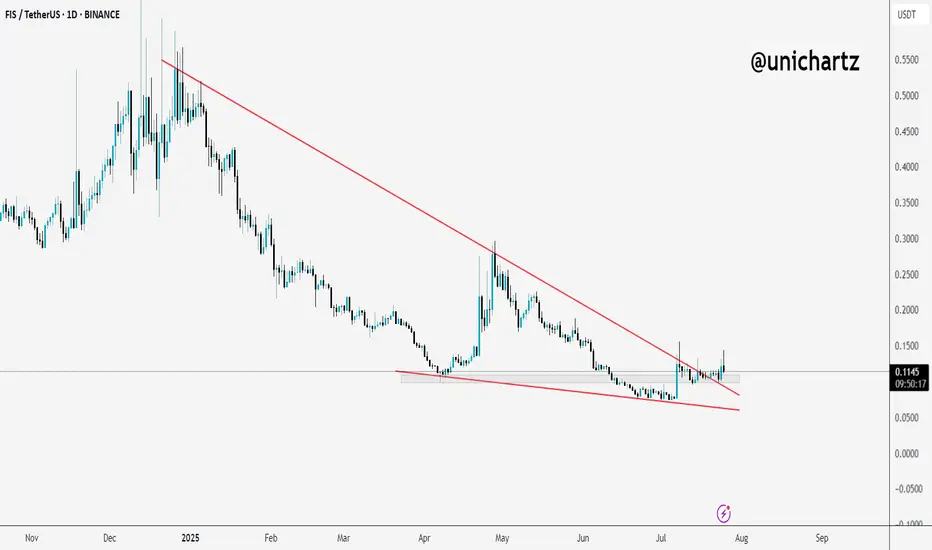
FIS Breaks Out of Falling Wedge – Reversal in Play?$FIS/USDT has finally broken out of a long-term falling wedge pattern, a structure that often signals reversal.
Price is now holding above the breakout zone, showing signs of strength.
As long as it stays above the wedge, we might see further upside in the coming days.
DYOR, NFA
Ethereum will retest the $3,500 level ┆ HolderStatOKX:ETHUSDT is trending upward with $3,100 as the next resistance. Breakout aims for $3,250. $2,875 remains critical support. Bullish momentum intact.
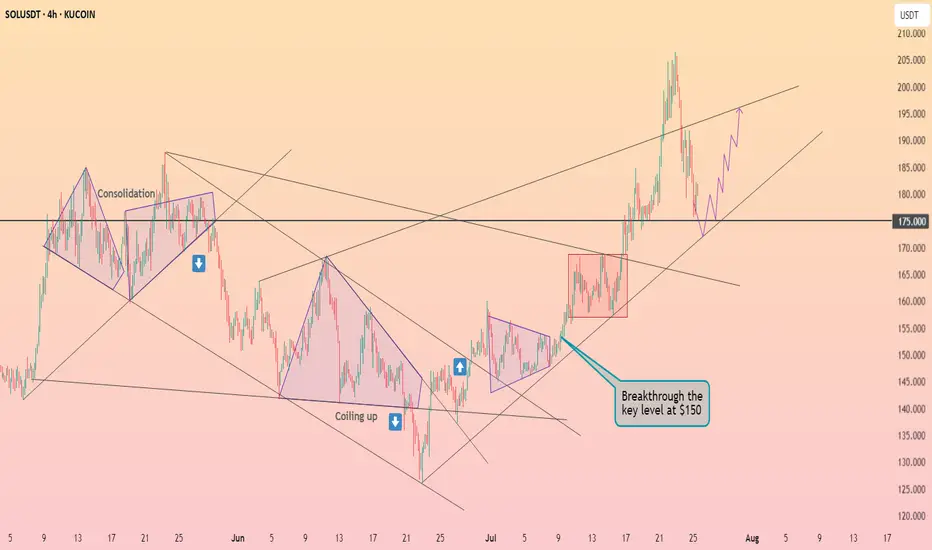
Solana is bouncing back from $175 ┆ HolderStatOKX:SOLUSDT is testing the $180 barrier. Breakout could extend gains to $186. If rejected, $172–$173 may act as reentry zone. Market structure favors continuation.