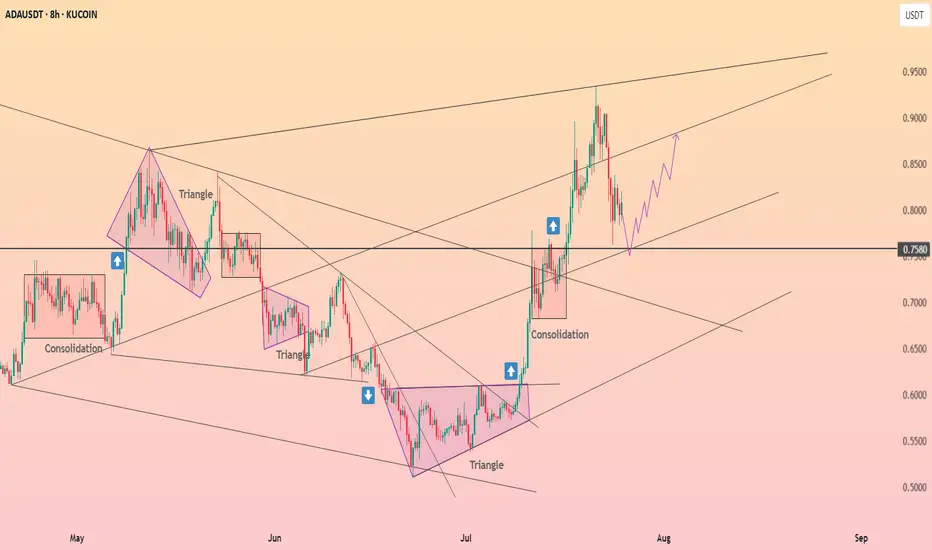
Cardano held above $0.76 ┆ HolderStatBINANCE:ADAUSDT is compressing under $0.44 with support from $0.418. Breakout from wedge structure may target $0.462. If $0.418 breaks, downside risk opens to $0.40. Watch for volatility.
Altseason
TOTAL CRYPTO MARKET CAP expected to hit $6 Trillion!The Crypto Total Market Cap (TOTAL) has been on a Channel Up since the 2022 market bottom and since the April 07 2025 Low (Higher Low for the pattern), it's initiated the new Bullish Leg, already turning the 1W MA50 (blue trend-line) into Support.
As long as this holds, we expect it to complete a +270% rise from the August 05 2024 Low, similar to the Bull Cycle's first Green Phase, and reach at least a $6 Trillion Market Cap!
More importantly, we expect this final part (blue ellipse) to be what is commonly known as an Altseason, where the lower cap coins show much higher returns and disproportionate gains to e.g. Bitcoin.
-------------------------------------------------------------------------------
** Please LIKE 👍, FOLLOW ✅, SHARE 🙌 and COMMENT ✍ if you enjoy this idea! Also share your ideas and charts in the comments section below! This is best way to keep it relevant, support us, keep the content here free and allow the idea to reach as many people as possible. **
-------------------------------------------------------------------------------
💸💸💸💸💸💸
👇 👇 👇 👇 👇 👇

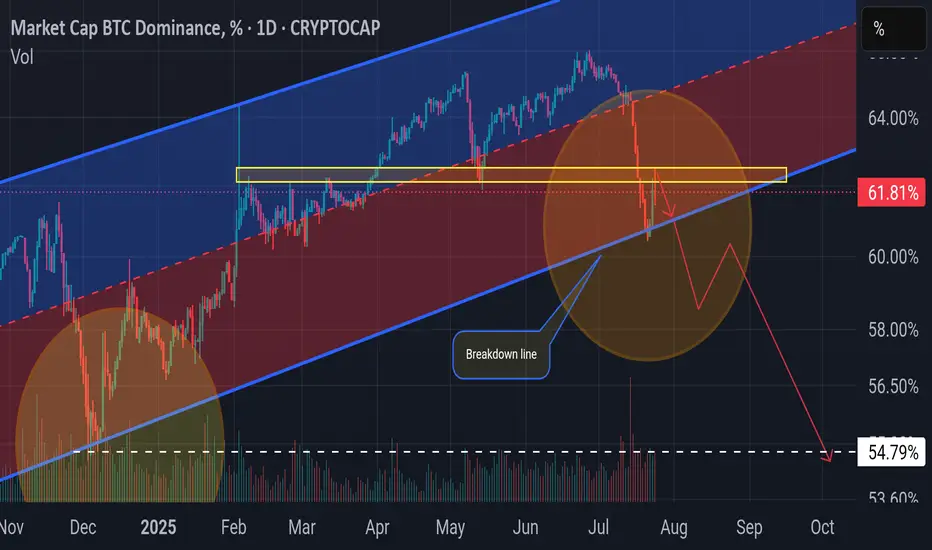
BTC.D The party begins 🚀 Altseason has kicked off. BTC.D's candle body already broke below the breakdown line briefly and is now bouncing slightly off the trendline — just a retest before another leg down. Once it breaks again, that’s when the real party starts 📈🎉.
DOGECOIN : Should we expect an increase?Hello friends🙌
📈Given the decline we had, you can see that buyers entered at the specified support and formed a double bottom reversal pattern, which is a strong signal on support.
📉Considering the possible market correction, we placed two more buy levels lower so that we can buy there if the price corrects.
⚠Don't forget about capital and risk management, friends.
🔥Follow us for more signals🔥
*Trade safely with us*

APT : Long term purchaseHello friends🙌
👀You see that the price is in a range and now we are at the bottom of the range. The scenario is simple. The bottom of the range is a good buying opportunity that can be used because 80% of the failures in the range are fake.
⚠So we can buy with risk and capital management and move with it to the specified targets.
🔥Follow us for more signals🔥
*Trade safely with us*

XRP : Long term analysisHello friends🙌
🔊Considering the great growth that the price has had and has set a new ceiling, be careful because we are at the ceiling and when we are at the price ceiling, we should always expect a price correction...
⚠Now, given the strong upward trend we have, you can buy with risk and capital management, but our suggestion is lower prices for the possibility of a correction and the possibility of a reversal pattern.
So we have identified important support levels for you and we have also identified price targets.
🔥Follow us for more signals🔥
*Trade safely with us*

BNB WEEKLYHello friends🙌
🔊We are here with BNB analysis:
A long-term analysis that can be viewed as an investment, but in the long term, with patience and capital management...
You can see that after weeks of price suffering, a good upward move has now been formed by buyers, which has also caused a new ceiling to be set. Considering the market decline and the decline of most currencies, you can see that BNB is well supported and its price has suffered.
⚠Now, with the arrival of buyers, you can enter a long-term buy trade with capital management.
🔥Follow us for more signals🔥
*Trade safely with us*

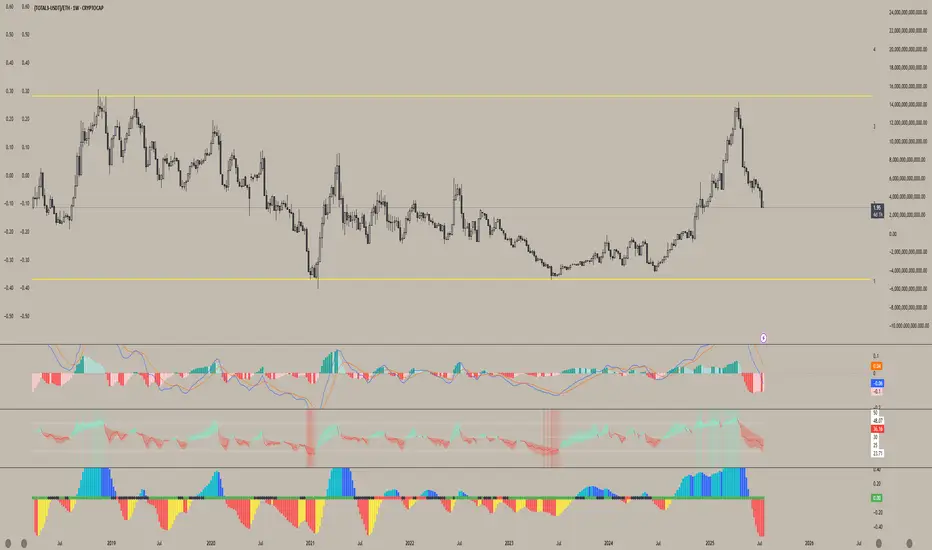
Lets look at ETH V Bitcoin for a moment, before you jump in
Ever since Nov 2021, ETH has Lost Value compared to Bitcoin, as we can see on this ETH BTC chart.
Even while Bitcoin entered a Deep Bear market, ETH lost More....
And now, as we see ETH make a strong move, we have people screaming, "ETH to 10K"
And given how ETH is backed by almost everything American, as America wants ETH as its own Crypto.
Nut lets look here at simple idea.
ETH is up agains Stiff long Term resistance right now.
If we look at the daily chart.
We can already see how PA has been bumped down...an is trying again, even with a daily MACD turning Bearish
The weekly MACD has room to go higher and so I do expect PA to break over resistance and to nreak higher should sentiment remain strong.
As ever, this relies HEAVILY on BTC Dominance and Bitcoin PA to play along.
For me, I am not touching it, even if I can make money on it..
Principles

Ethereum will retest $3,500 ┆ HolderStatOKX:ETHUSDT bounced from $2,875 and is approaching $3,100. Breakout may target $3,250 next. Bullish structure remains.

XRP is heading toward $4 ┆ HolderStatBYBIT:XRPUSDT is testing $3.40 for the third time. A breakout targets $3.60, but rejection risks $3.10 fallback.

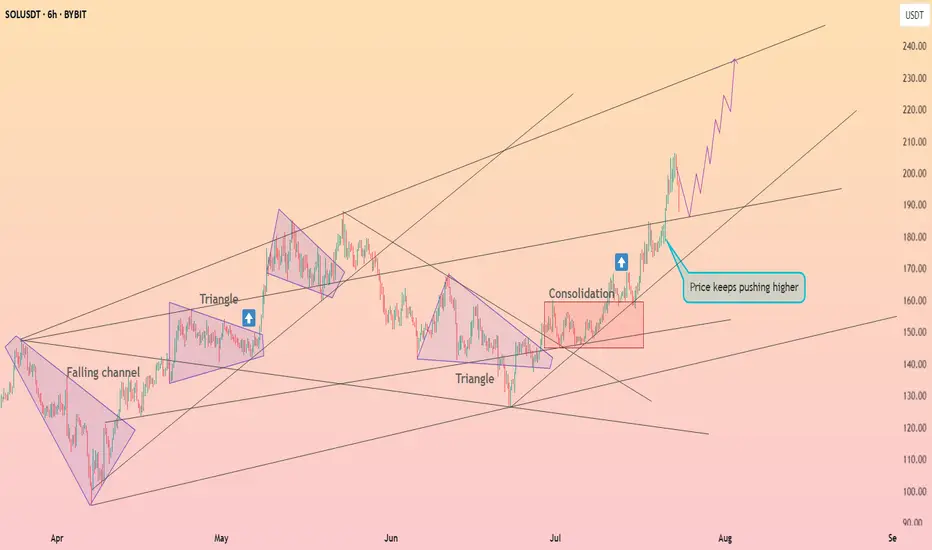
Solana is preparing to breakthrough $200 ┆ HolderStatOKX:SOLUSDT is trapped between $172 and $180. Break above $180 may unlock $188+. Watch for volume breakout.
PENGU. Main trend. Trend reversal zone. 04 07 2025Logarithm. Main trend. Fresh cryptocurrency, which is being driven into hype.
Locally now. Price at the median of the bowl.
Buyer volume dominates. Most likely, there will be a large pump in case of a breakout.
The chart is somewhat reminiscent of the Bitcoin chart, the reversal zones of this secondary trend, after the first local wave of growth. The first local, significant target is shown.
There is a possibility of a helicopter, that is, to collect stops in both directions, and thereby dump passengers before a potential pump.
Such cryptocurrencies (low liquidity, monopoly over the price due to the concentration of cryptocurrency in “one hand”) at a good time "the hamster is not scared", will be pumped up conditionally, like Shiba Inu (SHIB), driving the hype (raising the price over and over again, and coming up with positive news) and 0.5 million Twitter subscribers (X). Medium-term — long-term level zones are shown on the chart.

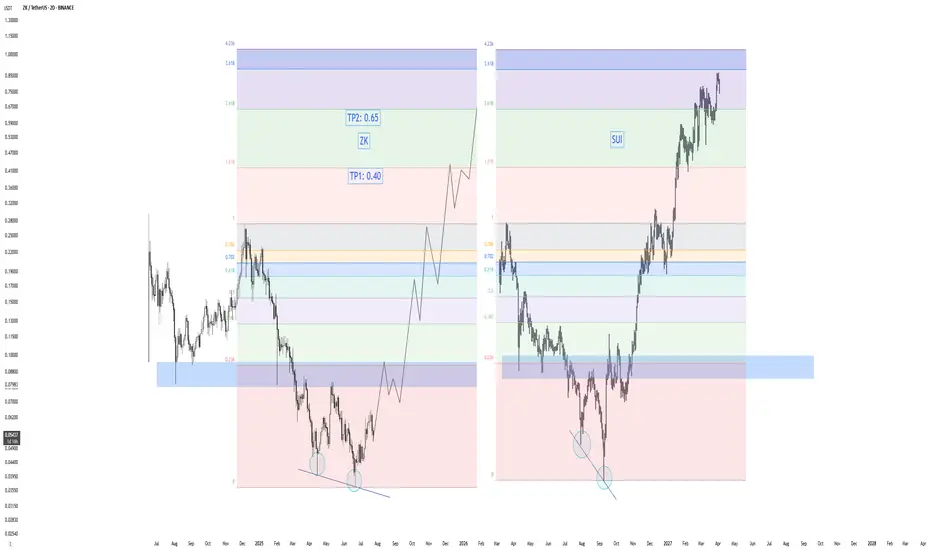
ZK - Golden opportunity? 0.40? Hello everyone, here’s my new analysis on ZK.
Recently, the price surged nearly 80%, followed by an 18% pullback over the last two days. From its all-time high, ZK is currently down about 80%, which in my opinion presents a golden opportunity.
Based on my research, the peaks of altseasons often occur between December–January or April–May. After analyzing the Others Market Cap dominance chart, I believe we’re setting up for a strong altseason in the next 5 months. Over the last few years, BTC has significantly outperformed altcoins—but recently, I’ve noticed a major shift in market dynamics, indicating that capital might be rotating back into alts.
On the chart, ZK is showing a classic crypto crash-recovery pattern. For example, SUI dropped around 80–85% before rallying over 1000% in just 4 months. I see a strong structural similarity between the bottoming pattern of SUI and the current structure of ZK.
If ZK breaks the resistance zone at 0.080–0.095, I expect a rapid move up toward 0.22–0.26. After that, a healthy correction around the previous ATH would be expected—before potentially heading to 0.40 as Take Profit 1 (TP1).
$HBAR Wave 4 finishing soon?CRYPTOCAP:HBAR Hedera appears to have completed wave 4 with the test of the High Volume Node support at the 0.382 Fibonacci retracement.
Wave 5 has an expected target of the High Volume Node resistance at $0.4 before a larger retracement in wave 2 aligning with my summer pump august / September dump view.
Analysis is invalidated below $0.1933 at the 0.5 Fib retracement and will be updated to a wave 2 instead of 4.
Safe trading

$FET local ending Diagonal and wave 2 near completion?NYSE:FET was rejected for the 4th time at the daily 200EMA! Each time the probability of a breakout increases.
I have adjusted the High Volume Nodes for accuracy.
Locally Fetch appears to have completed a motif wave up with an ending diagonal for wave 5. Wave 2 is expected to find support at the daily pivot and .618 Fibonacci retracement before attempting a breakout of the daily 200EMA once more.
A move below wave II will invalidate this analysis.
Safe trading
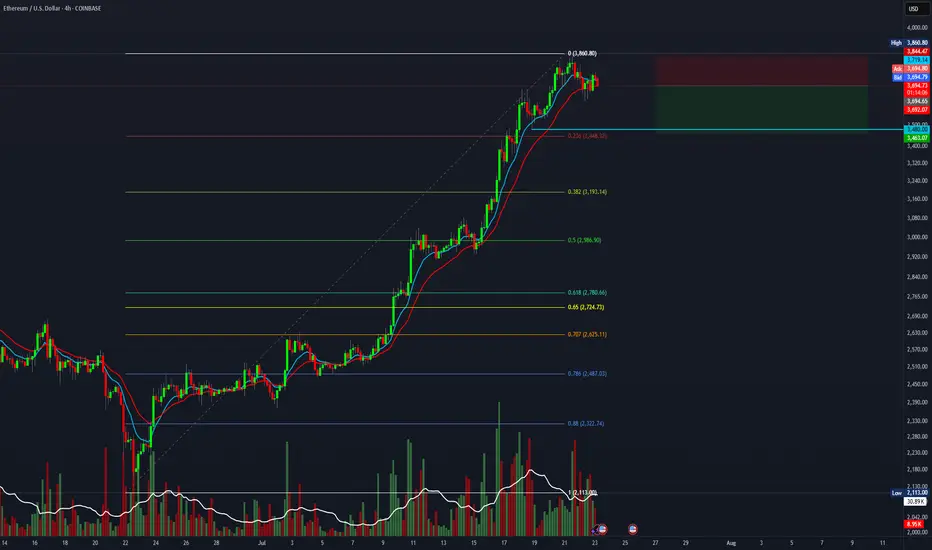
$ETH Hit Our Targets and was rejectedCRYPTOCAP:ETH hit our signal take profit target at $3820 and was rejected at the High Volume Node EQ to the penny.
That appears to have completed wave 3 of this motif wave. Wave 4 has an expected target of the R2 daily pivot and 0.236-0.382 Fibonacci retracement, $3260 before continuing to the upside in wave 5 with a target of the all time high.
This aligns with my views of a significant pullback at the end of August and September which is typical after a summer rally.
No divergences yet in daily RSI.
Safe trading

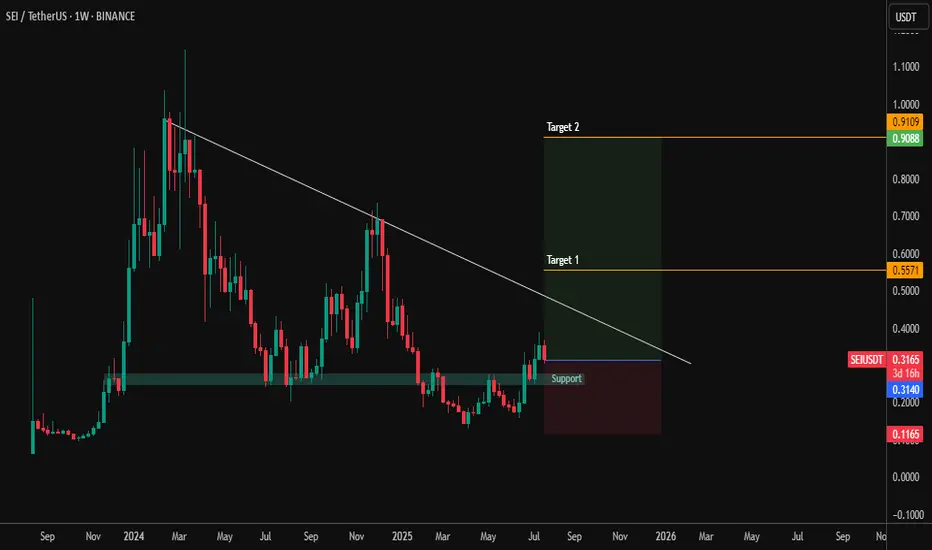
#SEIUSDT – Testing Resistance with Eyes on Breakout SEI is currently approaching a major descending trendline resistance after reclaiming the key weekly support zone around $0.20–$0.31. Price action is showing strength with a potential reversal setup building.
🔹 Key Technical Levels:
🔽 Support: $0.20–$0.31 (reclaimed zone)
📉 Resistance: Descending trendline from previous highs
🎯 Target 1: $0.5571
🎯 Target 2: $0.9109
🛑 Invalidation: Break below $0.1165 (risk zone)
📌 Technical Outlook:
Bullish structure forming above a long-held support
A breakout from the trendline could initiate a strong leg upward
Risk-to-reward remains favorable for mid-term swing setups
Watch for volume confirmation if SEI closes above the trendline. Momentum may accelerate toward the targets with bullish follow-through.
$AAVE Daily Hidden Bullish divergence?CRYPTOCAP:AAVE and alts begin their retracement Wednesday but is this a long term top or just local? Im betting we have a higher to go this summer..
Hidden daily bullish divergence is printing on RSI at the daily pivot and 0.5 Fibonacci retracement which should all act as strong support provided BTC doesn't dump.
The 'alt-coin golden pocket' Fibonacci retracement 0.786 sits at the descending daily 200EMA and High Volume Node support offering a secondary target for reversal and continued upside.
Losing this and closing below would flip me bearish until a new bullish signal emerges.
Safe trading.

Altcoins are getting absolutely decimated relative to ETHWhile Ethereum has been on a massive run from its lows this year — pulling altcoins up with it — most alts are still lagging far behind.
This chart clearly shows how poorly altcoins are performing against ETH, reinforcing why, at least for now, ETH remains the better hold.
It also fits the classic money flow rotation: BTC → ETH → Large Caps → Small Caps — and right now, we're still in the ETH phase. Until we see strength return in these ETH pairs, chasing altcoins may just lead to more underperformance.
Altcoin Season Has Started. And A Quick Look At The Stock MarketHey Traders,
Time for me to catch you up on the latest price action in both the stock market and crypto as well as touch upon a few changes on my platform and subscription services and what I plan for the future.
Timestamps:
00:00 | Housekeeping - site changes, etc
04:35 | BTC Dominance
06:45 | DXY Dollar Chart
10:00 | SPY
14:25 | BTC Bitcoin Chart
15:45 | Bitcoin Liquidity Heatmap
17:30 | Solana
19:05 | Ethereum
20:20 | Crypto & Stock Trackers
24:25 | My Indicator
26:10 | Where I Went Wrong & How I Plan To Course Correct
✌️ Stew

HYPE Swing Long Opportunity - Altcoin Season📌 Fundamental Sentiment:
The crypto market — alongside broader risk assets — continues to gain traction. This momentum is largely fueled by rising expectations of policy shifts in the U.S., with Trump intensifying pressure on Jerome Powell and advocating for aggressive rate cuts from the Fed.
📌 Technical Analysis:
HYPE is approaching a key HTF bullish trendline, and confluences are stacking up in the same region:
✅ HTF Demand Zone
✅ Equilibrium (EQ) of the HTF bullish trend
✅ Bullish Trendline Support
These three HTF confluences overlapping at the same price zone indicate a high-probability setup for a significant bounce and a possible swing long opportunity.
📌 Gameplan:
Price hits HTF bullish trendline
HTF demand zone gets tested
EQ level tapped → discount offered to buyers
📌 LTF Confirmation Criteria:
I’ll wait for:
A 1H swing break
A strong 4H rejection candle
These will confirm momentum shift. If confirmed, I’ll enter a swing long.
🎯 Target: $60
💰 Potential gain: ~+50%
❗ Stop-loss: Below the swing low that triggers the LTF confirmation
—
🔔 Follow for daily setups and weekly macro recaps
💬 Drop your chart or questions below!

Short swing setup on ETH, targeting 1.5R.It's time for a healthy pullback on ETH. This short setup offers a 1.5:1 risk-to-reward ratio with a target of $3,500.
Entry at $3,725
Stop loss at $3,850
Target at $3,500.
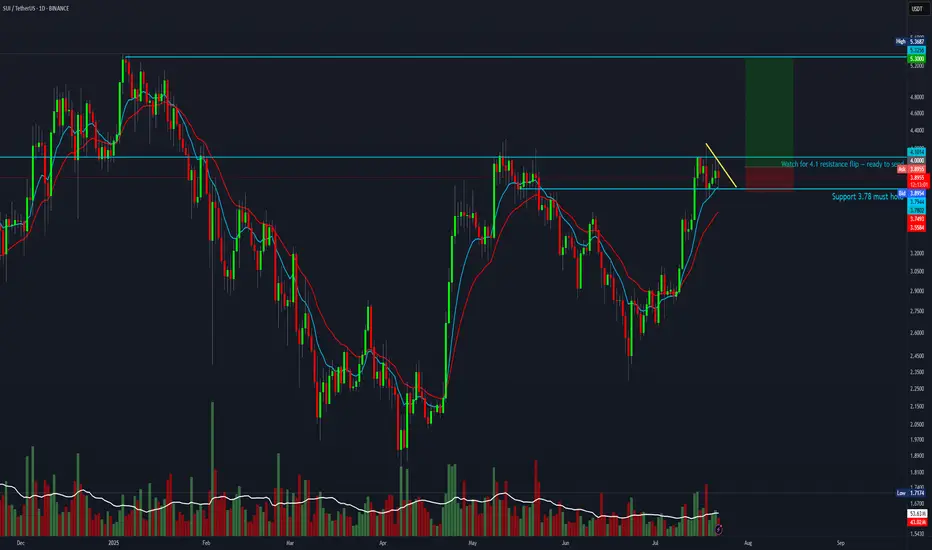
SUI 5R setup forming.SUI looks ready to move. Wait for a breakout above $4 — once it flips the $4.10 resistance, it could fully send toward ATH.
Entry: $4
Stop Loss: $3.70
Target: $5.30