Bitcoin Dominance - No Altseason yetAs long as Bitcoin Dominance is moving in the channel, there will be no AltSeason unless it shows weakness and breaks the channel downwards.
Altseason

ETH - Altseason ??ETH has rallied sharply and is now entering the major resistance zone between $3,725 and $4,081, which has repeatedly acted as a local top during previous cycles.
This red zone represents a high-supply area, and historically ETH has struggled to break and hold above it without a significant catalyst.
Rejection here could lead to a pullback toward the $2,300–$2,000 range.
A clean breakout and weekly close above $4,081 would flip this resistance into support and open the path toward the all-time high (ATH) at $4,868.
If ETH reclaims this red zone and flips it to support, it will act as a major trigger for a broad Altseason.
Historically, such ETH strength is a key confirmation that capital is rotating from BTC into the altcoin market.
Currently, momentum is favoring bulls unless this red supply zone causes a strong rejection.

4/ Altseason: Live -The Final game is in September. My plan Altszn Live #4: My <50% Win Rate, the Psychology of Missed Profits, and the Endgame in September. Start with 10k
Let's be brutally honest. Running a public trading experiment comes with immense psychological pressure. This isn't a game. It's real money, real nerves, and a real reputation on the line. The last 9 days have been tough; I hit a losing streak, and I want to show it to you, not hide it. Because trading isn't a non-stop party of green numbers. It's a marathon where your own psychology is both your greatest enemy and your greatest ally.
Section 1: Working on Myself. My System vs. Crowd Psychology
To be profitable in the long run, you have to be honest about your strengths and weaknesses. My weakness? My trade win rate is less than 50%. Yes, more than half of my positions do not close in profit.
My strength? I've developed one rule that allows me to stay profitable despite this win rate. This isn't some pretty quote; it's a hard-won system: "Hold your profitable positions for as long as possible, and close your losing positions as quickly as possible."
Now, look at the market. Most people do the exact opposite. They "marry" their losing positions for years, while a 20-30% profit is an irresistible temptation they must lock in immediately.
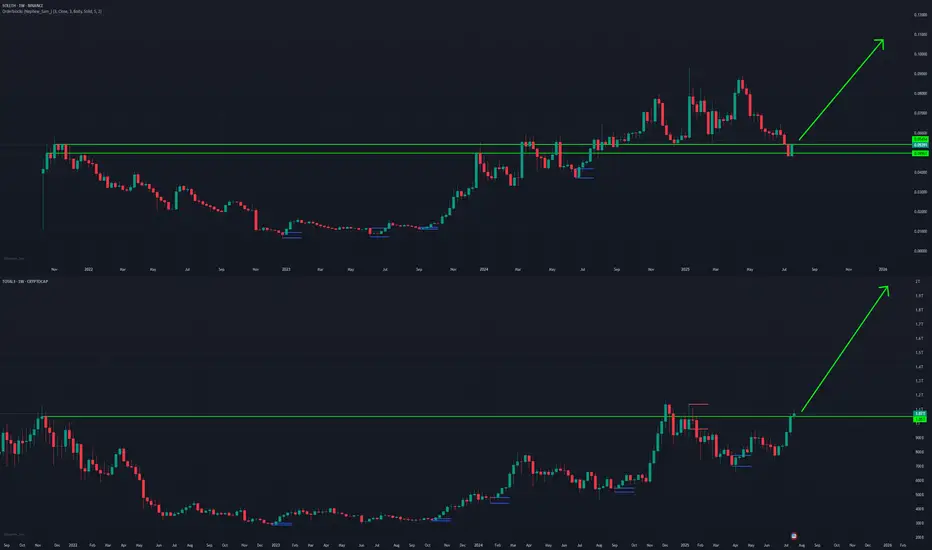
This leads to the pain of missed opportunities (FOMO). I went through this myself with $RSR. I was waiting to buy at 0.081. The price touched 0.083 and then flew to 10 cents without me. That feeling of the market leaving without you while you wait for the perfect correction is familiar to everyone. It's that burnout that causes you to make mistakes. But I've learned my lesson: there will be no deep corrections this season.
Section 2: Altseason in Full Swing. Where is the Money Flowing, and Where is the "Final Station"?
Altseason is already here. This isn't a guess; it's a fact. Billions of dollars in USDT and other stablecoins are pouring into the market right now. Bitcoin is at its highs. Ethereum is moving up aggressively, just as I've said in my previous posts. But the biggest potential isn't in them right now.
Money moves in waves in the market. You need to understand this to avoid getting on at the "final station":
1. First, Tier-1: Capital flows into BTC and ETH. (This phase is almost over).
2. Then, Tier-2: The flow shifts to large-cap projects (LINK, UNI, SOL, etc.). (Happening now).
3. Next, Tier-3 & Tier-4: Money moves into smaller, riskier altcoins. (Our main target).
4. The Finale - Memecoins: Euphoria, insane percentages, media headlines. When your grandmother asks you about Dogecoin — that's the "final station." It's time to get off the ship.
And we have a date. September 2025. For me, this is the deadline, after which I'm moving into stablecoins and waiting for major shifts in the global economy.
Section 3: My Hunt for "Green Flags" and the XETR:HEI Trade
How do you find that Tier-3 project in this chaos that could deliver massive returns? I look for "green flags." The main one is a rebranding. New tokenomics, a new chart, a new concept. It's a startup with a history.
It was precisely this principle that led me to XETR:HEI (formerly AMEX:LIT ). A small capitalization, a strong narrative, and a complete reset of old holders. The probability of such a project taking off is extremely high.
I'm managing this trade, from entry to exit, in real-time within my private channel. These aren't just signals; it's a demonstration of the system in action.
Conclusion & Call to Action
This public experiment is my personal challenge. I have one shot and only two months to show a result. I'm sharing everything: the wins and the losses. All proof of my trades is available on streaming platforms.
In the first post about Altseason, I invited you to join this journey, and the response was incredible. It brought many strong and mindful people into our community. Let's continue.
If you want to follow my trades in real-time, and ride this final wave of the altseason with me, write "Altseason " in the comments or in pm
And I have a question for you. Share your thoughts, your pain points, your projects. What's on your radar? And one more thing: would you want me to open a separate public account with $1000 and trade it in parallel for transparency? Let's discuss. I'm open to any suggestions.
Best regards EXCAVO
Ethereum Breakout Could Spark the Next Altseason!A Massive Altseason Is Brewing… 🚀
Ethereum just flashed a major monthly breakout after printing a clean Morning Star reversal right at key support.
Now it's pushing against the upper resistance zone, a structure that held it back for over two years.
If CRYPTOCAP:ETH breaks and closes above this level, it won’t just be bullish for Ethereum — it could ignite the biggest altcoin season since 2021.
Why it matters:
📌 ETH is the heart of the altcoin ecosystem.
📌Historical breakouts like this led to 1500%+ moves.
📌The pattern and price action are lining up perfectly again.
Once Ethereum breaks cleanly above $4,000, expect altcoins to explode across the board — Layer 2s, DeFi, AI tokens, and even the meme coins could all start flying.
Keep your eyes on ETH. Its breakout is the spark… the altseason fire is coming.
DYOR | Not Financial Advice

Eclipse Wakes Up After Bleed – Bounce Incoming?ES/USDT just broke above the short-term downtrend line after a long bleed.
Volume is still low, but this could be the first sign of a shift.
As long as it holds above $0.2188, there’s a good chance of a relief bounce toward $0.33.
Early, risky, but worth watching closely.
DYOR

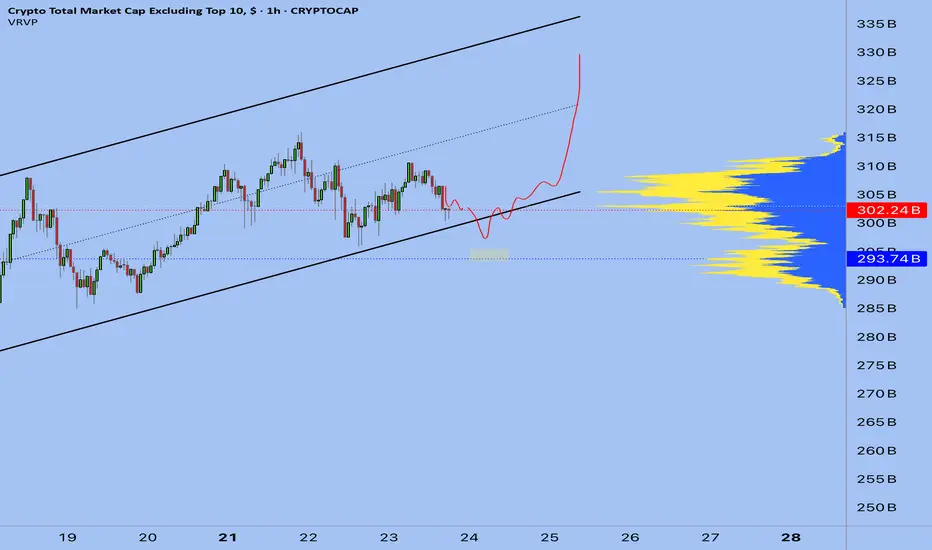
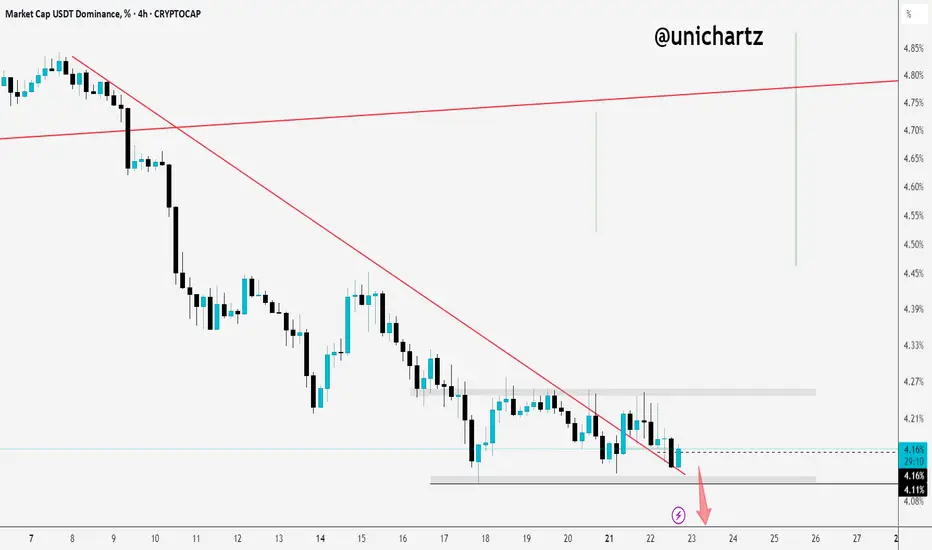
Tether Dominance Testing Support Zone – Big Move Coming?USDT.D is moving sideways right now.
If it breaks down below this range, it could fuel another leg up for altcoins.
Keep a close eye, the next move could shift the market.
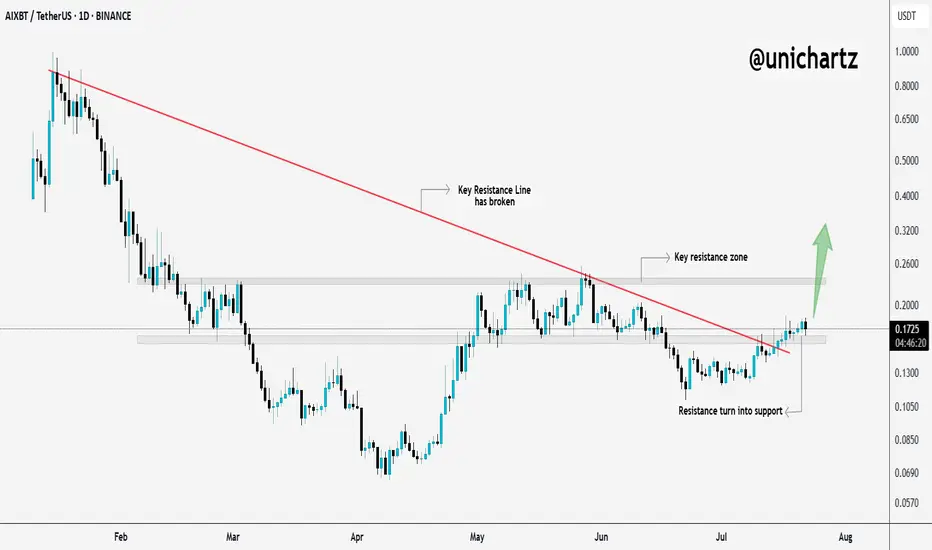
$AIXBT Breaks Trendline – Sharp Move Ahead?$AIXBT just broke out of its downtrend and flipped resistance into support, classic breakout behavior.
It’s now pushing toward a key resistance zone, and if it clears that level, we could see a sharp move up.
Momentum is shifting, this chart deserves your attention.
DYOR, NFA
NEAR Swing Long Idea - Altseason 2025📌 Fundamental Sentiment:
The entire crypto market is rallying, alongside other risk assets. This is mainly driven by U.S. policy expectations — Trump is pressuring Powell to resign and aggressively pushing for rate cuts from the Federal Reserve.
📌 Technical Analysis:
NEAR has recently broken and closed above a significant HTF support/resistance level.
Additionally, we’re now trading inside the 0.75 Fibonacci retracement level of the HTF bullish trend — which I define as the maximum discounted zone.
For this setup, I’ll apply my Deep Range Theory (DRT):
If price dips below the 0.75 zone and accumulates there,
Then breaks above 0.75 after a period of consolidation,
→ It signals that price aims for the 0.5 level of the range and will likely run HTF liquidity for either reversal or re-accumulation before continuation.
📌 Gameplan:
✅ Break and close above HTF S/R
⏳ Waiting for break and daily close above 0.75
🔄 Retest to LTF demand (4H–1H)
📈 A bounce on LTF demand will trigger the long setup
📌 Trade Management:
This is a mid-term swing trade, as I’m following the HTF bullish trend.
🎯 Target: $5 — which is approximately a +70% move from current price.
❗Risk Management:
If price makes a daily close back below 0.75 after breaking and closing above, I will exit the trade to preserve capital.
I’ll also monitor macro sentiment closely. If there's a sharp bearish shift, I may consider an early exit before reaching the HTF target.
—
🔔 Follow the channel for daily trade ideas & weekly macro recaps.
💬 Drop a comment below if you have any questions or insights!

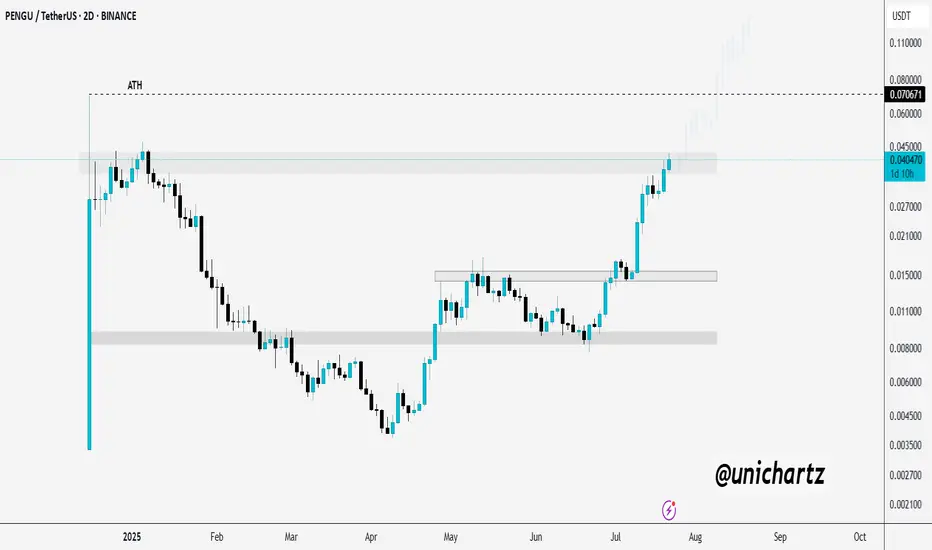
PENGU Approaching Key Breakout Zone – Eyes on ATHCSECY:PENGU is testing a major resistance zone — and it’s heating up! 🔥
If it manages to break and close above this level, we could see a strong rally toward the ATH and beyond.
Keep it on your radar, this move could get explosive.
DYOR, NFA
ankr short trade in my opinion this is a good trade with a good r/r hope hit the tp consider this is my trade not your trade and i just like to share my trades with world

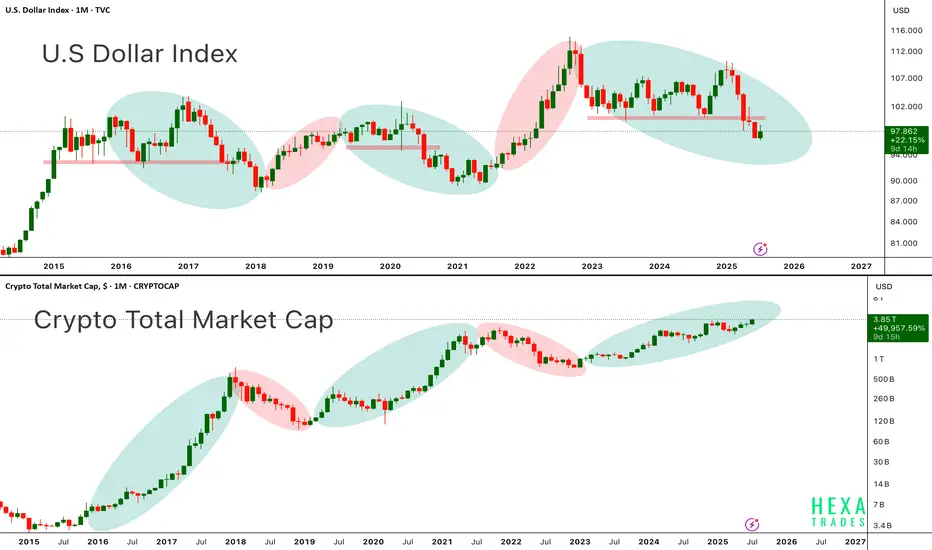
DXY vs. CryptoAbove chart highlights the long standing inverse correlation between the U.S. Dollar Index and the Crypto Total Market Cap a relationship that has guided the macro trend for Bitcoin and altcoins since 2015.
in the first chart, When the dollar weakens (green ovals), crypto tends to rally. When the dollar strengthens (red ovals), crypto markets usually experience corrections or prolonged bear markets.
In the second chart, each period of dollar weakness aligns almost perfectly with explosive crypto upside seen in 2017, 2020–2021, and now potentially again in late 2024 through 2025. Conversely, periods of DXY strength (2018, 2022) coincide with crypto market downturns.
Currently, DXY is entering a downward phase, while the crypto total market cap is pushing higher, now above $3.8 trillion suggesting that a new leg in the crypto bull cycle may be underway. Bitcoin and Ethereum have historically performed best when DXY trends lower, as liquidity shifts into risk-on assets.
Key Points:
-DXY and crypto market cap show a strong inverse macro relationship.
-DXY in a clear downtrend from 2024 highs supportive of further crypto upside.
-Crypto Total Market Cap approaching all-time highs suggesting broad market strength.
-Potential for BTC > $150K and ETH > $6K+ if this macro divergence continues.
-This setup resembles early 2020, right before the massive crypto bull run.
If the dollar continues to weaken structurally, crypto markets led by Bitcoin and Ethereum could see accelerated momentum, pushing into parabolic territory by late 2025.
Cheers
Hexa🧘♀️
12R setup forming on SUITime to send it after that big channel retest? Clean 12R setup
Entry: 4.0
SL: 3.9
Target: 5.2

ALT SEASON Cycle Finale Special | SOL/ETH & TOTAL3Our last analysis of BTC.D ⬇️ and ETH/BTC ⬆️ () is now playing out, and we are entering the final stage of the 4-year crypto cycle -- ESCAPE VELOCITY for the rest of the crypto market.
As money flows up the risk curve, expecting SOL to outperform ETH from here, and the rest of the crypto market to outperform majors.
Welcome to the cycle finale special!
$BTC Will Go Up Alongside Alt SeasonSomeone posted on one of my tweets the following:
" Jonnie my bro, the only problem for me right now is that btc didnt top yet. You also talked how btc shoud top around 200k range. Alt season can only come when btc reach top"
MYTH DEBUNKED ✅
CRYPTOCAP:BTC does NOT need to top in order for Alt Season to commence.
Both can and will occur in tandem 🤝
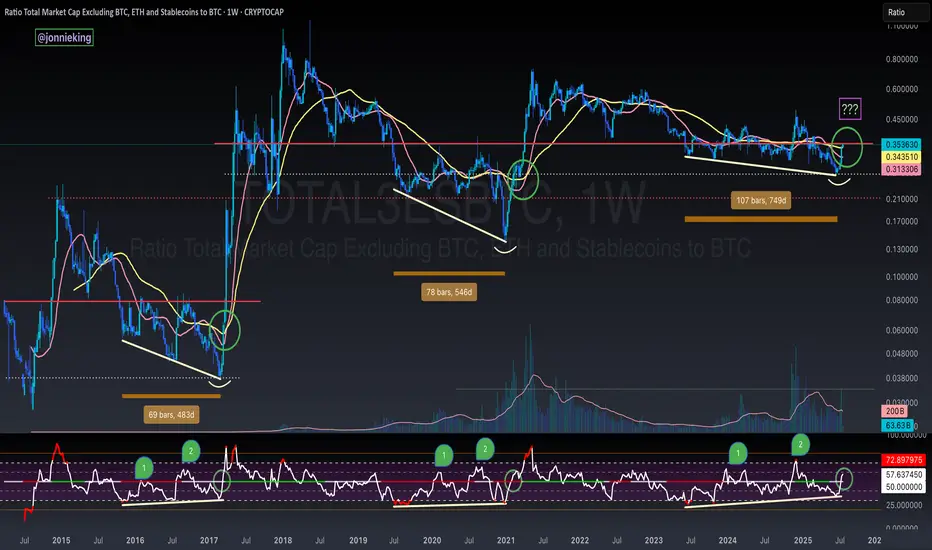
TOTAL3 / BTC - ALT SEASON BREAKOUT - Bullish Divergence SpottedBULLISH DIVERGENCE on CRYPTOCAP:TOTAL3 against CRYPTOCAP:BTC 🏁
You will see every time the RSI passed 50 on the Weekly chart in the post-Halving year it signaled Alt Season 🚀
This coincided with 3 tests of this level at 50, with the 3rd test being the real breakout 🤌🏼
Volume confirms change in trend 🏁
AWAITING CONFIRMATION 🚨
🅾️ Close several Weeks above key neckline resistance (currently here)
🅾️ Bullish Cross on the 20 / 50WMA
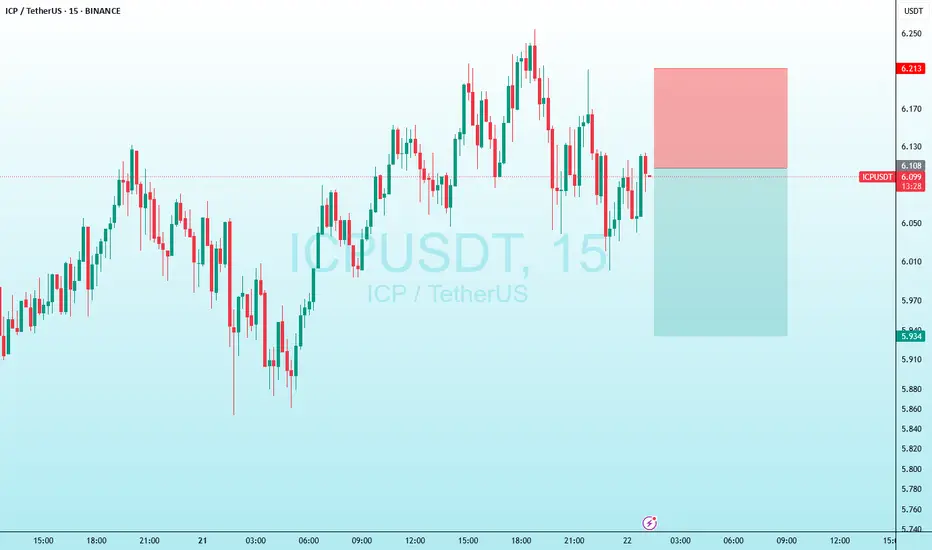
icp short tradein my opinion this is a good trade with a good r/r
hope it hit the target
consider this is my trade not your trade and i just like to share my trades with world
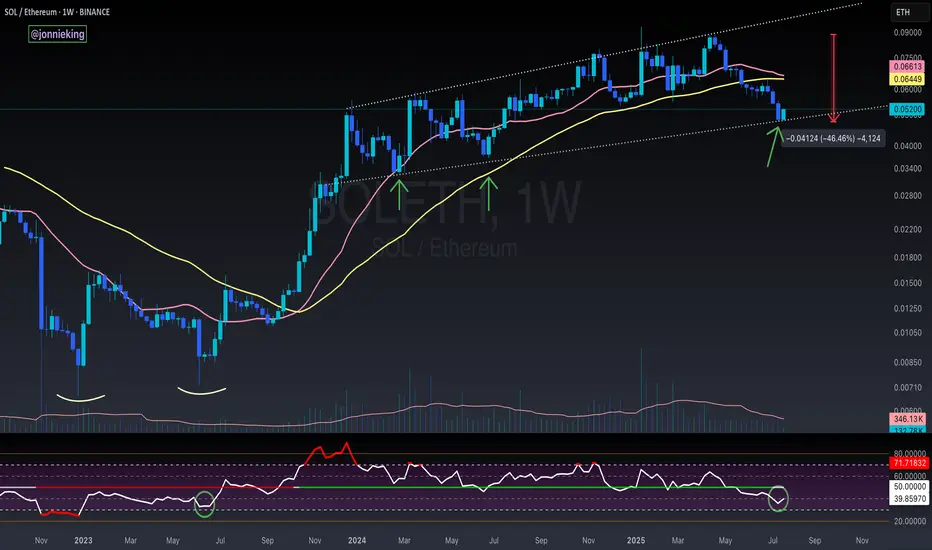
SOL / ETH - Reversal Signs FormingI suspect CRYPTOCAP:ETH has a bit more gas in the tank, but the early signs for the real Alt Season are nearing.
RSI on the weekly is nearing the June 2023 bottom which kicked off the massive bull flag formed on SOL / ETH for the next 2 years.
Still too early to call at this point tho.
Need volume to really burst through in the next week or two.
I’d also like to see BOATS:SOL close the week with a massive bullish engulfing candle.
The bearish cross on the 20 / 50WMA should mark the bottom when it occurs soon.
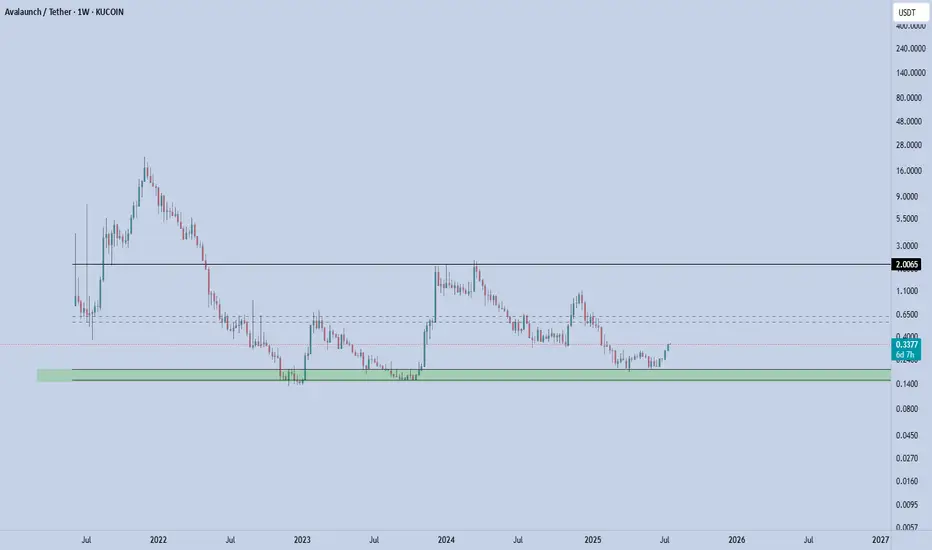
XAVA - Rebound in Play XAVA coin is currently stabilizing in a key support zone — the bottom of the defined channel, which has proven to be a strong and reliable support area. Price recently bounced from this level, confirming buyer interest.
From here, the next immediate target is the mid-range of the channel. If price manages to break above and hold the mid-channel, the next upside objective becomes the top of the channel.
Key Levels
Support (Channel Low): 0.15(invalidation below this level)
First Target (Mid-Channel): 0.56-0.62
Second Target (Channel High): 2
📌 Risk Management: A clean break below 0.15 invalidates this setup. As long as this level holds, the structure remains constructive and favors rotation toward higher levels within the channel.
luna long positionin my opinion this is a good trade with a good r/r
hope hit the tp
consider this is my trade not your trade and i just like to share my trades with world

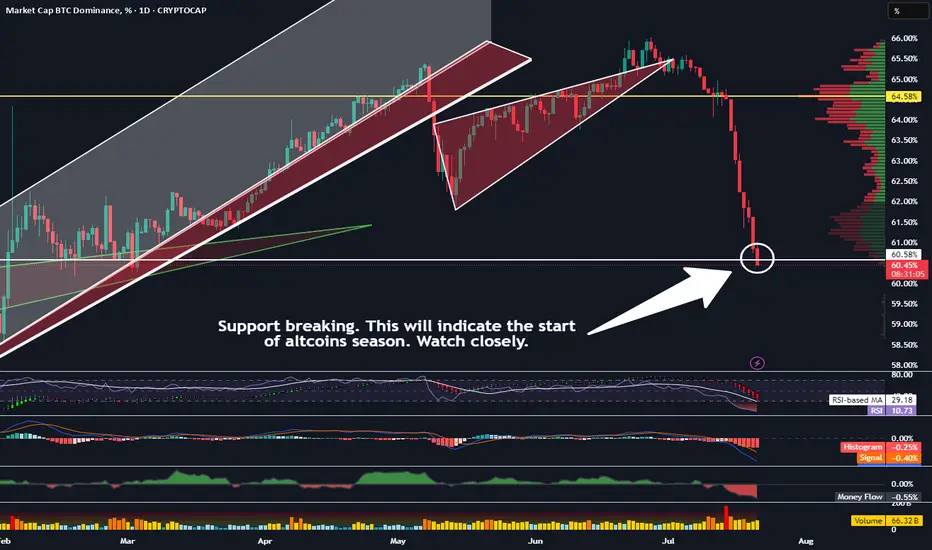
When This Support Breaks, Altcoin Season Becomes Official!Trading Fam,
We have many signs that altcoin season is almost upon us. Solana is breaking important resistance. Eth is nearing its target (both of these posts can be found below). But the most important indicator imo can be found on our BTC.D chart. Dominance has now reached an important support. I was kind of expecting a bounce here. And it still could bounce. But if it doesn't, then I feel like I can officially state that we will be in altcoin season for the rest of the year. Here's what you should be watching. If the body of that daily candle closes below our support today and then a new one opens and also closes below the support, its a wrap.
Let's go!
✌️Stew
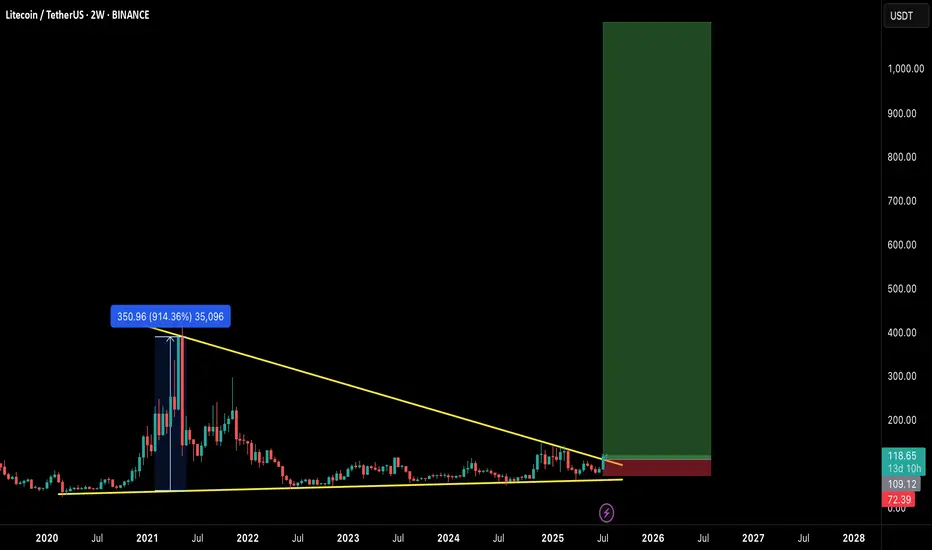
$LTC READY FOR EXPLOSION! THE COMEBACK OF THE OG?Litecoin has quietly formed one of the most massive macro structures in the market — a multi-year falling wedge on the 2-week timeframe, now breaking out with early confirmation.
This could be the start of a generational move, similar to the 2020 breakout. Let's break it down:
🧠 Technical Breakdown:
✅ Falling wedge forming since 2021 — 4 years of compression
✅ Volume and structure support breakout
✅ LTC already gave a 914% rally last time it broke a similar level
📏 Target zone extends above $900–$1000
🛒 Entry Zone:
Current Price: $118
🟢 Buy on breakout or dips near $105–$110 for safer entries
🎯 Target Zones:
TP1: $280
TP2: $400
TP3: $650
TP4: $950+
🛑 Stop-loss:
Breakdown below $72 (last higher low & wedge base)
⚖️ Risk-to-Reward:
High timeframe structure = High conviction play.
Potential R:R > 8x — Rare macro opportunities like this don’t come often.
🧩 Final Thoughts:
LTC may not be the flashiest alt anymore, but this setup is technically undeniable. If BTC enters full bull cycle, LTC could ride the wave explosively.
🔥 This could be a "buy and forget" macro play for 6–12 months.
💬 Let me know your thoughts in the comments & hit that ❤️ if you like macro setups like these!
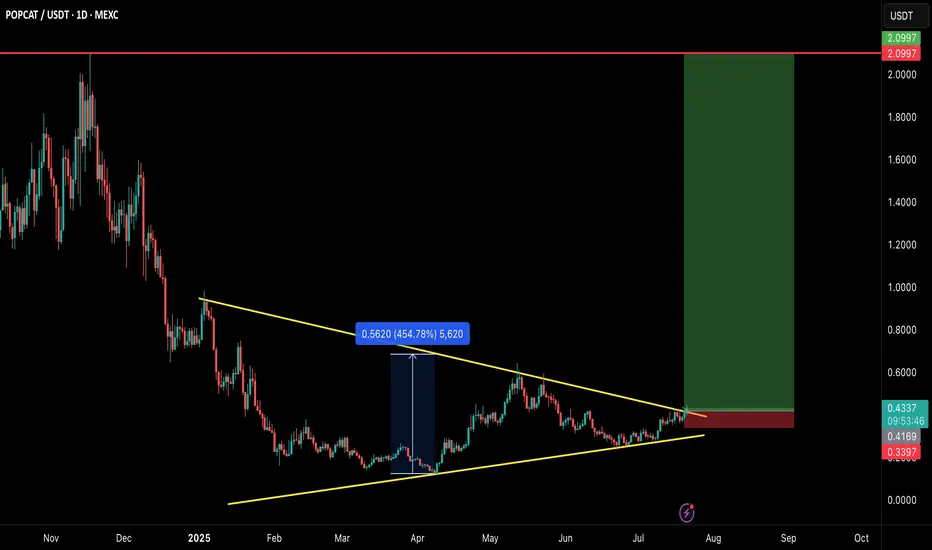
POPCAT/USDT – MEGA BREAKOUT INCOMING!POPCAT is breaking out of a large symmetrical triangle structure that has been developing for several months. This is a textbook bullish reversal setup with explosive potential — and the chart says it all! 👇
🧠 Technical Breakdown:
✅ Clean symmetrical triangle breakout on daily timeframe
🔥 Strong base formation followed by volume breakout
💹 Consolidated above trendline for weeks — breakout looks real
🛒 Entry Zone:
CMP ($0.43) or buy in dips toward $0.40–$0.42
🎯 Targets:
TP1: $0.65
TP2: $1.10
TP3: $1.60
TP4: $2.10
🛑 Stop-loss:
Close below $0.34
📊 Risk/Reward:
Solid RR > 4.0 with high potential if momentum kicks in. Volume and structure both support a strong upside.
📢 Final Thoughts:
This is not just a breakout — it's a multi-month accumulation breakout. If the market stays bullish, POPCAT could go parabolic again just like it did earlier.
🚨 Always use proper risk management and SL!
💬 Drop your thoughts in comments & don’t forget to hit that ❤️ if you find this helpful.
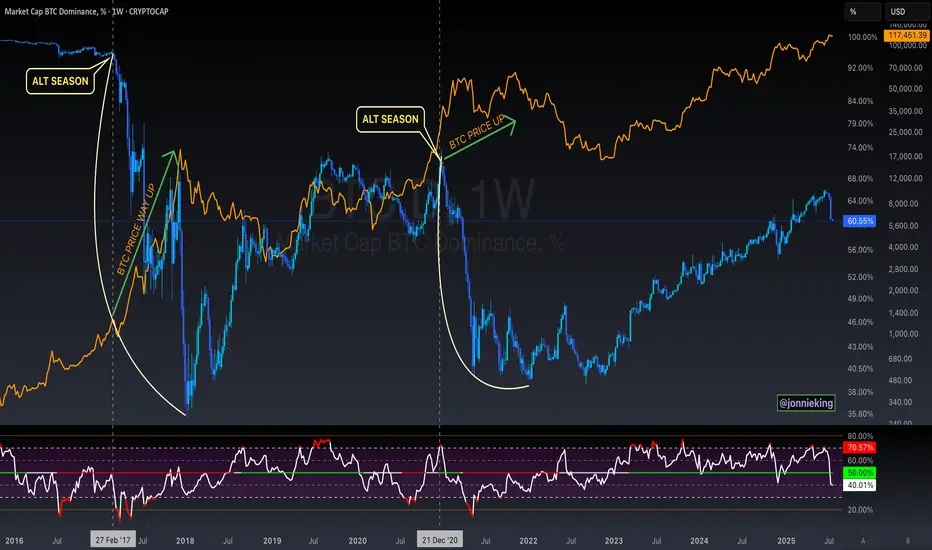
WARNING Bitcoin Dominance is about to reach support -ALTS
All the Cries of "ALT SEASON AT LAST" could be about to stumble if BTC.D finds support on the line of support shown in the chart , that has provided support previously.
There is no way of knowing if it will bounce or not but CAUTION IS A VERY GOOD IDEA
We will know soon enough
