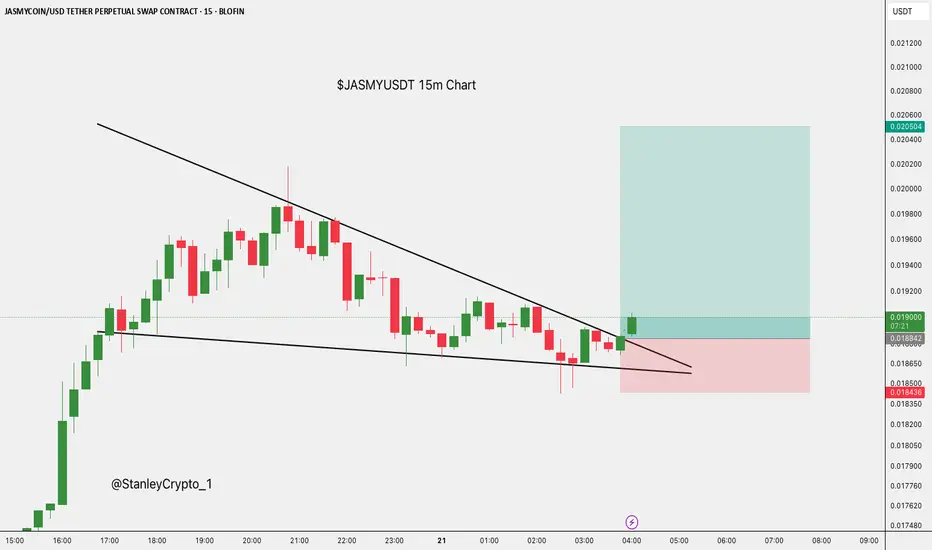
$JASMY 15Min Breakout Setup.$JASMY/USDT – 15Min Breakout Setup
- Entry: CMP
- SL: $0.018432
- Targets:
- TP1: $0.019604
- TP2: $0.020505
Wedge breakout forming.
DYOR, NFA
Altseason
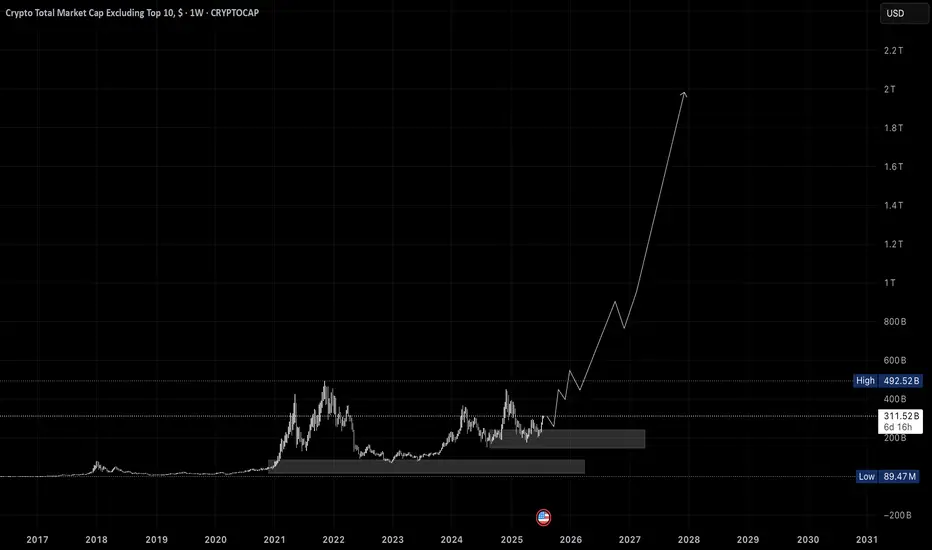
ALTSEAON CHART UPDATE OF CRYPTOCURRECIESthis is altcoins chart , braking through a bulling orderblock ,
its high prbable this gonna break ATH and the move to the new wealth making moves ,
investment is high risk and high rewarding
Altseason Loading?BTC Dominance chart has once again respected the long-term descending trendline resistance, showing a sharp monthly rejection. Historically, similar rejections have marked the beginning of ALT seasons, where capital flows out of Bitcoin into altcoins, boosting their performance significantly.
Chart Highlights:
-Major triangle pattern since 2017
-Clear rejections from the upper trendline coincide with previous ALT seasons (2018, 2021)
-Current rejection resembles those past cycles
-A move down in dominance could fuel strong altcoin rallies
If BTC dominance continues to decline, we could be entering another powerful altcoin season in the coming months.
Cheers
Hexa🧘♀️
CRYPTOCAP:BTC.D BINANCE:BTCUSDT

DOGE | Gearing up For a BIG MOVEDoge is looking mighty bullish after establishing a clear bottom.
Together with confirmation from BTC, we can safely say that altseason is yet ahead of us. BTC's recent increase show that the bullish impulse is still upon us. And after ETH increases, the rest of the altcoin market will follow suit as per usual.
DOGE is bullish because:
✅ Clear bottom
✅ Higher lows, daily looking to reclaim the moving averages:
✅ Altseason upon us after ETH increase
Ultimately, we need to wait for confirmation - if THIS major resistance zone is cleared (in other words if daily candles close ABOVE this zone) then we're full bull mode.
________________
BINANCE:DOGEUSDT

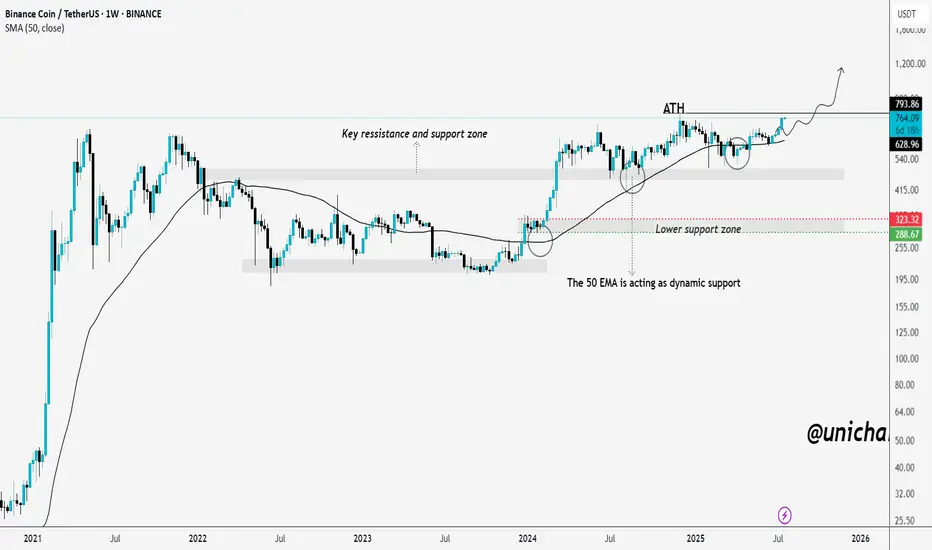
BNB on the Brink of a Breakout – ATH in Sight!We told you earlier — mark our words. BNB is now on the verge of breaking into a new all-time high, and the chart has been signaling this move for months.
The price has consistently respected the key support-resistance zone around $500–$540, and the 50-week EMA has acted as dynamic support throughout the uptrend.
Each dip into the lower support zone between $290–$320 was quickly bought up, showing strong buyer interest and demand. After several healthy consolidations and retests, BNB is once again approaching the previous ATH around $793.
If it breaks above with strong volume, we could enter price discovery mode. All the signs are aligning — and if you caught the early setups, you’re already in a great position. If not, it’s time to stay sharp and watch this breakout zone closely.
The momentum is real, and the fireworks might just be getting started.
THANKS
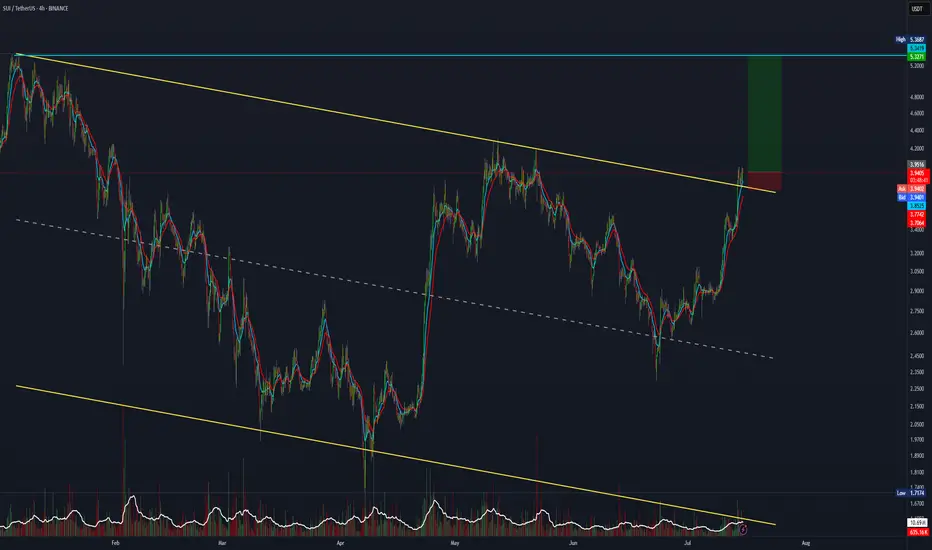
SUI trade setup with a 7:1 risk-to-reward ratio.SUI has broken out and retested the major channel. If you're bullish, this 7:1 R:R setup is worth considering.
Entry: 3.94
Stop Loss: 3.77
Target: 5.30.
20:1 R:R for SolanaTaking a chance on this super high-risk setup with a 20:1 R:R before it takes off.
Entry: 177.78
Stop Loss: 173
Target: 260

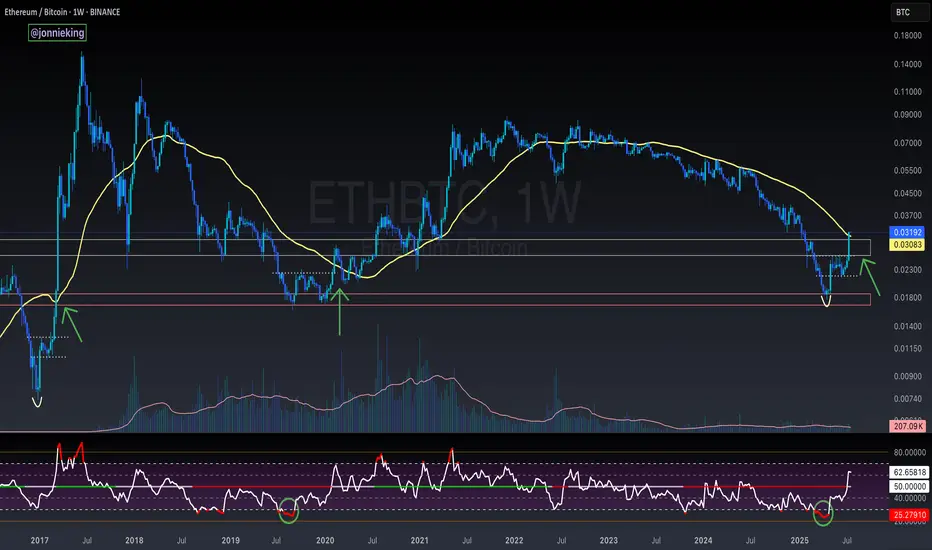
$ETH Closes Above the 50WMA - Alt Season Signal ALT SEASON ALERT 🚨
CRYPTOCAP:ETH Closed the Week ABOVE the 50WMA
Historically this has signaled the start of ALT SEASON.
*NOTE* 2020 had the pandemic hiccup.
This bottoming pattern looks very similar to the 2017 explosion.
Also the RSI matches the 2019 bottom.
Dare I call it yet bros? 🤓
ETH Weekly Recap & Game Plan 20/07/2025📈 ETH Weekly Recap & Game Plan
🧠 Fundamentals & Sentiment
Market Context:
ETH continues its bullish momentum, driven by institutional demand and a supportive U.S. policy environment.
We captured strong profits by sticking to the plan (see chart below).
🔍 Technical Analysis
✅ Price has run into HTF liquidity at $3,750
📊 Daily RSI has entered the overbought zone, signaling potential short-term exhaustion.
We may see a brief retracement or LTF liquidity grabs, which could be enough to fuel a further push higher — potentially to $4,087.
🧭 Game Plan
I’m watching two key downside liquidity levels:
$3,534 (black line)
$3,464
A sweep of either could provide the liquidity needed for continuation toward $4,087.
⚠️ I’ll wait for LTF confirmation before entering a position.
📌 Follow for Weekly Recaps & Game Plans
If you find this analysis helpful, follow me for weekly ETH updates, smart money insights, and trade setups based on structure + liquidity.

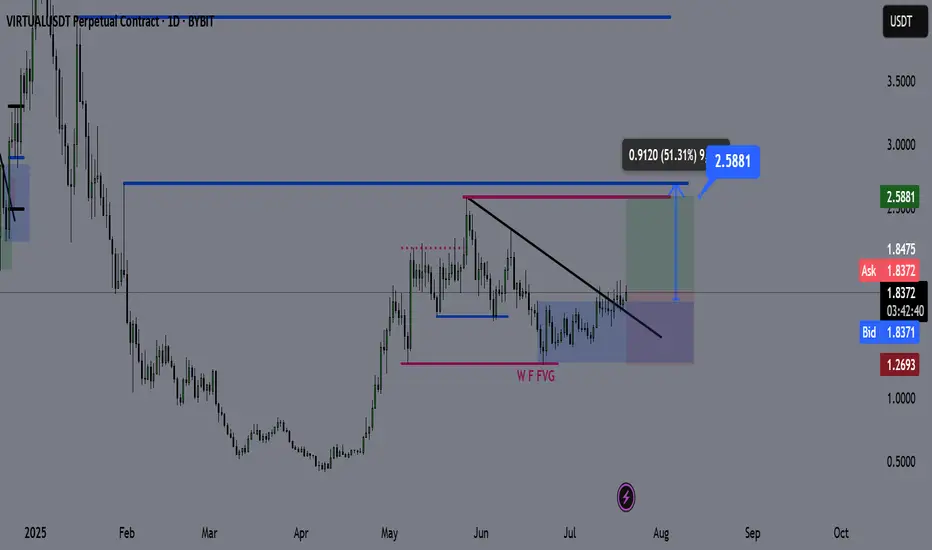
Virtual Coin – Technical Outlook & Trade Plan🔍 Technical Analysis
✅ Price has broken and closed above the bearish trendline, indicating a shift in market structure.
✅ It’s currently consolidating above the trendline, and each retest is showing strong bullish reactions.
✅ The bullish daily demand zone is holding aggressively, reinforcing upward momentum.
I do not expect a significant retracement from here until we reach the purple line (2.59). The current structure suggests price wants to seek higher liquidity.
📌 Trade Plan
Entry: Current market (above trendline + demand zone reaction)
Take Profit (TP): 2.59 (Purple Line)
Stop Loss (SL): 1.26 (Daily Close Below)
📊 Bias: Bullish
🕰️ Timeframe: Daily
📍 Invalidation: Daily close below the demand zone and trendline support
💬 Feel free to share your thoughts or ask questions below!
Eth and the Altcoin Season Once Etherum retest and breaks previous cycle ATH and LMACD visits the diagonal traced from previous cycles (white dot). An altcoins season might follow.

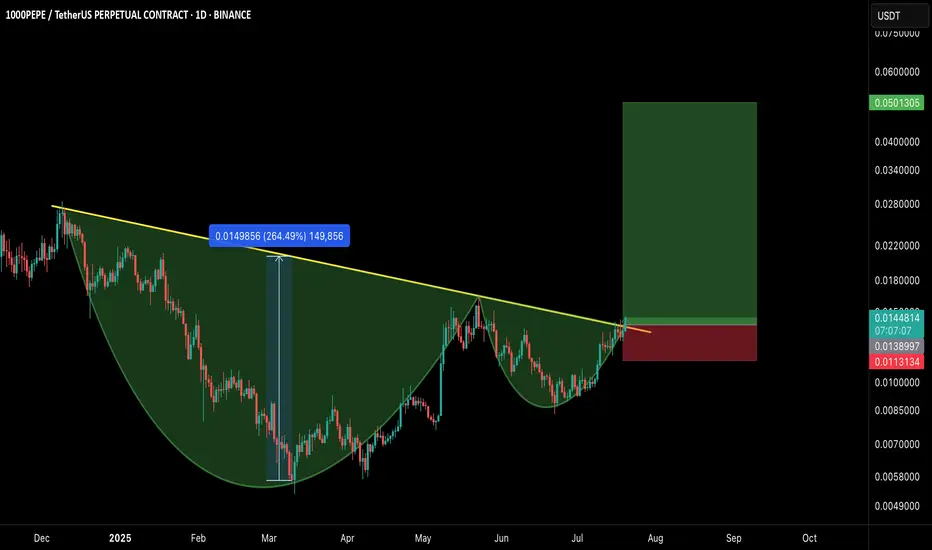
1000PEPE/USDT – CUP & HANDLE BREAKOUT!Hey Traders!
If you’re finding value in this analysis, smash that 👍 and hit Follow for high-accuracy trade setups that actually deliver!
A classic Cup and Handle formation just broke out with strong bullish confirmation, signaling the potential start of a massive trend reversal on the higher timeframe.
📊 Pattern Breakdown
✅ Cup & Handle pattern forming over 7+ months
📐 Breakout above neckline with volume confirmation
📈 Measured move target points towards $0.0501+
🛒 Long Entry:
CMP or on retest near $0.0128–$0.0138
🎯 Targets:
TP1: $0.022
TP2: $0.028
TP3: $0.035
TP4: $0.050
🛑 Stop-loss:
Below handle low — around $0.0113
📌 Risk-to-Reward:
Insane potential here with a 3.5R+ setup even with conservative targets.
📢 Final Thoughts:
This is a textbook reversal pattern breaking out after long accumulation. If BTC remains stable or bullish, meme momentum could supercharge this move.
DYOR + SL is a must!
Time to Peel Some Gains — BananaUSDT Ripening at the Midline
📈 Technical Overview:
BananaUSDT is currently testing the midline of the descending channel. A confirmed breakout above this level could trigger a bullish move toward the top of the channel, which aligns with our secondary target. Until the breakout is validated, the price may continue to range within the current structure.
🔸 Watchlist Status:
Setup is not confirmed yet — keep this on your watchlist and wait for a clear breakout above the midline.
📍 Next resistance: Top of the channel
📍 Invalidation: Rejection at midline or breakdown below recent support
📉 Risk Management:
Enter only after confirmation, and risk no more than 1% of your capital. Always define your stop-loss.

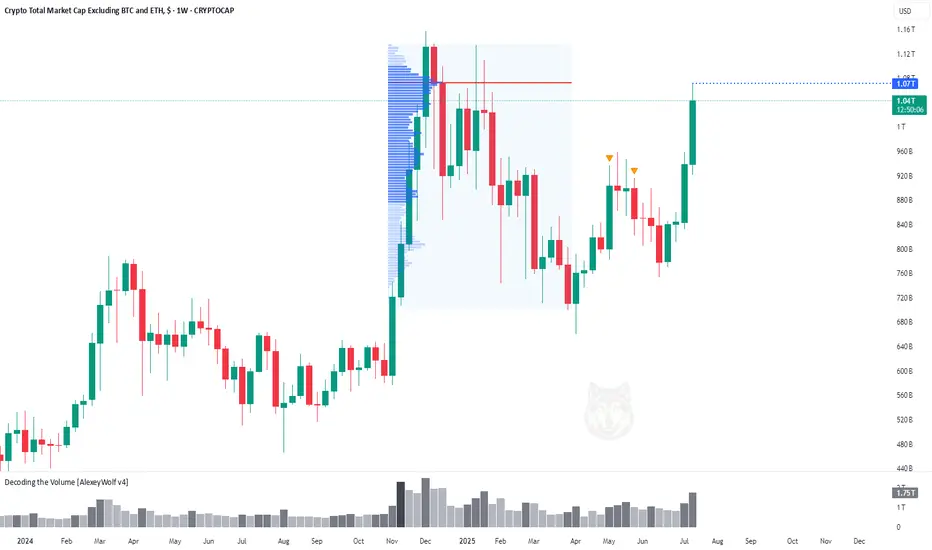
Altcoin Market Hits First Target at $1.07THi traders and investors!
The market capitalization of Total3 has reached $1.07 trillion, marking the first major target for the altcoin market.
This level corresponds to the Point of Control (POC) from the previous bullish rally and the subsequent correction — a key area of traded volume and market interest.
Several factors now suggest the potential for a continued move higher. On the fundamental side, the recent signing of a pro-crypto bill by Donald Trump has boosted overall sentiment in the digital asset space, especially among altcoins. From a technical perspective, many leading altcoins are showing bullish continuation patterns.
Wishing you profitable trades!
$SHIB Ready to Move?CRYPTOCAP:SHIB has printed confirmed weekly bullish divergence in RSI and is now attempting to overcome the weekly 200EMA resistance.
A High Volume Node lies just above but a close above this will signal a bullish trend ready to move the initial target of the weekly pivot point followed by the 0.0003579 High Volume Node.
Price completed its retracement to the 'alt-coin' golden pocket 0.786 Fibonacci retracement.
Bearish divergence is currently growing on the weekly RSI but will be diverted with a thrust high!
Is it MEME season? CRYPTOCAP:DOGE also looks ready to go!
Safe trading

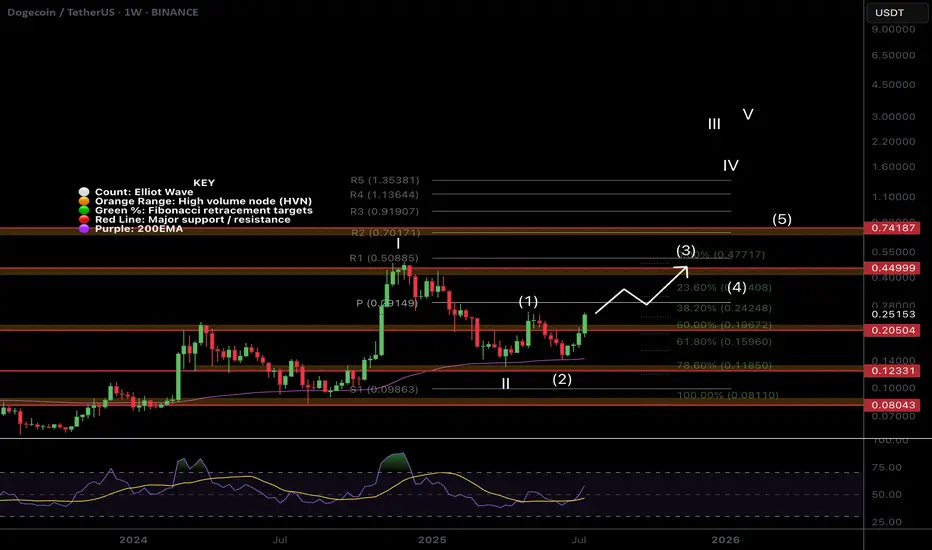
$DOGE Flipping to Bullish Structure!CRYPTOCAP:DOGE is coming to life after a second test of the weekly 200EMA as support and about to make a higher high, cementing in that higher low and flipping the macro structure bullish!
If the count is correct wave 3 of (III) should be powerful! The weekly pivot should put up a challenge as the first resistance before the High Volume Node at $0.45
Safe Trading
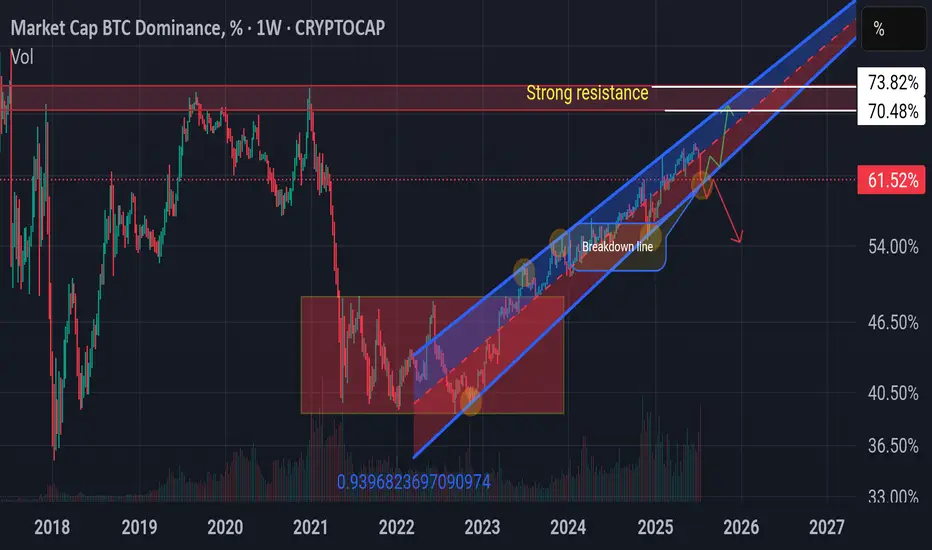
BTC Dominance Rebound???🧭 Market Outlook
BTC Dominance (BTC.D) remains in an uptrend channel → investors still favoring CRYPTOCAP:BTC over alts.
📉 From Jun 28 to Jul 18, BTC.D dropped -7%, fueling a solid rally in ETH & alts.
⚠️ BTC.D may bounce back if it fails to break the key support (breakdown line/golden circle). Next resistance zone: 70.48%–73.82%. If this plays out → alts may lag during BTC pumps & dump harder on corrections.
🌊 Altseason only if BTC.D breaks down decisively.
But not all alts will fly. Be selective — don’t go all-in on a single coin. 🧠
baby baby KAVAlook how lovely this triangle is! I longed the dip near the trendline! lets see whats gonna happen! big gainssssss

FET Secondary trend 19 07 2025Logarithm. Time frame 1 week for clarity.
Main trend is an ascending channel.
Secondary trend is a descending channel
Local trend is a Ross hook, at the median resistance. Reversal zone.
By the way, the trading idea from 2022 FET/BTC is still relevant. Pay attention to where the price is.
FET/BTC Main trend. Pump zone cycles . 2022 06

Ripple Update: Is XRP Ready for Another 500% Growth?Hey friends, it’s Skeptic 🩵 . In this video, I’m giving an update on Ripple’s conditions , reviewing past triggers, and what to do with your long positions in futures if you’re still holding. For spot, what’s the move? I dove into XRP/BTC analysis and, at the end, broke down BTC.D , which just had a major event you need to pay close attention to. Don’t forget money management, and stay clear of FOMO. Drop your thoughts on XRP in the comments so we can chat about it!

Skeptic | XRP Analysis: Can It Hit $6 After Bitcoin’s $111k?Hey everyone, Skeptic here! Bitcoin just smashed through the $107K resistance, shaking up the whole crypto scene! Is XRP ready to rocket to $6 ? Curious about spot and futures triggers? Stick with me to the end of this analysis for the full breakdown. 😊 Let’s dive in with the Daily Timeframe. 📊
Daily Timeframe: The Big Picture
After an epic 500% rally , XRP has entered a consolidation phase, which we can spot from the decreasing volume. It’s too early to call this a distribution or re-accumulation, but I’m leaning toward re-accumulation for a few reasons:
Bitcoin’s Uptrend: The ongoing bullish trend in Bitcoin is fueling crypto market liquidity.
Positive XRP News:
Ripple and the U.S. SEC reached a settlement in early May 2025, ending a long legal battle over XRP’s status as a security. Ripple paid a $50 million fine, with $75 million of a $125 million escrow returned. This cleared major regulatory uncertainty, boosting investor confidence and paving the way for broader U.S. adoption.
XRP Spot ETF Speculation: BlackRock reportedly discussed an XRP ETF application with the SEC, and firms like Franklin Templeton and Bitwise have filed for XRP ETFs. With the SEC’s new crypto-friendly leadership, the odds of ETF approval are 80-85% by the end of 2025, potentially unlocking massive institutional capital.
Spot Trigger:
The main trigger is a break and consolidation above 3.3684 , which aligns with breaking the daily consolidation box.
This could kick off a new momentum wave. Expect a sharp breakout, so don’t miss it!
If you’re aiming for a long-term buy, I’ll share lower timeframe triggers to front-run this breakout.
First Target :
After breaking the box’s ceiling, aim for 6.64 . I cloned the box and placed it above, as this often works for target setting. 🙂
Tip: Pay close attention to Bitcoin and USDT.D for better target spotting.
4-Hour Timeframe: Long & Short Setups
On the 4-hour chart, price action is getting tighter and tighter, which is awesome. Why? The longer we range, the more liquidity builds up, setting us up for a sharp move with smaller stop losses compared to trending markets. Here’s the breakdown:
Market Context:
The 4-hour timeframe shows stronger bearish momentum, but remember: the major trend is uptrend, and the secondary trend is consolidation.
For shorts, keep position risk low since we’re in a bullish major trend.
For longs, hold positions longer and, if possible, lock in profits early without closing the entire position.
Long Setup:
Trigger : Open a long after a break above 2.4742 .
Key Notes:
Ensure the break comes with rising volume to avoid a fake breakout.
Reduce profit-taking on this position. Why? Higher levels have more liquidity, leading to sharp moves, making it harder to open new positions.
Short Setup:
Trigger: Open a short after a break below support at 2.2926 .
Advice: Take profits quickly and close the position when you hit your targets.
The current candle looks like it failed to break out and formed a shadow, which could increase the odds of a return to the ceiling and a resistance break.
Front-Running Spot Trigger:
To front-run the daily box breakout, open a position after breaking 2.9789 on the 4-hour timeframe.
XRP/BTC Analysis
XRP/BTC had a solid rally but is now in a price correction, and it’s a weak correction at that. Here’s what to watch:
Key Level : A break above resistance at 0.00002548 could bring back uptrend momentum to XRP/BTC.
Implication: If this breaks, buying XRP becomes more logical than Bitcoin, as XRP could outperform.
Until Then: Stick with longs on BTC, as liquidity is flowing more into Bitcoin, giving it stronger growth potential.
Pro Tip: Checking the BTC pair is a game-changer—trust me! 😎
💬 Let’s Talk!
If this analysis sparked some ideas, give it a quick boost—it really helps! 😊 Got a pair or setup you want me to dive into next? Drop it in the comments, and I’ll tackle it. Thanks for joining me—see you in the next one. Let's grow together! 🤍

ATH FOR Ethereum!!!Hello friends🙌
As you know, Ethereum has been on an upward trend these days and we can say that buyers have entered, but not completely...👀
🔊Now, considering the resistance that Ethereum is facing, namely the number 3900 to 4100, we need to see what reaction the price will see this time when the price reaches this resistance for the 4th time?
✔We will most likely make a small correction and this time this major resistance will be broken again and we will witness a higher ceiling.
✔Otherwise, I have an important and key support that we have identified for you and if the price drops, this support is a good area to buy again.
And finally, observe risk and capital management⚠
🔥Follow us for more signals🔥
*Trade safely with us*

Drop Your Token – I’ll Do The AnalysisHey everyone! Hope you’re having an amazing weekend !
Want me to analyze your favorite token ? Just drop your request in the comments using this format:
Request Format
Project Name: Bitcoin
Token Symbol: BTC( BINANCE:BTCUSDT )
Important Notes:
I’ll pick and analyze only the first 10 tokens requested .
One request per person — so choose wisely!
I’ll reply directly under your comment with the analysis.
If you find this helpful, don’t forget to Like ❤️ and Share this post with your friends!
Here’s to your success — health, wealth, and great trades! 🚀
