SAND – Rotation in PlaySAND is showing early signs of strength off the long-term demand zone near $0.23–0.24, where it's been accumulating for several months. Price just printed a strong weekly bounce, up +16%, reclaiming the bottom of the range.
This area has acted as a key base since mid-2023 — with each touch producing a notable reaction. Now trading at $0.286, SAND is attempting to rotate toward the top of the established range.
Key Levels
Support (Range Low): $0.23–0.24 (strong demand zone)
Resistance (Mid-Range): $0.43
Range High: $0.85
A clean flip of the mid-range ($0.43) could open the door to test $0.70+.
📌 Risk management: A break and weekly close below $0.23 invalidates this setup. As long as it holds, the upside potential is attractive from a risk/reward standpoint.
This is a classic accumulation > reclaim > expansion structure. Let the chart speak if the range holds, the rotation is in play.
Altseason2025

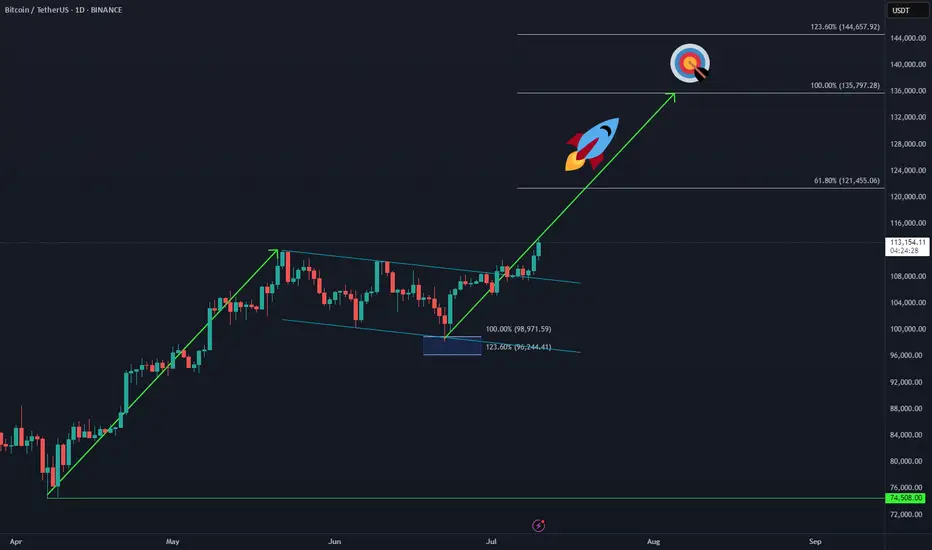
Bitcoin Makes New ATH – Next Sequence in Play 🚀 CRYPTO:BTCUSD has officially broken into new all-time highs, confirming the next bullish sequence is underway.
The upside projection now opens toward the $135K–$144K zone, aligning with long-term Fibonacci extensions and cycle projections.
📌 As always, it won’t be a straight line—expect step-by-step progress, with consolidations and pullbacks along the way. But the structure remains bullish, and the path is unfolding.
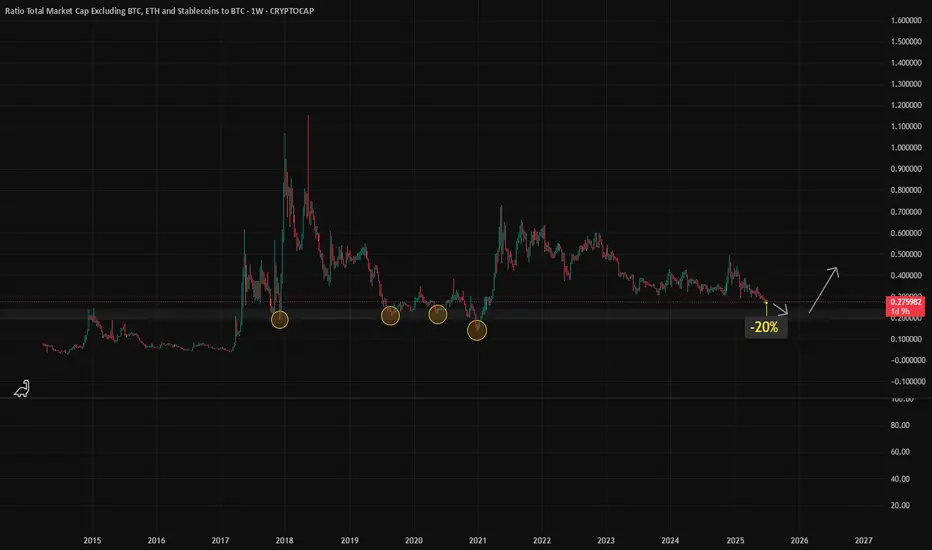
Altcoins Near Key Support, Possible -20% Drop before reversal ?Sharing my analysis on the altcoin market cap (excluding BTC, ETH, and stablecoins) compared to BTC over the past 10 years
I have marked important zones (yellow circles) where altcoins have historically bounced after strong corrections.
Current Outlook:
- I expect a possible -20% more downside, bringing it near 0.22, which aligns with a key historical support zone.
- This level has acted as a strong base multiple times, in 2018, 2020 and 2021
What I’m Watching:
- If price reaches that zone and holds, it could signal the start of the next altseason.
- Past patterns show similar moves before big reversals.
- However confirmation through volume and market sentiment is important before making any move
Final Note:
Not financial advice, just sharing what I see on the chart. If the ratio hits 0.22 and shows strength, it could be a key level to watch. Thanks
ALT PUMP INCOMINGdon't sell your alts lol they're about to pump! embrace em as dead as they are, and let them resurrect!
Altseason isn’t cancelled, it’s just delayed. Here's WHY!CRYPTOCAP:BTC Dominance Update:
Altseason isn’t cancelled, it’s just delayed.
The key zone to watch is 69.5%–73% dominance. That’s where we’re likely to see a strong rejection if it doesn't start soon, which seems unlikely given the current circumstances.
The longer it takes to reach that level, the stronger the altcoin rally will be once it hits.
This isn’t hope, it’s exactly what the charts are showing.
Historically, 70% dominance has acted as a major reversal zone.
If there are signs of reversal before this level, I'll let you know beforehand.
So follow me if you don't and share this chart with your crypto friends.
Do not forget to keep cash/stables!
Let me know what you think in the comments.
Thank you
#PEACE

Altcoin Season - Just around the corner!!!In this analysis I share my hypothesis on #OTHERS CRYPTOCAP:OTHERS as to why the big awaited alt season is right around the corner !
After analysing how the Trump mania season unfolded, I could see plenty of similarities:
1. Price filled the supply before the last retrace - gray rectangle
2. Then it broke the downtrend line and made a decent move up - red dot
3. Price correction to the 618 retrace on fib AND in the supply -> became demand from #1
4. RSI formed a hidden bullish divergence, marking a potential start of the rally
5. Time passed from #2 trendline breakout to the big impulse -> around 50 days
-> now we are around 60 days, which means more time to accumulate, bigger impulse
In an ideal scenario, the total OTHERS cap (all crypto excluding top 10) should at least reach the last high of 450 billions, and to pour some hopium, to around 600-700 billions...
So if you filled your bags around recent prices on your alts, you should expect at least 10-20x imo!

OP / USDT 4hr PUMP INCOMING? OP/USDT – 4H Chart Summary
Market Structure:
4H Timeframe:
- Price consolidating within a descending triangle/wedge pattern, indicating potential buildup before a breakout.
- Lower Timeframes (1H and below): Bearish trend structure with lower highs and lows.
- OBV (On-Balance Volume): Forming a wedge—suggesting accumulation or distribution phase nearing a breakout.
Key Zones:
Demand Zone (Support):
- 0.5483 – 0.6351
This area has provided strong support historically. A clean break below could signal continuation of the larger downtrend.
Supply Zone (Resistance):
- 0.9068 – 1.0414
-Historically rejected price; high probability of reversal or consolidation if revisited.
Fair Value Gaps (FVG):
- FVG 1: 0.6659 – 0.6838
- FVG 2: 0.7024 – 0.7308
These inefficiency zones are likely to attract price if bullish momentum builds. Watch for potential short-term rejection or continuation setups here.
Volume Profile:
Strongest volume node (high liquidity zone) sits between 0.7470 – 0.8000
Suggests this area has been heavily traded and may act as magnet/resistance if approached again.
Fibonacci Confluence:
Previous swing high at 0.8232 aligns with the 0.618–0.65 golden pocket
A critical zone for potential take-profit or trend reversal on a breakout.
Scenarios:
Bullish Case:
If price holds above 0.6351 and bounces, look for:
- Retest of FVG 1, followed by FVG 2.
- Breakthrough of 0.7308 could target the golden pocket and swing high at 0.8232.
- Sustained bullish move may reach the supply zone above 0.9068.
Bearish Case:
- Breakdown below 0.6351 and especially below 0.5483 would:
- Invalidate the wedge support.
- Confirm continuation of the macro downtrend.
-Open room for new lows and bearish expansion.
Conclusion:
Price is at a key decision point inside a wedge.
Reaction at 0.6351 is critical—support bounce targets higher inefficiencies; breakdown signals deeper bearish continuation.
OBV and volume structure suggest an imminent volatility spike—prepare for a breakout.

Alt Season: When’s the Big Boom?TOTALE100 refers to small caps or the total market capitalization of the top 100 cryptocurrencies , excluding stablecoins. It is part of the CRYPTOCAP series.
It measures the total combined market cap (price × circulating supply) of the top 100 crypto assets by market cap.
Useful for:
* Gauging overall market strength or weakness.
* Spotting macro-level trends or capital inflows/outflows into the crypto sector.
Technical Outlook:
On the weekly chart, the price is facing rejection at 16B, forming a triple-top distribution pattern.
For positioning in small caps, we should wait for a price pullback to the key support zone between 5B and 3B.

$GRT IS ABOUT TO GO Graph ( JSE:GRT ) is about to go. Zoom in and out and see it for yourself. History will always repeat itself. You can see the short term targets

BTCUSDT – Strategy and Trend Probabilities for 2025In my opinion, Bitcoin (BTC) has become less interesting — there isn’t much room left for significant movement, and most of the “cream” has already been skimmed off. However, since it's essentially the index of the crypto market, I’m sharing this trading idea for context - to show where we currently are and what scenarios might unfold.
The price is globally moving within an ascending channel.
A secondary triangle pattern is forming.
Within this triangle, we can see the outlines of an inverse head and shoulders pattern - or possibly a cup and handle - both aligning with the channel’s resistance.
Potential scenarios:
a) Price breaks out of the triangle.
b) Price moves toward the triangle’s support, forming another wave inside it.
c) Price moves to retest the main ascending channel’s support.
d) Price fluctuates within the central range of the channel.
There aren't many options, and none of them would break the primary trend. Altcoin movements will largely depend on BTC’s behavior.
Therefore, it’s crucial to build a trading strategy that considers both the likely and less likely (but possible) outcomes.
Looking at the broader picture:
The previous minor altseason (winter 2024) was short and weak, except for a few coins.
There was no real secondary altseason in spring 2025.
Statistically, summer tends to be quiet - due to holidays and so on.
The first two points contradicted the expectations of most traders - so we’ll see how things play out with the third. If there's no altseason in summer either, then logically, winter might turn out to be quite aggressive.

PEOPLE - Inverse Head & Shoulder Long SetupBINANCE:PEOPLEUSDT
𝐏𝐄𝐎𝐏𝐋𝐄/𝐔𝐒𝐃𝐓
People is shaping a classic inverse head & shoulders just under trendline resistance. A breakout could fuel a 113% move toward $0.054. Chart’s heating up

HMSTR Main Trend -80% Descending Channel 08 06 2025Logarithm. Time frame 3 days.
The main trend is a descending channel.
Secondary is an ascending channel.
Local trend is descending and a rollback from the key resistance.
While the price is in a descending channel, it is rational to work and focus on dynamic trend supports/resistances, using this volatility.
Locally, on a breakthrough of the designated trend line. To the resistance of the channel itself (the main trend) from it (the local line of the descending trend) a significant %. Then on the chart you will see a double bottom, or a "dragon" pattern, depending on what time and in what price zone (collecting long stops or without this manipulative action) they will make a reversal of the local trend.
Once again, I will say what was said earlier in the previous updates of this cryptocurrency and similar altcoins. Reductions from listing by -80%. For assets of such liquidity, this is quite small (reversal of the main trend). As a rule, the decline in the main trend occurs by 94-98%, with very rare exceptions. Therefore, remember this, and observe money management. But, if the altcoin market as a whole is reversed after the bitcoin season and consolidation, then they will pump, like everyone else.
If you are not a trader at all, but want to "own" this cryptocurrency in your portfolio, for reasons that are clear to you, then it is rational to collect from key levels - support zones (shown in the idea itself, move the chart), from a smaller amount to a larger one, and the entire amount allocated for such assets is allocated in advance, and not after the fact. You can take a little now, or rather place an order for a breakthrough of the local trend line (optional).
There are a huge number of subscribers on Twitter — 12.9 million people! When the time comes, and it will be rational from the market position, then this “army” will be sent to buy through positive posts. However, everything is as always... Perhaps that is why it is worthwhile to collect such assets in good zones without fanaticism, at least to take a closer look, before the alt season, which everyone has already “buried” (everything is as always).

NOT / USD. Local trend. Reversal zones 08 06 2025Local work ("market noise") is not a breakout of the inverted head and shoulders resistance zone (yellow reversal level). A rollback back to the horizontal channel formation zone with a 100% step. Everything is as before, nothing new can happen, for clarity, I showed the % to the key local support/resistance levels.
NOT Main trend. Channel. 16 03 2025

Altseason Index Proxy (TOTAL3 / BTC.D) Weekly TF
Symbol & Timeframe:
* **Symbol**: CRYPTOCAP\:TOTAL3 / CRYPTOCAP\:BTC.D
* **Timeframe**: Weekly (1W),
* **Purpose**: A clean, data-driven proxy for detecting altseason momentum
Technical Structure:
✅ Key Support Zones
* **13.47B (61.8% Fib)**: Critical golden zone; current price consolidation area
* **12.45B (50.0% Fib)**: Lower bound of golden zone
* **11.00B**: Historical support zone
* **8.15B (0.0%)**: Absolute bottom of retracement range
🔹 Hidden Bullish Divergence
* **MACD Histogram & Signal Lines** show hidden bullish divergence
* Price action forming **higher lows** while MACD makes **lower lows**
* Indicates trend continuation potential
🔢 Fibonacci Targets
TP1: 16.8B (100.0%)
TP2: 22.2B (161.8%)
TP3: 30.7B (261.8%)
🔄 Expected Path
* Potential short-term correction toward 12.4B followed by a breakout
* Bullish continuation path sketched with progressive Fib targets
📈 Macro & Fundamental Confluence
📉 Liquidity and Monetary Easing
* Global monetary policy is easing (e.g., Fed pivot expected mid-2025)
* Increased liquidity historically precedes strong altcoin rallies
BTC Dominance Decline
* BTC.D rolling down from long-term highs
* Signals beginning of capital rotation into altcoins
🚀 Emerging Narratives
* Rise of L2s (e.g., Base, zkSync), AI tokens, real-world asset protocols
* Fresh narratives tend to amplify altseason rotations
💼 Institutional Tailwinds
* Spot ETH ETF approvals pave way for alt ETF flows
* Regulatory clarity expected to reduce uncertainty in late 2025
Related Reference Charts:
🌐 TOTAL3 (Altcoin Market Cap Excluding BTC & ETH)
📊 BTC Dominance (BTC.D)
These charts offer standalone confirmation of:
Altcoin strength forming on TOTAL3
BTC dominance facing structural resistance
Composite Altseason Thesis:
1. Liquidity injections + halving = BTC rally
2. BTC.D breakdown + TOTAL3 support = altcoin strength
3. Technical confirmations: hidden divergence, fib confluence
4. Narrative and regulatory catalysts = widespread rotation
**Conclusion**:
We are entering a prime zone for altseason acceleration. Price reclaim above 13.47B and continued BTC.D drop will validate bullish thesis. Monitor closely for breakouts past TP1 and momentum into TP2/TP3.
📌 Current status:
- Price rebounding in the 12.45–13.47B Fibonacci zone (50–61.8%)
- Hidden bullish divergence on MACD + ascending price structure
- BTC.D has rolled off 65% resistance — suggesting capital rotation
📊 Altseason Thesis:
1. Post-halving BTC rally → profit dispersion into altcoins
2. Macro conditions (Fed pivot, record liquidity) enabling risk-on environment
3. Technical confirmation via index momentum and fib structure
4. Narrative tailwinds: Layer-2 adoption, AI-crypto, altcoin ETF catalysts
📈 Targets:
- TP1 @ 16.8B (100% Fib)
- TP2 @ 22.2B (161.8% Fib)
- TP3 @ 30.7B (261.8% Fib)
🟢 Key support: 12.45–13.47B zone; breakout + BTC.D collapse = altseason trigger.

ALTseason May Show Up In 2025We found an interesting chart, which is showing us the ratio of TOTAL3(ALTcoins) market cap against Bitcoin with ticker TOTAL3ESBTC. Well, even this chart is showing that ALTcoins may start outperforming BTC soon. It can be finishing final subwave C of (Y) of a correction in blue wave B that can cause a new strong rally into wave C, which can bring the ALTseason similar as in the beginning 2021.

Bozo Benk – Road to Top 300
Bozo is a low-float, high-conviction breakout that’s showing all the early signs of a full-blown cycle runner. Right now, it’s flying under the radar — but that won’t last long.
coingecko: BozoBenk
Key Metrics:
Current Market Cap: $4.72M
Target Market Cap (Top 300 Range): ~$200M
Total Supply: 800M
Circulating Supply: ~400M (50% of tokens are locked)
If we hit a $200M market cap on just 400M circulating tokens, that gives a projected price of:
$200,000,000 / 400,000,000 = $0.50 per token
That's a 100x from here — and yes, that’s within striking distance in meme coin terms when a proper run begins.
Why This Isn’t Just “What If” Talk:
Low Float = High Velocity
With only 400M tokens in circulation, price impact per dollar is massive. When buyers show up, price moves fast — and that speed becomes the magnet.
Breakout Is Confirmed
After months of accumulation, Bozo just cleared its resistance zone. Volume spike. Momentum flip. Classic early-stage markup.
Reflexivity Effect
As price rises, more eyes come in. CT starts posting. Telegrams start firing signals. The crowd sees the move, and FOMO becomes self-fueling. This is how 10x becomes 50x.
Realistic Target Based on Ecosystem
$200M is not a moonshot. There are dozens of meme coins with less utility and worse structure sitting at or above that level. If capital rotates back into memes — and it always does — Bozo is positioned to ride that wave hard.
The Alpha:
This isn’t about “maybe” — it’s a perfect mix of low cap, reduced float, clean chart, and momentum fuel.
A $200M market cap on 400M circulating tokens = $0.50.
You're here at ~$0.005.
That’s the kind of asymmetry you don’t get often — and when it runs, there won't be time to chase.
Know what you hold. Trade it like you mean it.

$FET is about to re-enter my buy green zone. Quick update on this coin:
The consolidation appears to have found its bottom, and the bullish divergence has played out as expected.
We’re currently seeing a slight cooldown on the daily timeframe, which is healthy after the recent move.
If NYSE:FET enters my green buy zone, it could offer a strong long entry opportunity.
As always, make sure to DYOR, especially during these uncertain times for altcoins.
#FET #CryptoUpdate #Altcoins #TechnicalAnalysis #BullishDivergence #CryptoTrading #BuyZone #CryptoMarket

DOG Main Trend. Reversal Zones 05/29/2025Logarithm. Time frame 3 days. The chart shows key reversal zones in the horizontal channel, and when exiting it. For clarity, percentages are shown from the skin reversal zone. This is convenient for understanding the risk and potential profit in long and short work. You can also work in spot from long, from key zones (more relevant, as margin trading on assets of such liquidity, is extremely destructive, due to price slippage under the market, but already on such assets by a huge percentage, for your liquidation (accumulation of liquidity-benefit of gambling addicts in general).
Now the price has hit the resistance of the internal channel, that is, the zone of the “main liquid” price movement. From the reversal, local profit is significant, therefore, when working, observe risk management and wait for a breakthrough of this resistance level (you can place a trigger order), or wait for a rollback (if there is one), for example, to the median of the channel.
The horizontal channel itself is reformatted into a potential “microphone” (what was half a year ago on bitcoin, with resistance to the 72 thousand zone, and liquidity collection 53-58).

Bull Flag Forming on ETH/BTC – Altcoins About to Explode?$ETH/BTC just broke a key resistance line and is now forming a bullish flag — this is big for altcoins.
Why? Because when ETH starts gaining strength against BTC, it often signals the beginning of an altcoin rotation. Ethereum usually leads the pack — and when its BTC pair is bullish, altcoins tend to follow with strong momentum.
The breakout followed by a bull flag consolidation suggests continuation is likely. If ETH/BTC pushes higher from here, we could see capital flow from Bitcoin into altcoins, igniting the next leg of altseason.
Altcoins may be gearing up — stay sharp.

$ETH - Ethereum enters buy zoneHey traders!
How is your portfolio doing? Trump is shaking us!
After all these months in 2025 I've tried to project a new scenario (bullish/bearish) that clarifies our next outlook.
Not an easy job. As you see day by day, markets are in high volatility due to trade war and (not trying to be pesimistic) could be worse.
However, In my opinion Ethereum (and altcoin markets) are entering into a golden opportunity. that has to be taken 100%. Don't know where is the bottom for CRYPTOCAP:ETH on a short scenario. But, what I can certainly say is that won't fall as a stone for too long.
Ranges between 1400 - 2000 USD are gold prices to make progressives buys. Although it could fall even more ( 900 - 1200 USD) I think this is a high Risk reward buy.
But, timing is not on time. Shouldn't I sell, expecting a bear market( you know Halving and Posthalving ideas). Times have changed as the macro scenario has not been the same as the previous bullruns.
So, it's time to accumulate and expect a possible expansion cycle in 2026.. That could lead Ethereum to prices never seen before. Yes, the range between 8.000 - 15.000 USD.
As I always say. Just my opinion. Stay safe!

CATI Memcoin. Main (essentially secondary) trend. Channel. 25 05Logarithm. Time frame 3 days (less is not necessary). Decline from the maximum -94%. As a rule, altcoins (ticker name, legend, imitation of usefulness does not matter) of such liquidity decline in their secondary trend until its reversal by -95-98%.
But, at the moment, there is a significant increase in volume, this is a good sign, if the price goes beyond the resistance of the descending channel, then a trend expanding triangle will form, or as it is also called the Livermore cylinder (dynamic zones of support / resistance of the "participation" phase).
In order not to miss the reversal, if you are afraid to gain a position now, then work with orders for a breakthrough, that is, a trend break.
🟣For 2 months now, a sideways trend with a 100% step, the price is being pulled to the resistance of the descending channel.
Breakthrough of it — trend reversal.
Not a breakthrough , decline to the next "shelf".
Everything is quite simple and logical. All levels and zones of potential minimums and maximums are shown. Remember, the average price of the set and reset is important. The key resistance zone after the reversal, where you will need to dump most of the position, or everything, is highlighted in gray.

SOLANA - Light it up
SOLANA can flip the $185 resistance into support, it opens the door for a potential rally toward the next key levels:
T1: $241
T2: $301
T3: $371
T4: $468
The structure is clean, and the market sentiment is shifting. As long as SOL holds above the reclaimed range and macro conditions remain supportive, this setup could deliver serious upside.

XRP vs XVG 8 Year Triangle Fractal Comparison 05 2025Logarithm. Time frame 1 month. Linear chart for clarity. Two cryptocurrencies of the super hype of altcoins in 2017 (the final alt season of the cycle before last). XRP is ahead of XVG. The structures are similar, but if XVG breaks through the triangle upwards like on XRP, then work with the first target, observing risk management. You can leave 5-10% of the position for the second target, but this is not necessary. As for XRP, everything is as before... local update in the XRP idea.
XVG Secondary trend (part) Resolution of the triangle 8 years 05 2025
XRP/USD Main trend 28 07 2022
