Altseason and a Weak Dollar — Will History Repeat in 2025?The altseason of 2017 started at the same time as the U.S. dollar index (DXY) began to fall. This likely helped bring more money into the crypto market. In 2020–2021, a similar thing happened: the falling dollar was followed by a strong rise in altcoins. But that time, altseason started closer to the end of the dollar’s decline.
A weaker dollar makes risky assets like crypto more attractive. In April 2020, the total crypto market cap was around $218 billion. Today, it’s about $2.63 trillion — around 12 times bigger.
However, to start a new altseason now, the market may need a lot more cheap money than in 2020. I’m not sure if the 2025 altseason can be as strong as in the past.
Now it seems that the only way to repeat that success is if a big part of the capital moves from Bitcoin into altcoins. This would need a sharp drop in Bitcoin dominance. But this brings new questions. After the launch of Bitcoin ETFs, the ownership structure has changed. Many people now own Bitcoin through investment funds, not directly. These funds may not be very excited to invest in altcoins.
What do you think about it? Share your opinion in the comments.
Altseason2025

XLM/USDT Secondary trend. 14 04 2025Logarithm. Time frame 3 days. After a big pump "with a stick" (so that the "waiters" who want "a little cheaper" would not have time to buy) +8.5X from the accumulation zone of 2.4 years, now a descending wedge is forming on the rollback, similar to 2017. Breaking through its resistance (breaking the downward trend) - the second wave of price growth:
1) through consolidation and sideways movement (cutting the zone, dumping "in waves").
2) aggressive pump as in 2017 "with a stick" and entry into the main distribution zone (late autumn 2025)
The previous idea of the secondary trend was published on 14 01 2024 Exactly when the position was being collected in the horizontal channel in the 4 zones shown, as well as the reversal zone and the percentage of this first strong pump (under XRP).
XLM/USDT Secondary trend. 14 01 2024
XLM/USD Main trend. Timeframe 1 week. Channel. Publication in 2022.
Local wedge breakout zone.

''Altseason 2025''Welcome back dearest reader,
I will probably get alot of backlash from bitcoin maxi's for writing this post, i have read and heard it all by now. I'm not disregarding their opinion on bitcoin and i think it will do well, but not as well as some altcoins which i have monitored.
First the technical part:
~Bitcoin has seemingly formed a double top pattern with now on the weekly a gravestone doji (confirming this sunday). Looking at previous action from 2019 and 2020, these have been topping indicators and indicate a bearish reversal which in turn will be bullish for altcoins.
~ MFI --> massively overbought.
~ Stoch RSI --> nearly at 100! Screaming for a reversal.
Over the past months everyone seemed to think ''this is the top, only to see dominance rise further and alts bleeding''. It is possible that BTC.D doesn't correct immediately, but i do suspect an altseason to be really close.
Sentiment: When everyone... i mean EVERYONE is bearish. ''Alts to zero'', ''bitcoin is the only good coin'', ''Ethereum is dead''. This has historically been the perfect time to buy. And that time is now.
''But, there are over 13 million altcoins now!''
Yes this is true, i don't think all of them are going to do well, stick to the ones available on big exchanges. Those have 400 different ones on average. From those i have covered some allready which i think are going to do well, it's worth your time to look at those ideas.
Any questions?
Ask.
~Rustle

[UPDATE BTC.D] RANGE ?? 69-46-88??We either going to front run (red scenario) or go for a last crash end of Q2 then up only until the end of the year/beginning of Q1 2026. Then down until the end of the decade.

Total 3 targeting 1.5TWelcome back dearest reader,
This is going to be a short one, all information is in the chart above.
Total 3 has been in a Massive Cup and handle formation.
Measured from the base of the cup till the top of the handle gives us a ''total 3'' price target of 1.5T$ which is 100x from here. If you were to do a different analysis and like flags more then we come to the same price target of 1.5T$ (Blue bars).
Price action is now retesting resistance from march 2024 as support. When this is done i expect blast-off mode.
~Rustle

MAJOR BULL RUN RALLY INCOMING !!! Starting From MAY 2025 !!!On Big Picture starting from 2020....
Inverse H & S was formed... after breakout we got pull back & then it started 8 months rally from September 2020 To April 2021.
Then after deep bear market, we got Inverse H&S... after breakout, we got pull back & then it started 8 months rally from September 2023 To April 2024.
Now. we got big H&S... after breakout, we are getting pull back & now we are almost near at support level of H&S. From around 74-66K region, reversal bull run rally is expected which will most probably start from next month ( May 2025) and around after 8 months (October-December) we would be roaming ATH around 300K !!! which tags exactly at major resistance line. By copy pasting 2021 rally's candles pattern on current scenario, we can see exactly how things are going to shape in upcoming months.
Lets Hope For The Best !!!

TOTAL3 UPDATE!!! GET YOUR ALTS BAGS READY !!TOTAL3 has reached PRZ zone of bat pattern aligning with elliott wave count. Frrom here we may see major shift in alts. Get ready for the ultimate altseason boyz!!!

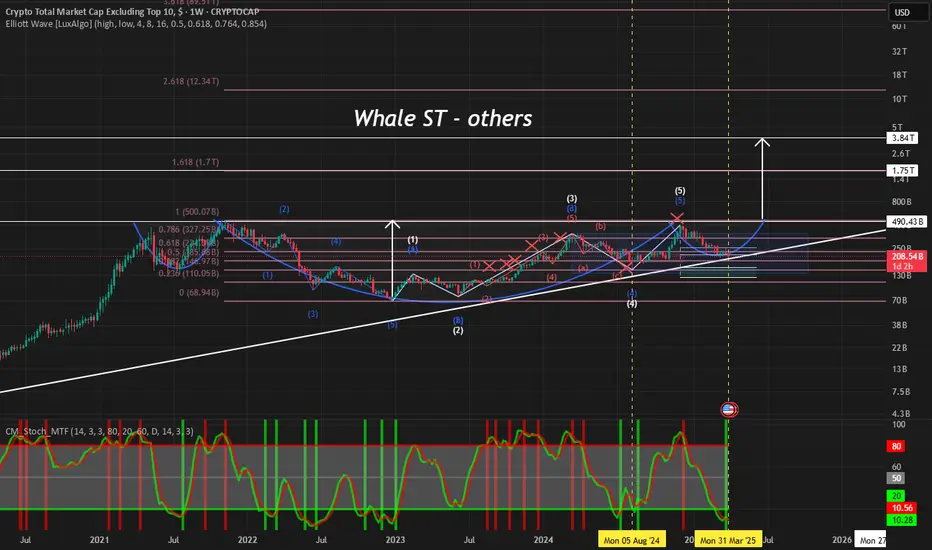
$others @whalest_The Others chart has not yet seen its old peak. I think the big rise will start soon. This chart represents other altcoins except for big projects. There will be exciting times soon.
sui usdt ready to lead ALTS?Looking to long SUI as close to 2.4 as possible
Reclaimed key support level after forming A&E pattern
Above 50 level on both 4h and 12h rsi
Was the fastest horse of the market when the market started its trend in 2024. Should lead again
Broke out of the trendline after the fakeout. Usually fakeout --> retest support --> real breakout occurs

Altseason 2025 is upon us *A different take*Welcome back dearest reader,
I've been covering some altcoins i'm bullish on, and a deeper dive into bitcoin dominance is key for their succes. Well the downfall of the dominance that is.
On the chart:
~The fibonacci extension has shown gradual weakness throughout the cycles starting at the 1.618 then the 1, now the 0.786 is inbound. I expect it to be hit soon topping at around 66% dominance. We can see what happened next ''1''
~MFI is hitting an oversold zone like never seen before on the 3 month ''2''
~Stoch RSI is hitting an oversold zone and is bound to see a cross ''3''
Load up on your favourite alts and enjoy the ride.
~Rustle

CHZ/BTC about to score a goal?Welcome back dearest reader,
If you have been following me you're quite aware i'm very bullish on this project. Fundamentals aside the charts look amazing. And CHZ/BTC is no exception to this!
Deeper dive:
~Trendlines --> As you can see at trendline ''1'' chz has found support going way back to 2021, you can see what happened next. The bars pattern from 2021 has been copied and shows a strong impulsive move going into june. Trendline ''2'' just shows the downtrend we've been in in relation to BTC, i don't expect this to fall below legacy support ''1''.
~MFI --> The Money Flow Index (MFI) is a technical indicator used in financial analysis to measure the strength and momentum of money flowing in and out of a security, typically on a scale from 0 to 100. It combines price and volume data to help traders identify overbought or oversold conditions, often signaling potential reversals in the market. As we can see it's massively oversold and yearning for a reversal ''3''.
~Stochastic RSI --> The Stochastic RSI (Stoch RSI) is a momentum oscillator that combines the Stochastic indicator and the Relative Strength Index (RSI) to measure the RSI's position relative to its recent high-low range. It ranges from 0 to 1 (or 0 to 100 when scaled), helping traders spot overbought or oversold conditions and potential trend shifts with greater sensitivity than the RSI alone. For CHZ also in a massive oversold condition ''4''.
Summary:
~Trend has bottomed and could provide a strong move for CHZ
~MFI and stoch RSI are massively oversold.
Note: This is the CHZ versus BTC chart, this means that even if BTC trades sideways or bottoms CHZ could do well. This would coincide with BTC.D dropping.
Any questions? Ask.
~Rustle

BTC.D at a Critical Juncture – Will Altcoins Take the Spotlight?CRYPTOCAP:BTC.D
The BTC Dominance (BTC.D) chart is at a critical juncture. Here's my analysis:
1️⃣ Key Resistance Area: The dominance has approached a significant resistance trendline. This zone is crucial, as it has historically acted as a turning point.
2️⃣ Potential Pullback: In my opinion, this could be the last pullback before BTC.D resumes its downtrend. If this scenario plays out, it could signal the start of the long-awaited altseason.
3️⃣ Break Confirmation: Keep an eye on the lower support level highlighted on the chart. A clean break below this level (more secure than the previous one) would confirm bearish momentum and strengthen the case for a further decline.
4️⃣ Targets: The first target is around 50.81%, with potential for deeper declines if momentum continues.
💡 Key Takeaway: This analysis suggests that BTC dominance is showing signs of weakening. If the support breaks, altcoins could gain significant market share. Watch these levels closely and prepare for opportunities in the altcoin market.
What do you think? Do you agree with this outlook, or do you see BTC.D holding its dominance longer? Feel free to share your thoughts below!
#Crypto #BTC.D #Altseason

Stella, is she finally ready?Stella has been in a massive downtrend since it's run in 2021.
Looking at the above chart there is a reason to be bullish now and with a massive pricetarget.
It has been trading in a bull-flag for years and has recently broken out, AND retested the upper bound of the channel.
Target: 3$ (would mean an mcap of 3B, which is doable)
Stoploss: 0.035$ (would mean re entry of the channel and invalidates this idea)
Will update frequently when asked
Rustle

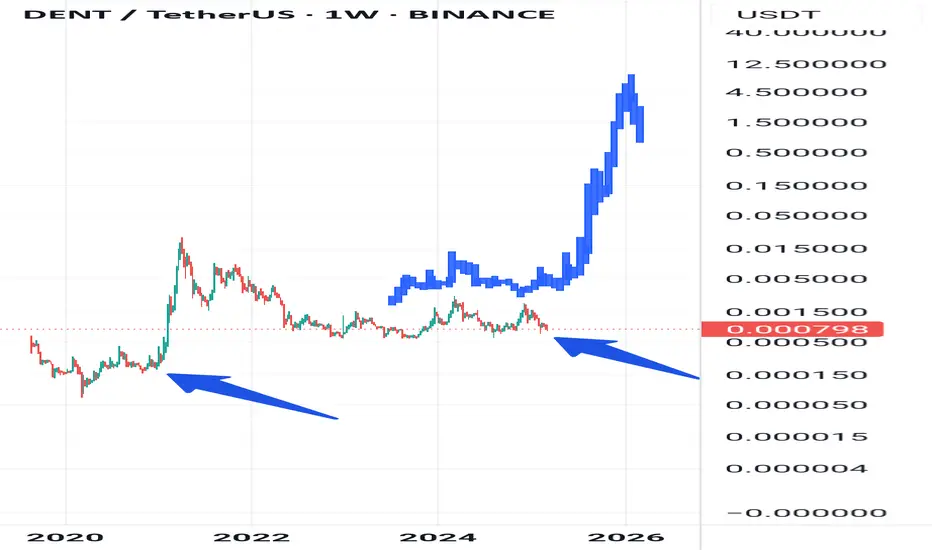
Is this pattern on Dent repeating?Look at the chart above. The bars pattern looks EXACTLY like the one from 2020/2021, but is a bit extended (which is in line with lengthening cycles).
Target: 0.08$ (which is about a 100x from here)
Stoploss: 0.0007$
Is this the one for you for altseason 2025?
Rustle
Will this same bars pattern on CHZ repeat?Welcome back dear reader, for another Chilliz post.
As i've been analyzing the chart further my eye fell on the bars pattern from May till October 2020, and noticed that it looks ALOT like the current bars pattern.
The market structure it would form would also make alot of sense from a traders perspective. Allow me to explain while i have your attention.
The only sellers remaining now are from 2021 or earlier, so we might stay in this area for a couple of weeks for people to capitulate. Those that got in earlier are eager for a break-even and will probably get that end of this month or beginning of April. Then around the latter half of May we might see 0.20$ followed by a retest of the lower bounds forming a perfect W as traders suspect it to be the absolute end of the bullmarket. Only for it to be followed by a quick recovery and a massive blowoff top!
Target: Remains around 3$ (The fractal would indicate 17$ and a market cap of 160B, at 3$ it would be 28B which isn't too farfetched)
Stoploss: 0.032$
Final remarks: Do i know for certain that it will happen? No, but the charts tell us a different story.
Rustle

Is altseason soon?Hi, traders 👋
I’d like to share my thoughts and observations regarding Bitcoin dominance and the timing of the long-awaited altseason.
In general, I like to determine the phase altcoins are in by analyzing one of the oldest representatives of this group — Litecoin.
Like other financial instruments, cryptocurrency tends to follow certain patterns. Although each cycle comes with its own unique characteristics, historical similarities are often present.
Let’s take a look at the Litecoin chart.
When reviewing the chart, we can see a number of similarities with the previous cycle. Based on this, and if we assume that markets are cyclical and certain chart patterns and behaviors tend to repeat, it appears we are currently either in the equivalent of March or September 2020.
The case for March is supported by the fact that we haven’t yet seen a final liquidity sweep according to the Wyckoff model — the so-called “spring” phase. On the other hand, the case for September is supported by the timing following the end of the previous bear market phase.
Now, let’s take a look at the Bitcoin dominance chart.
In this cycle, the dominance chart has been showing clear and reliable chart patterns.
The pattern that has been forming since November 21, 2024, could potentially be either a Wolfe wave or an ending diagonal triangle according to Elliott Wave theory. At the moment, waves 1, 2, and 3 are clearly visible, and wave 4 is currently in the process of forming. There is also a clear alternation between waves 2 and 4, which strengthens this observation.
If the assumption about the Wolfe wave pattern is correct, we should still see one final push higher in Bitcoin dominance as part of wave 5. This would likely lead to a further decline in altcoins. In that case, referring back to the Litecoin chart analysis, it would confirm that we are currently in the equivalent of March 2020.
I’m glad to share my observations with you.

Potential long trade $DAGPA UPCOM:DAG doesnt look like it used to be, but the company is still hard working & evolving.
If UPCOM:DAG breaks $0.05 with power, i could really see UPCOM:DAG go to $0.20
@ the end of Q1 they are going to activate staking, the change in metanomics will push the price higher. Significant amount of UPCOM:DAG will be burnt.
Also UPCOM:DAG will launch its own DEX end March/April. With the token ECONOMICS:PACA , because of this the network will be used more.
Things to look out for this year:
* Delegated staking ⏳
* Constellation's DEX ⏳
* Panasonic Metagraph ⏳
* Sentiment Metagraph ⏳
* USA National DigiFoundry Metagraph to mainnet ⏳
* Intrana Metagraph to mainnet ⏳
* Upsider Ai Metagraph to mainnet ⏳
* Cyberleet Metagraph to mainnet ⏳
* BioFi Metagraph to mainnet ⏳

Orbs to provide a 20x?Welcome back dearest reader!
Today we will analyse another project called Orbs. Looking at their website the fundamentals look great! But other than that, the chart also looks fantastic!
When looking at past performance its clear orbs has been in a massive flag formation since march 2021, it has broken out in october 2023 and has just now touched a very important support zone! Expecting upside momentum from here untill august.
Target: 0.40$
Stoploss: 0.0145$

Other Dominance - Bull Market Continues Updated Idea !It appears OTHERS.D made a double bottom at 7.8% prior to a huge bullish move and made a bear trap by breaking the monthly trendline on this monthly chart! The projection remains the same Bull market target of Other.d may come to fruition anywhere from October to December 2025. I remain bullish on Altcoin dominance going forward !

Real Actual Alt Season Tracker!In Crypto Autumn (post halving years), look at how BTC/TOTAL2 collapses and OTHERS/BTC soars into Quarter 2 & 4! Will this year be different?

Bitcoin going to move to 320K?As the market is cooling down after the Trump rally there is only bearish sentiment left. People calling for ''the liquidation of M. Saylor'', ''the bearmarket'', ''BTC to 0!''
In the chart above we can witness an almost textbook version of a MASSIVE cup and handle pattern. It broke out of the neckline on nov 4th last year and is now on it's path to retest it.
Should it hold i expect the bullrun to continue soon. So see this post as a light at the end of the tunnel.
Target: 320K
Stoploss: sub 70K (there is resistance at 70/66K area)
Rustle

Will this bottoming pattern return you 300%?Dearest reader, superrare has been showing tremendous strength during the recent downtrend by which RARE captured my eye. A whopping 4000% increase in volume in just one day might be a sign for things to come.
Looking at the above chart a couple of things stand out. Looking at the current bars pattern is looks eerily similar to the one from August 2024 (blue arrows).
I expect resistanceline A to be hit in the near future, from current price this would be 100% gain. If broken the sky is the limit but be aware of resistanceline B. If that is broken... expect massive gains!
Target: 0.35$
Stoploss: 0.046$
Rustle

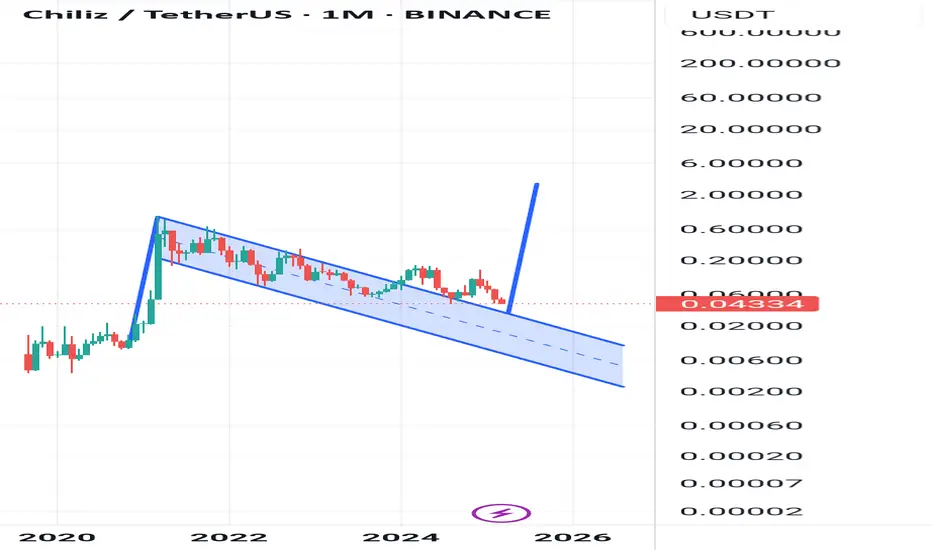
Have you considered this alternative?Chiliz (CHZ) leads innovation in fan engagement with their favorite teams through blockchain technology. Its platform enables the creation of Fan Tokens that offer users exclusive access to experiences and decisions related to sports clubs, eSports teams, and more.
Chz has been trading in a massive bullflag as seen in the above analysis. Although it hasn't seen alot of love recently i suspect it will do well in the coming months ahead.
Target: 3$
Stoploss: 0.032 (upon re-entry of the channel)
Rustle